Grapheme TK 1.1.0
New features
Added the following to visualize color forcefields:
Added the following to visualize the reference molecule of a color and shape overlap:
Added the following to visualize shape and color overlaps:
Note
A valid shape license is required to use any of these new shape or color APIs.
Added the OEDepictionFrom3DOptions class that allows more advanced customization of the generation of 2D coordinates driven by the 3D conformation when calling the
OEPrepareDepictionFrom3Dfunction. By default,OEPrepareDepictionFrom3Dis tuned for generating 2D coordinates for representing 3D overlays in 2D. This class allows the 2D coordinate generation to choose a set of 2D coordinates that are much closer to how the molecule would look in a 3D viewer.Added the following to render user-defined labels when depicting color gradients:
Added
OEColorGradientDisplayOptions.ClearBoxRangemethod to remove the box range previously set to a color gradient.Added
OEGet2DSurfaceArcsfunction to return the arcs of the molecule surface of a specific atom with the given radius. Varying radii can be passed to generate multiple surfaces in the range specified by theOESurfaceArcScalenamespace.OEGetMoleculeSurfaceScalecan be used to determine the appropriate scale for the molecule with the specified radius.
Implemented the shapeoverlap2pdf.py Python Grapheme TK example.
Major bug fixes
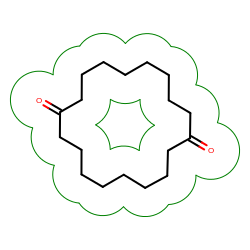
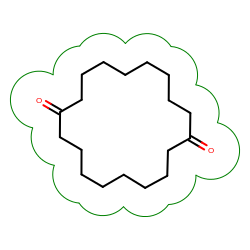
Molecule surface arcs inside macrocycles are no longer returned. See the effect of this change in Table: Example of depicting molecule surface.
Example of depicting molecule surface Grapheme TK 1.0.6 (2013 Jun)
Grapheme TK 1.1.0 (2013 Oct)


Documentation changes
All images were automatically regenerated to reflect the changes made since the previous release.