Running SZMAP at Coordinates
SZMAP can be run at arbitrary coordinates,
for example the atom positions in the ligand.
Because this calculation is performed only over the atom coordinates specified in
-at_coords <mol_file> it will run very quickly, around 1 minute for this example.
While not as informative as a full grid calculation, “at coords” calculations
are a rapid way to survey a binding site (about 20 seconds on four 2.8GHz processors).
> szmap -mpi_np 4 -prefix 4std_lig_coords -at_coords 4std_lig.oeb.gz -p 4STD_ABC__DU__BFS_A-173.oedu -excludeDUligand

or

> szmap -mpi_np 4 -prefix 4std_lig_coords -at_coords 4std_lig.oeb.gz -p 4STD_A__DU__BFS_A-173_target.oeb.gz
The output for -at_coords calculations includes a text file containing tab-delimited
tables of results and an .oeb file with SZMAP results as properties
attached to the atoms used to define the coordinates.
Warning
If the at_coords positions overlap with atoms in the protein or design unit file, the coordinate will be skipped. The current clash definition is a near perfect atom overlaps (0.1A)
Analyzing Coordinate Results
If the calculations were done at specified coordinates (using the -at_coords parameter)
the results can be visualized with the Water Orientation VIDA Extension
or the Color By Atom Properties (which colors coordinates by calculated values). Open the file
in VIDA using the command below or, if VIDA is already open, by using the File >> Open menu.
> vida 4std_lig_coords.oeb.gz
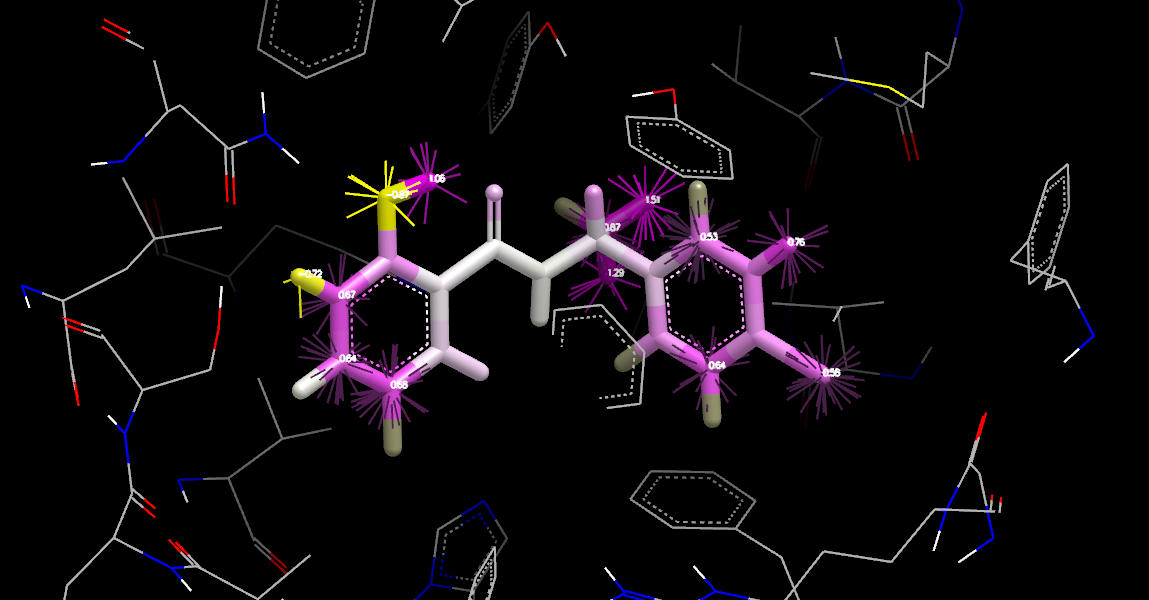
Apo Neutral Difference Free Energy at Ligand Coordinates
The figure Apo Neutral Difference Free Energy at Ligand Coordinates shows results similar to the Orientations and Displaced Neutral Difference Free Energy. Calculating at the ligand coordinates is very quick but produces a coarse sampling and in regions where the gradient is large, can be somewhat misleading.
To generate this figure, the Water Orientation VIDA Extension panel was accessed to
Apply to: 4std_lig_coords.oeb.gz/apo and the Update button was pressed. Next,
the apo: at_coords entry in the list window was selected and
the “H” button in the style panel was used to display all the ligand hydrogens.
With the apo: at_coords entry still highlighted in the list window,
the Color By Atom Properties was opened and the property szmap_neut_diff_free_energy
was selected. Then, if this is the first time the panel has been used, the color tiles
in the center-left were selected one-by-one and changed so that the left one was yellow,
the center one was white, and the right one was purple (the standard SZMAP color scheme).
The missing values color tile
was also set to a dark gray color easily distinguished from the others. Finally, the options
“Lock middle color to zero” and “Missing Values” were checked.
The dark gray atoms along outer edges of the ligand are at
positions where a water probe is slightly too large to fit without clashing, but
it is worth noting that this can occasionally be alleviated with a shift of just a fraction
of an Ångström.
Two-dimensional Coordinate Reports
In addition to the 3D graphics,
you can also produce a printable .pdf report of -at_coords results
with SzmapReport. The molecule is shown in 2D, colored
by their numerical value of the SZMAP results.
If multiple ligands were used for the coordinate calculations, SzmapReport
will depict all of them for easy comparison.
> szmap_report 4std_lig_coords.oeb.gz 4std_lig_coords.pdf szmap_neut_diff_free_energy
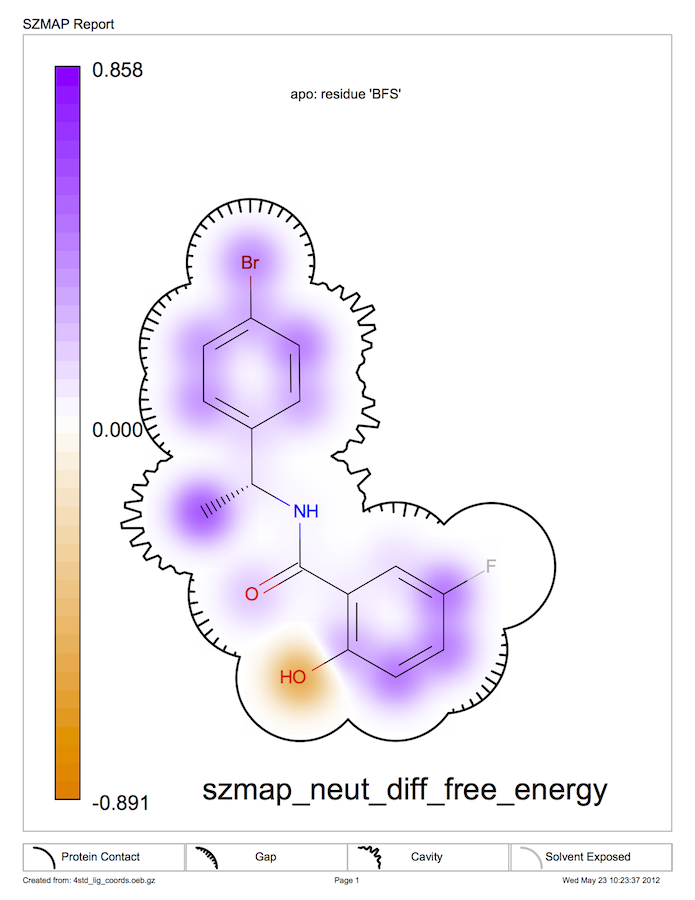
Neutral Difference Free Energy in 2D
Figure Neutral Difference Free Energy in 2D shows a SzmapReport for the neutral difference free energy with a surface representing how tightly or loosely the ligand fits into the binding site. See chapter SzmapReport for more information on this surface representation. In this case, the phenolic ring is held tightly while the methyl group is adjacent to a cavity. The pocket around the fluorine is so tight that a probe water cannot fit there, indicated by the gray color of the fluorine atom.
Stabilization at Coordinates
While calculations at ligand atom coordinates cannot produce stabilization energies, calculations at coordinates other than the ligand can. They can also be very quick ways to explore properties of the complex, with the same caveat that they represent a coarse sampling.
In our example, the two crystallographic waters closest to the ligand are split from the original PDB file and used to calculate stabilization values at these coordinates. Although the splitting can also be done with VIDA or with a text editor, here we use the egrep command generally available on Linux, Mac OS X or Windows cygwin.
> egrep 'HOH A 187' 4std.pdb >  4std_selected_waters.pdb
> egrep 'HOH A 190' 4std.pdb >> 4std_selected_waters.pdb

> szmap -prefix 4std_wat_coords -at_coords 4std_selected_waters.pdb \
>       -mpi_np 4 -stbl -p 4STD_ABC__DU__BFS_A-173.oedu

or

> szmap -prefix 4std_wat_coords -at_coords 4std_selected_waters.pdb \
>       -mpi_np 4 -stbl -p 4STD_A__DU__BFS_A-173_target.oeb.gz
Tip
The line above with a ‘\’ as the very last character indicates that the command was too long to fit on one line and continues on the following line.
Analyzing Coordinate Stabilization Results
> vida 4std_wat_coords.oeb.gz
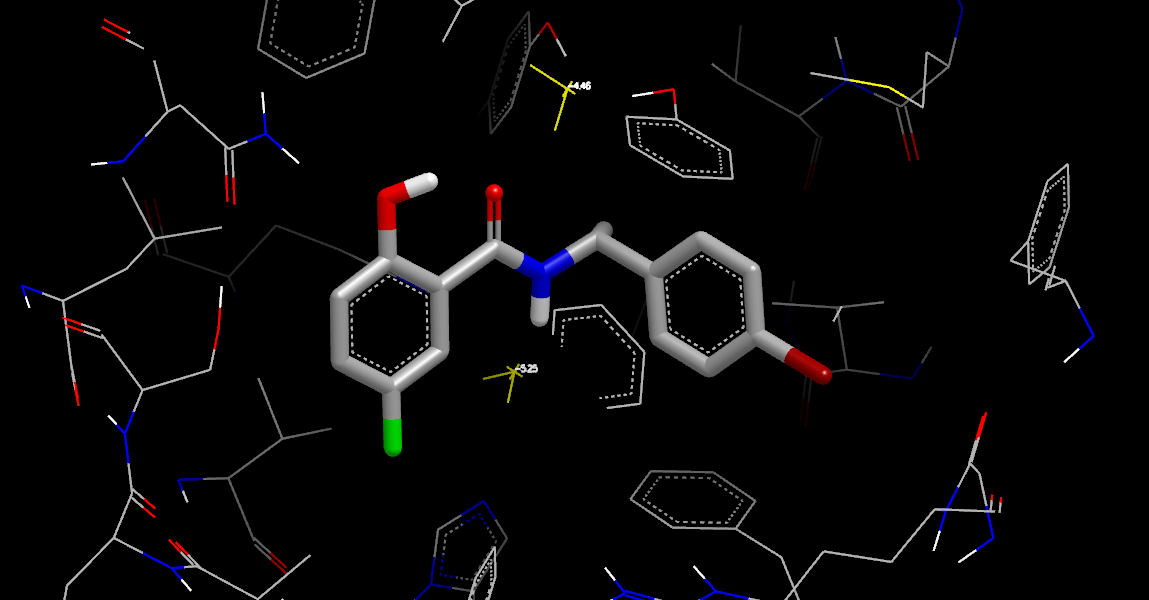
Complex Neutral Difference Free Energy at Water Coordinates
The Complex Neutral Difference Free Energy at Water Coordinates (with orientations and energies from the Water Orientation VIDA Extension) shows results similar to the Complex Neutral Difference Free Energy but were produced much more quickly.
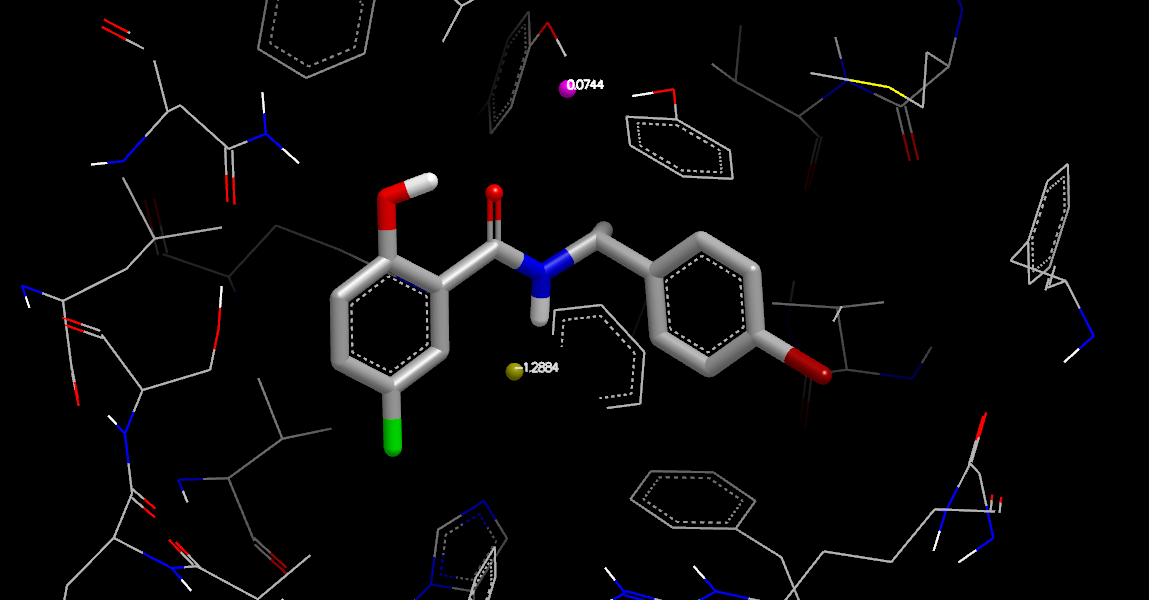
Stabilization Neutral Difference Free Energy at Water Coordinates
In Stabilization Neutral Difference Free Energy at Water Coordinates, the stabilization: at_coords waters were highlighted in the list window and colored based on the property szmap_neut_diff_stbl_free_energy using Color By Atom Properties. No orientation data is shown because orientation information is not produced by stabilization calculations, only complex, ligand, and apo calculations. But using VIDA’s generic data labeling capabilities, the coordinates can be labeled by the neutral difference stabilization free energy values. This is a quick way to visualize energies from a stabilization grid calculation. Rather than using crystallographic waters in the calculation, the “at coords” positions can be waters from a previous grid calculation using the “Split” tool in the Water Orientation VIDA Extension, or generated by some other procedure.