The Water Orientation extension provides a means of accessing
the calculated properties of key water sites and orientations stored
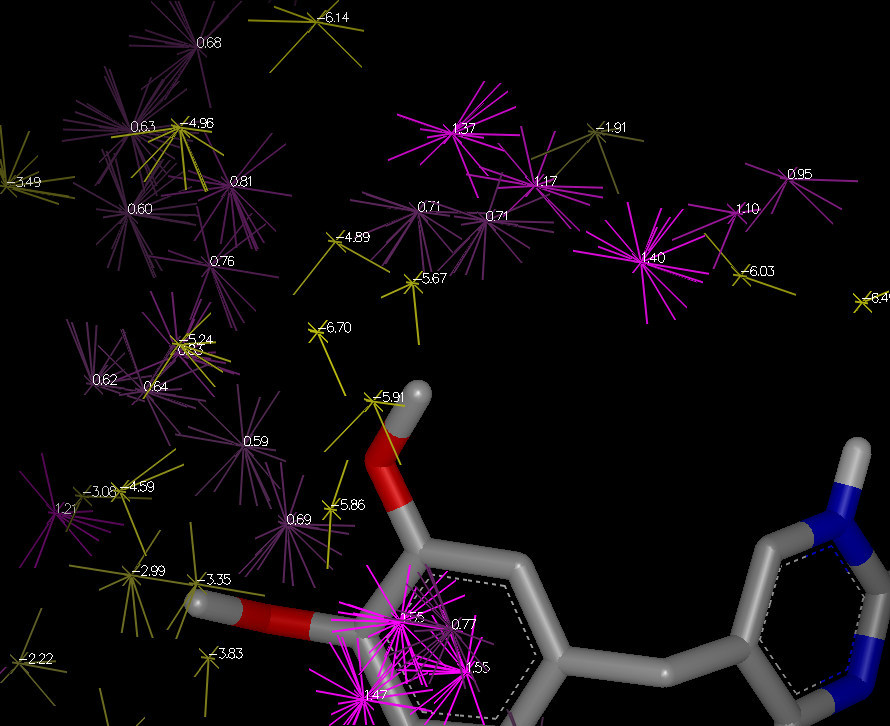
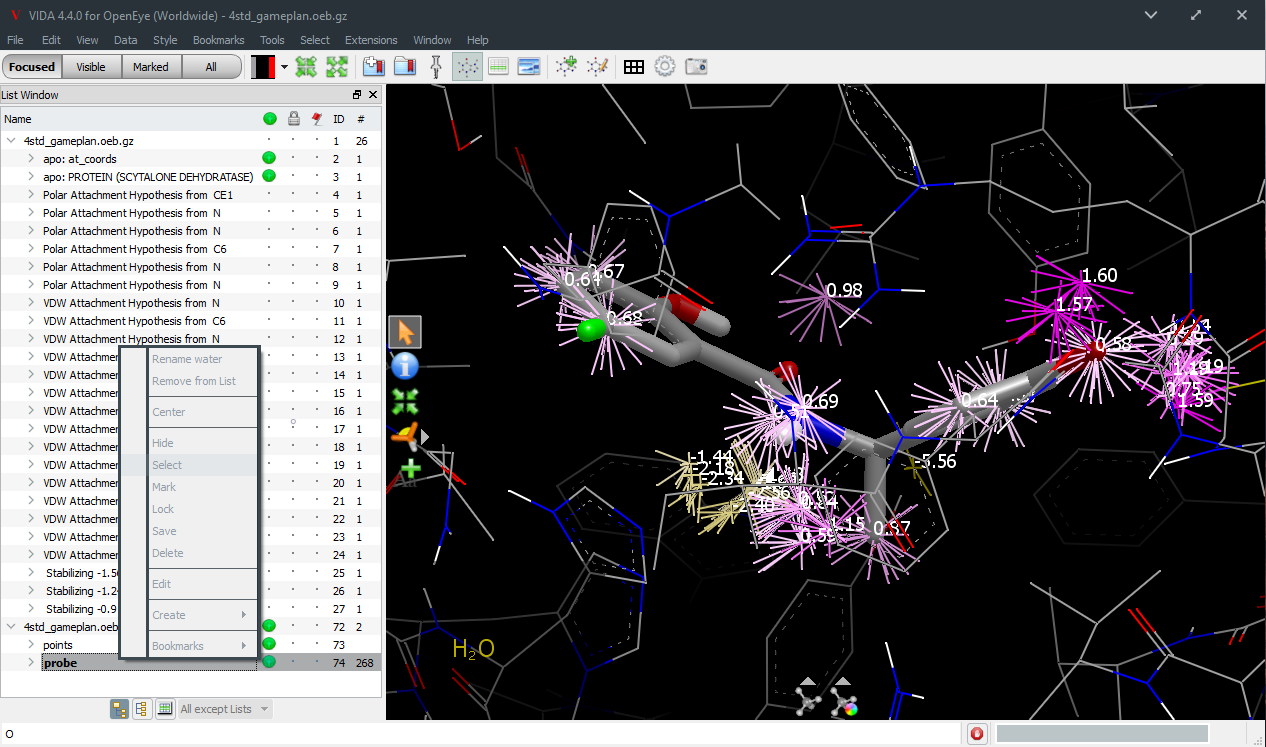
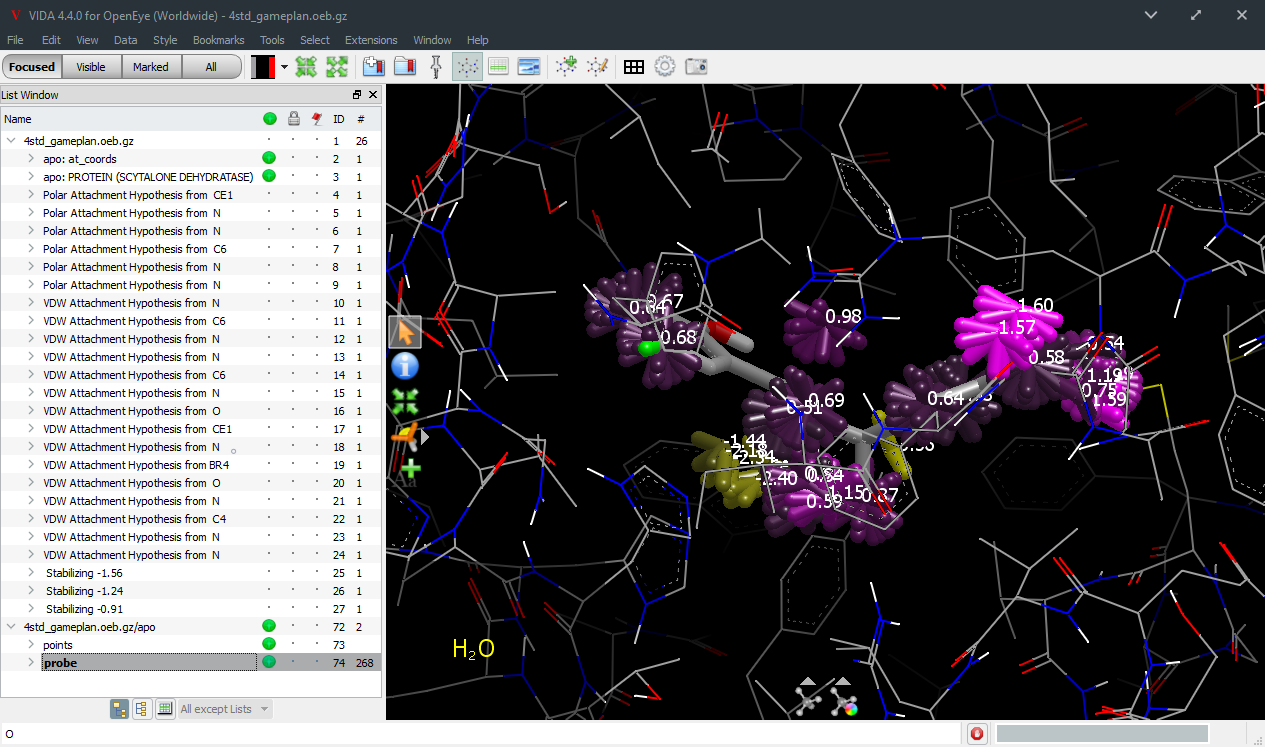
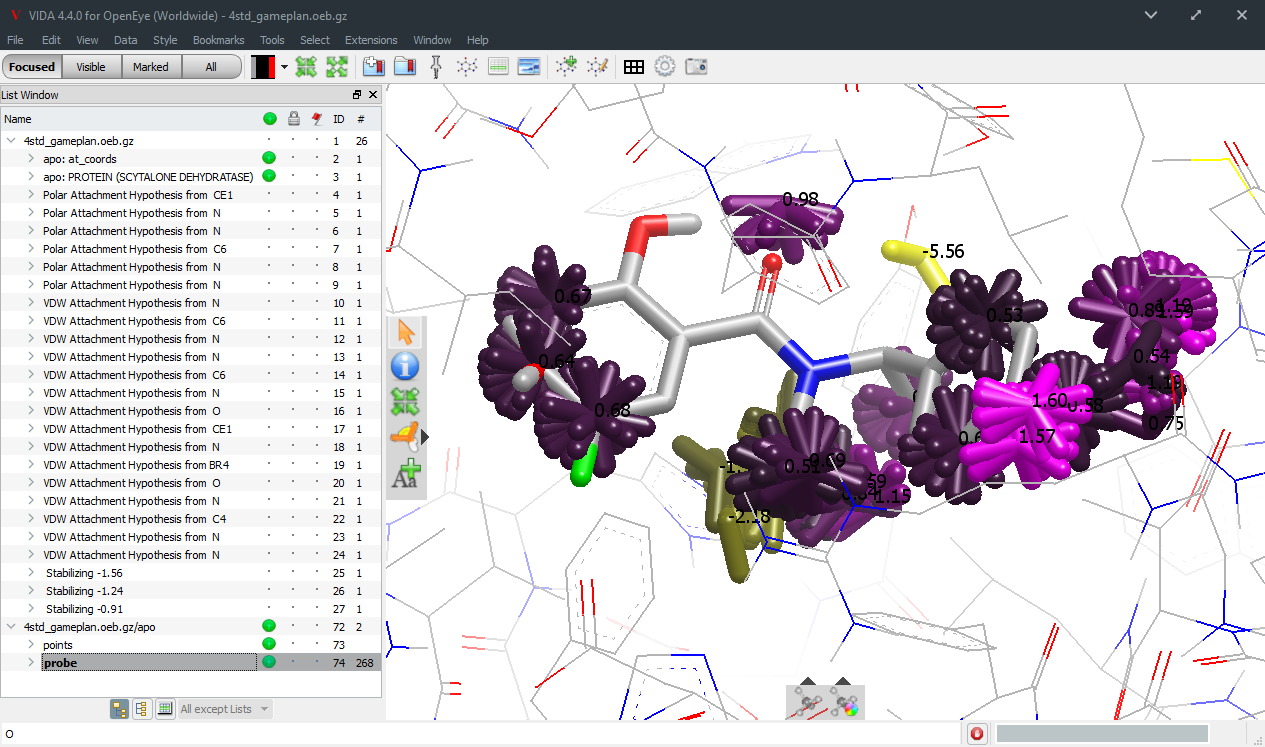
within an SZMAP results OEBinary file. The figure
Water Orientations With Energy Coloring shows
an example of the display, with dominant points colored and labeled by their
SZMAP energy and the highest probability probe orientations indicated
(yellow: negative energies, purple: positive energies).
To get started, load SZMAP results into VIDA—both grid calculations
or -at_coords calculations will work. Highlight part of the results in the list window
and run the WaterColor VIDA Extension.
Then, if the Water Orientation panel is not already open, open it from the extensions menu.
Select the set of orientation data you want
to display with the Apply to pop-up in the panel and press the Update button.
The Water Orientation extension
will analyze the orientations and add a package of points and water orientations to VIDA’s
list window, colored by the selected color scheme, by Energy by default. Points
and water orientations can be displayed or hidden independently.
The numbers by each point
(energies or order parameters) always refer to all orientations collectively,
not any particular orientation, even if only one orientation is visible for a point.
The same is true of the color schemes, except for by Probability
where each orientation is colored differently (although the order parameter numbers
still refer to the ensemble).
Changing the filtering controls does not update the display until you press Update
again. Pressing the Duplicate button makes a duplicate copy of the package of points
and water orientations.
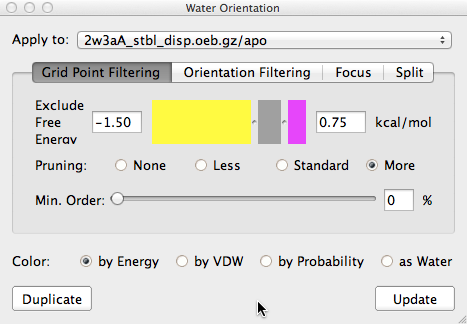
The Grid Point Filtering Panel
controls which points are displayed. It is generally
useful to show only the key points: those with the lowest or highest energies in each
region. The range sliders select which energies are excluded from display—values between
-0.5 and +0.5 kcal/mol are ignored by default. The range control is labeled with the type of
energy used: neutral difference free energy for results from SZMAP 1.1.0 and later,
neutral difference enthalpy for results from earlier versions of SZMAP.
Pruning is an operation that picks points
with the lowest or highest energies and then excludes nearby points where energies are closer
to 0.0 kcal/mol. The Min. Order slider controls the display of degenerate points, locations
where waters have little or no orientational preference. The default of 5% will only skip the
most degenerate points.
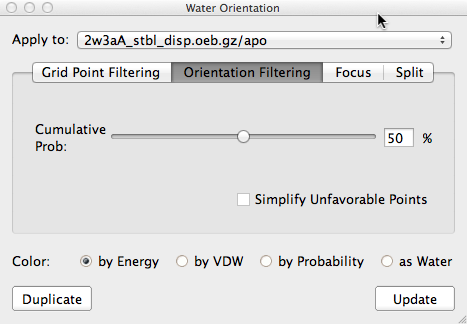
The Orientation Filtering Panel
controls the number of orientations displayed for each point shown. By
default the most probable orientations are show for each point with
favorable energies (< 0.0 kcal/mol), up-to a cumulative probability
of 50%. Since points with unfavorable energies are mostly degenerate
we usually simplify them, only showing the single most probable orientation.
Occasionally, it is useful to show more unfavorable orientations by
un-checking the Simplify Unfavorable Points check-box as was done to make
the figure Water Orientations With Energy Coloring.
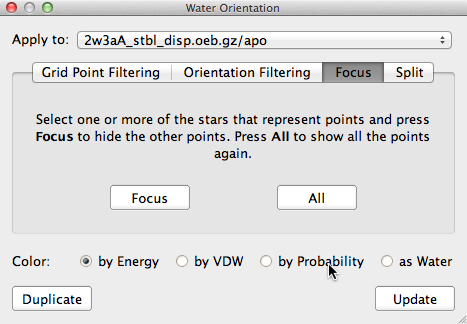
The Focus Panel allows you to select
one or more points generated by the Water Orientation extension and,
by pressing the Focus button, clear the display of all but the selected points.
Pressing all shows all the points once again. To select a point, click on the
cross at the center of each position (not the orientations) and to select
multiple points, use shift-click. Turning off the display of the water orientations
(the “probe” sub-section in the VIDA List window) can make it easier to click on the points.
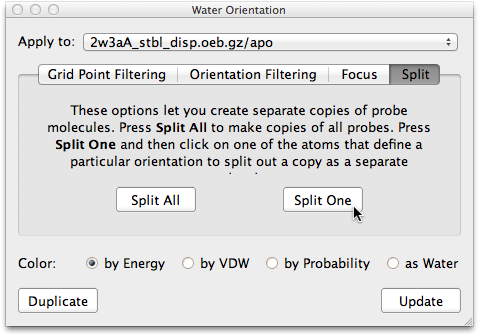
The Split Panel
provides a means of converting individual water orientations into
a separate molecule (including SZMAP partial charges)
which can be saved by VIDA and used in other calculations.
For example, a particularly structured water can be split out and
saved and then added to the protein as part of a SZMAP
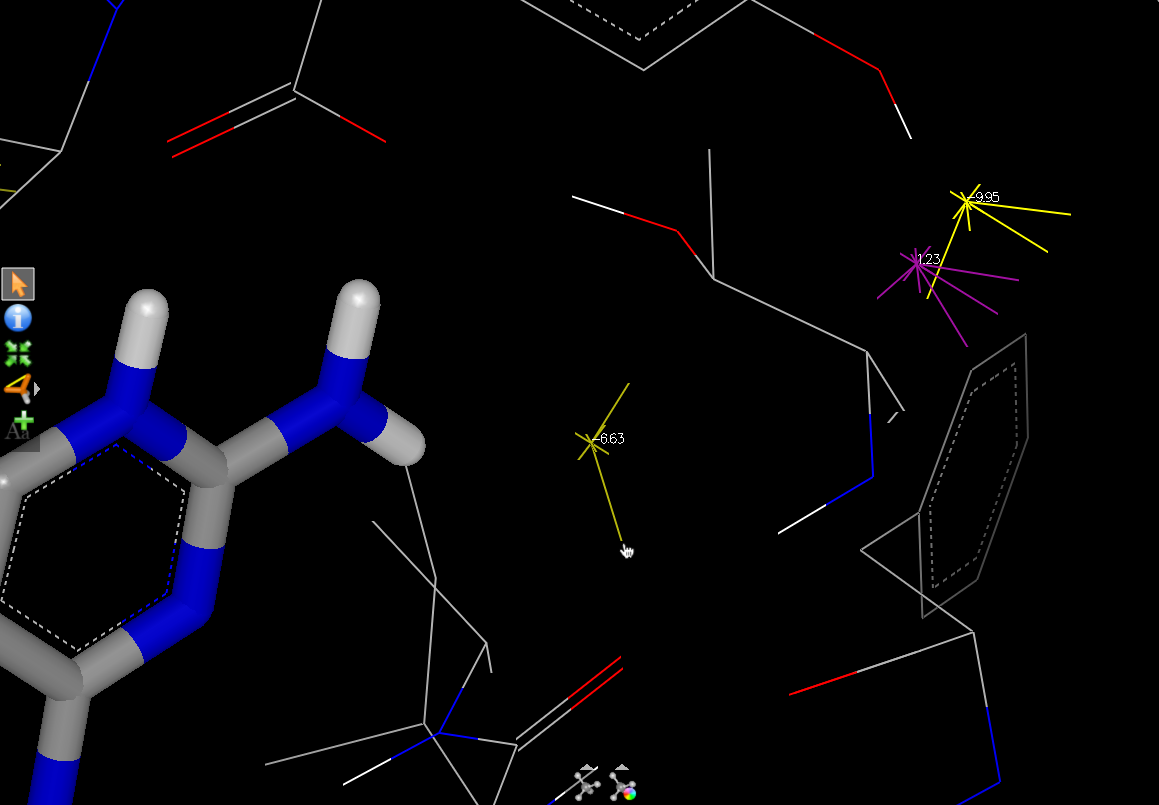
calculation. To use it, you press the Split Orientation button
(figure Split One)
and then click on one of the hydrogens in the orientation you want
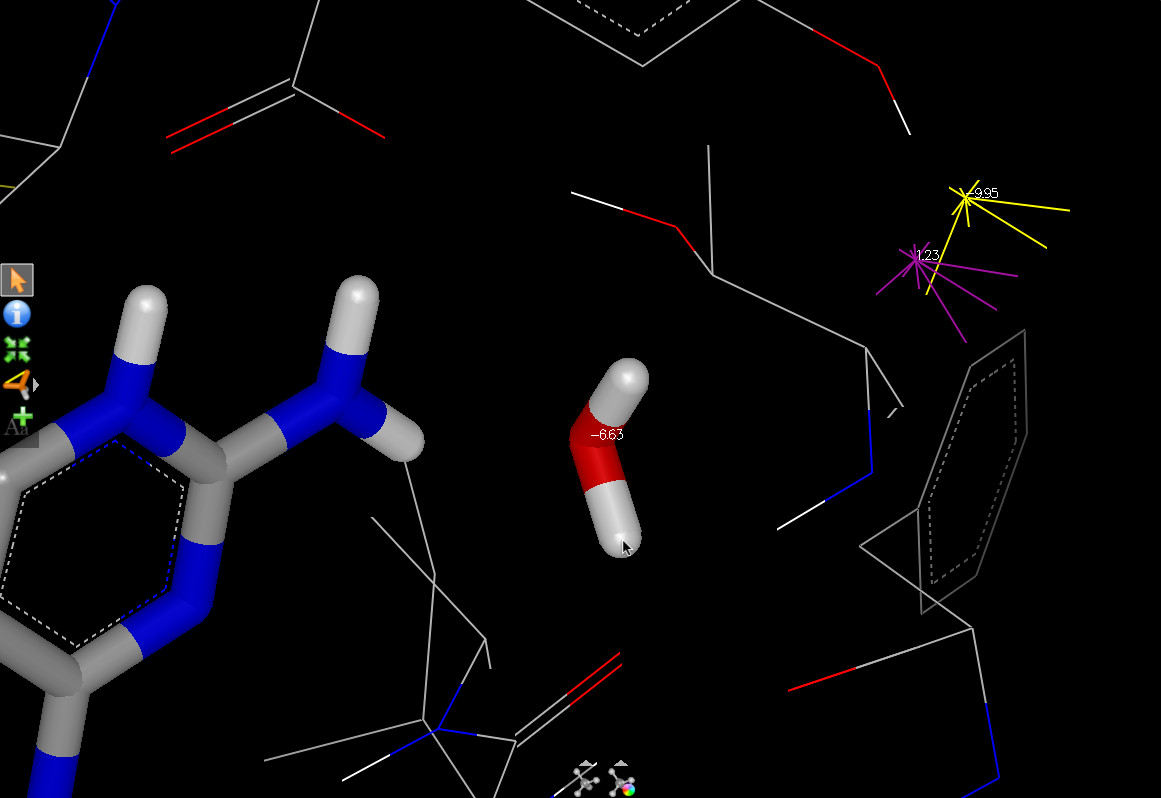
to split (figure Click on Hydrogen).
The selected water orientation will be reproduced as an individual
molecule (figure After Split)
which can be written out to a file, if required.
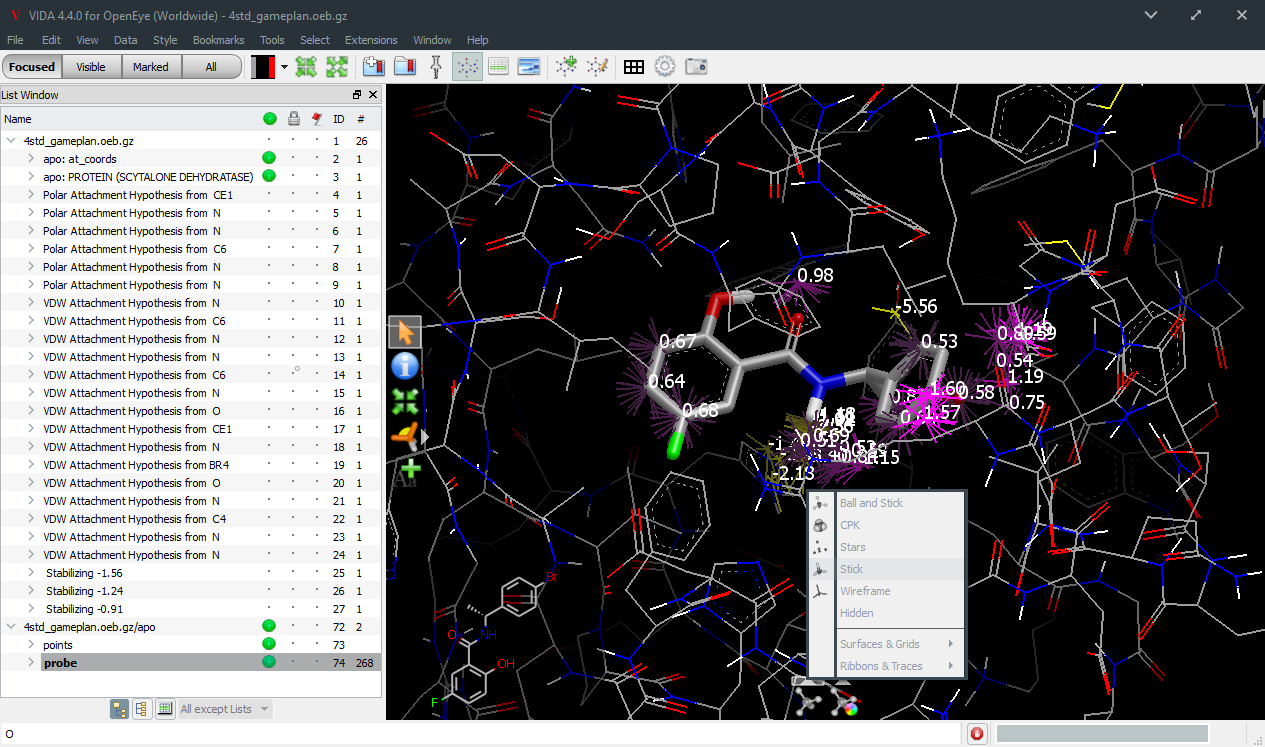
Changing the color-scheme results in an immediate update of the current
display. Besides the Energy Coloring
shown above, there are three other color-schemes. In figure
Order Coloring, each point is colored light-blue with brighter
colors indicating more ordered positions and darker colors indicating more
degenerate positions. Order represents a transformation of the entropy term
to normalize it between 0% and 100%, where a value of 0% represents a degenerate
point where all orientations are equivalent and 100% is a completely ordered point.
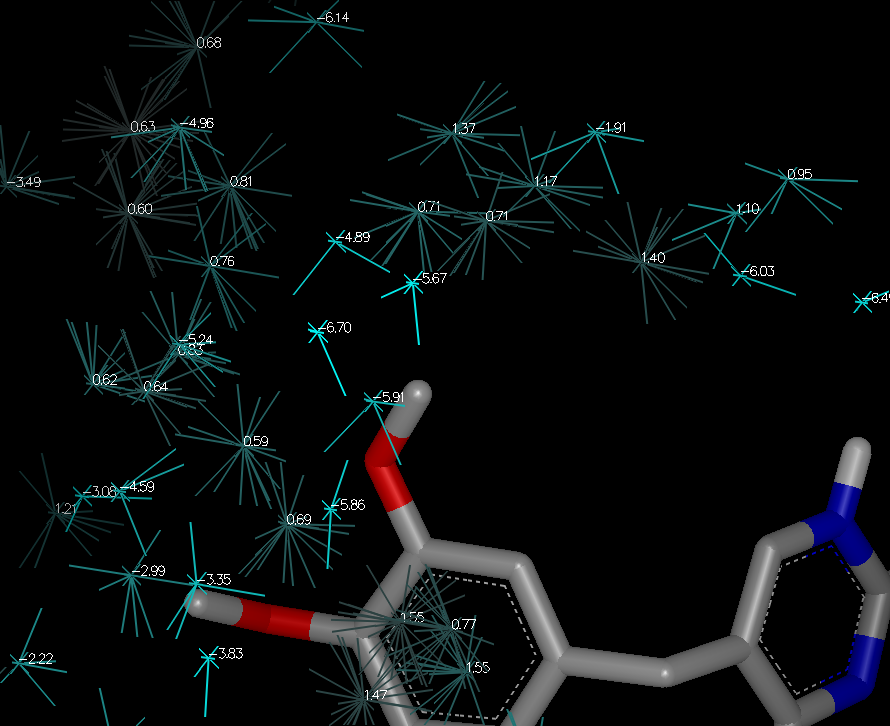
In figure
Probability Coloring, each orientation is colored green with brighter
colors indicating more probable orientations. This color-scheme is the only one that
will display multiple colors for different orientations a position,
whereas energy and order colors are ensemble properties.
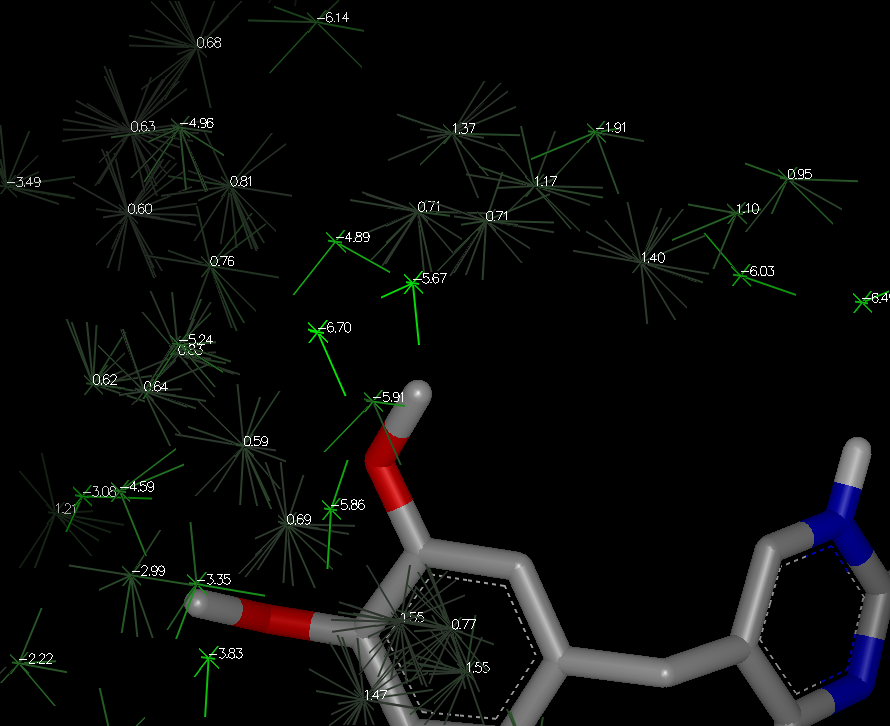
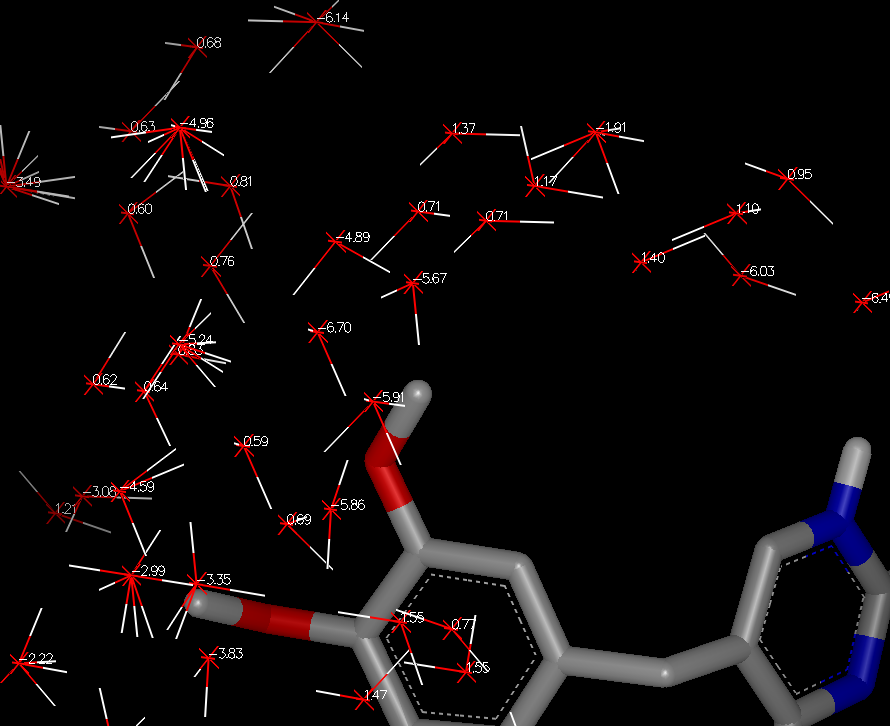
Finally, figure
Water Coloring shows the color-scheme where probe orientations
are colored according to the CPK colors for the corresponding atoms, red for oxygen and
white for hydrogen.
As shown in the figures above, individual orientations are rendered as thin (wireframe) lines.
Numerical energies and orientations are associated with the ensemble at each point and do not
refer to any particular orientation.
For presentations, it is usually better to “fatten-up” these lines by changing the rendering
style.
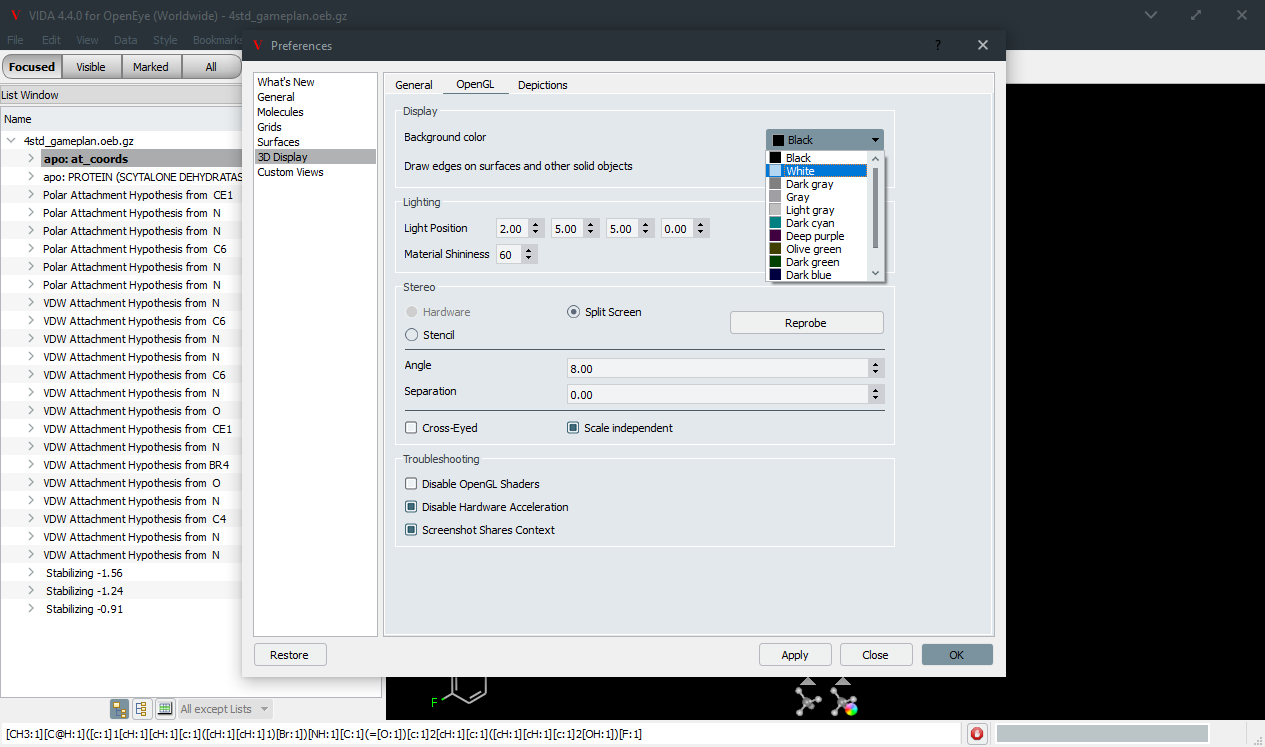
For presentations and publications, a white background which is recommended.
You can change the background color in
VIDA’s Preferences/3D Display/OpenGL window
(figure Changing Background).
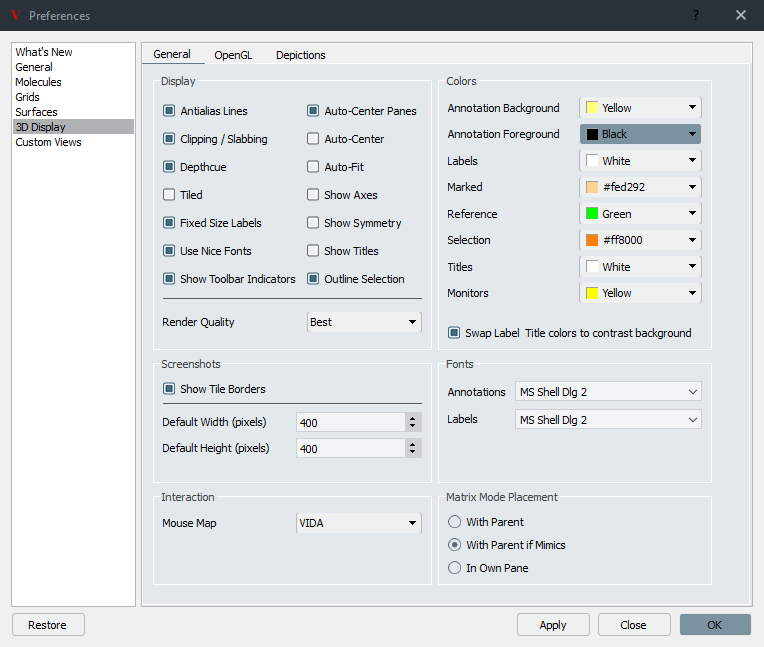
You can also adjust the text label color by choosing
VIDA’sFile >> Preferences menu (Vida >> Preferences on MacOS X)
selecting 3D Display and clicking on the General tab
(figure Changing Text Label Color).
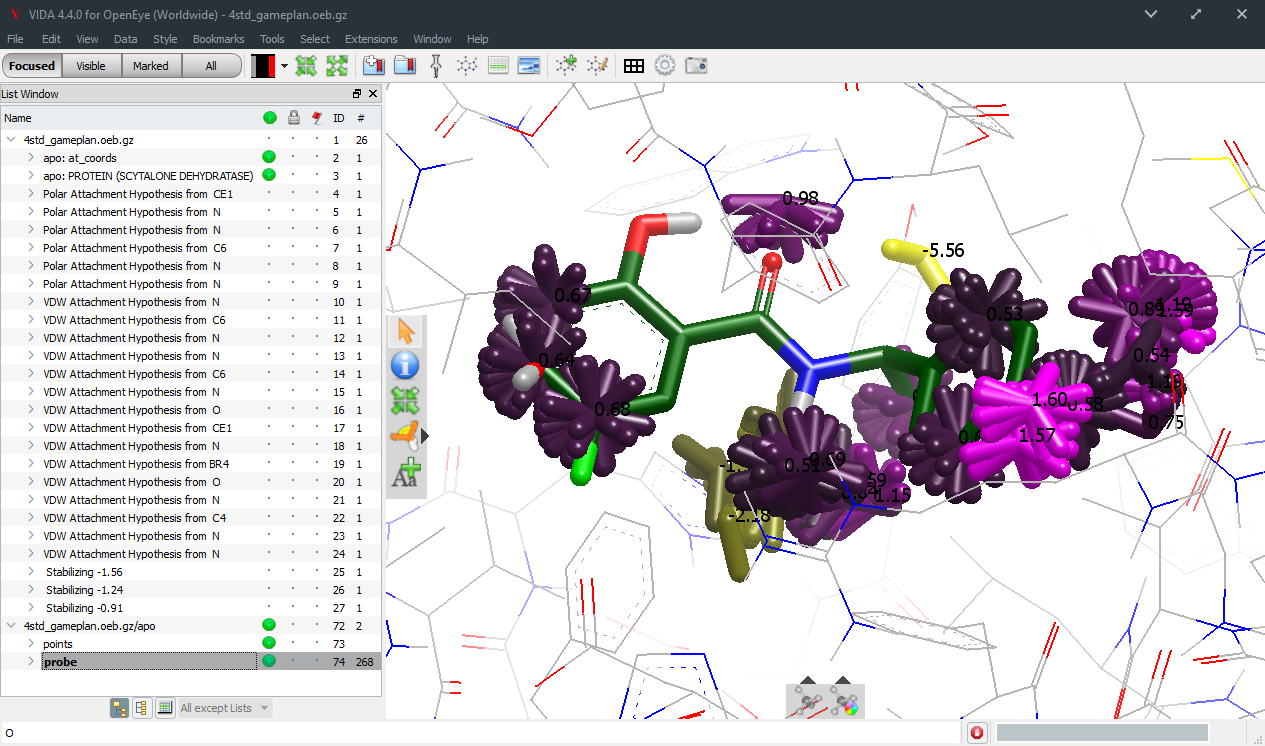
The result (see
figure White Background)
is works well for presentations. But most versions of VIDA
recolor carbon to green when the background color is white.
If necessary, you can change atom colors as follows.
Using VIDA’sEdit >> Select >> Query menu item, selecting carbon
either from the menu or by typing C (for aliphatic carbons)
or c (for aromatic carbons) in the query box,
and using the color pop-up at the bottom of the 3D window to
change the carbon color to gray, will usually produce a
more pleasing result
(see figure Gray Carbons).