Color By Atom Properties
The Color by Atom Properties extension provides a method
for displaying the results in an OEBinary file from a SZMAP calculation
performed using the -at_coords option. You can also view properties using
SzmapReport.
Color By Atom Properties
SZMAP results generated with -at_coords contain the molecule specified
by the -at_coords parameter with SZMAP results tagged as properties associated
with each atom. While these property values can be displayed as atom labels using
VIDA’s generic property labeling function,
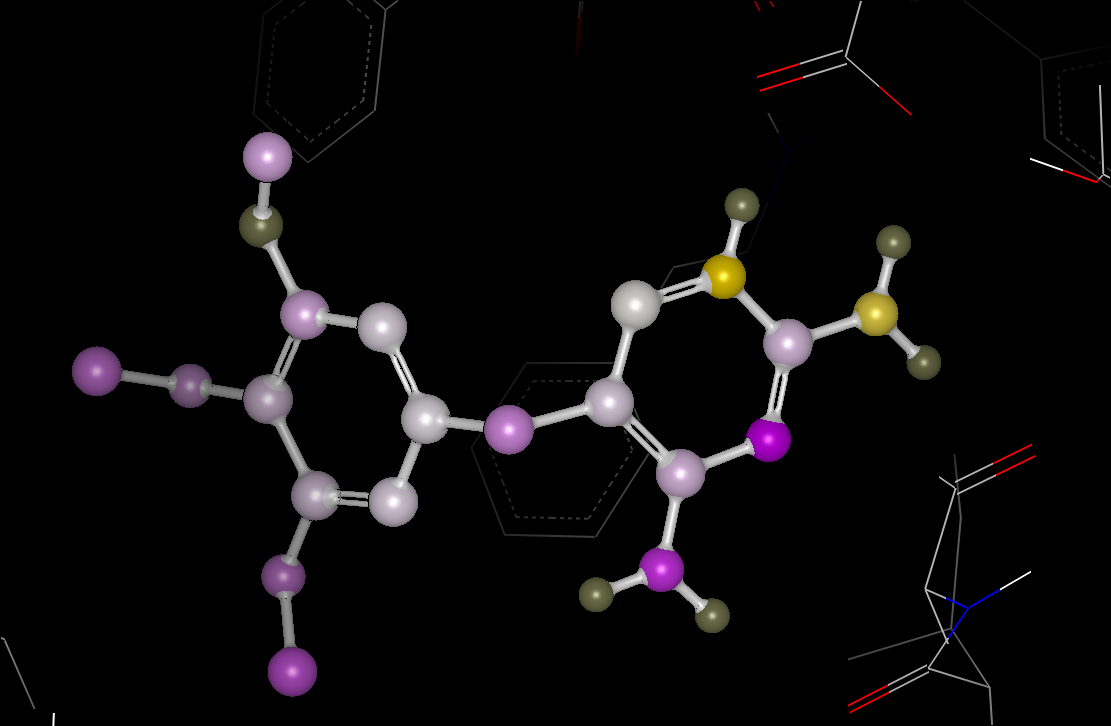
the Color by Atom Properties extension makes it easy to survey
these values by coloring the atoms of the active molecule
based on a color gradient defined by selected SZMAP data as shown in figure
Color By Atom Properties. Individual waters split out by the
Water Orientation VIDA Extension are also tagged with properties that this extension can interpret.
Color By Atom Properties Interface Panel
See Installing VIDA Extensions for information on installing the extension.
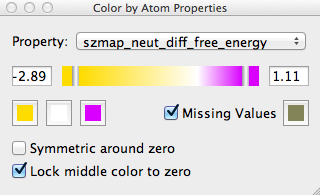
Bring up the control panel by selecting the Extensions >> Color by Atom Properties pull-down menu. The extension will only color atoms when the control panel is open. The extension (see figure Color By Atom Properties Interface Panel) is composed of several elements:
Active molecule is the at_coords entry selected in the VIDA list window: complex, ligand, apo, stabilization, etc.
Property drop-down box to select the calculated SZMAP property to display. Any property in any open molecule will be listed, even if only some properties are associated with the selected molecule.
Range Sliders (gray vertical bars in the color gradient) specify the range of values over which the three-color gradient will apply. Note atoms with values beyond the range selected will still be displayed, and will be colored by the respective high or low color.
Three Color Boxes on the lower left set the low, middle, and high color values for the color gradient. Atoms containing values within the range selected by the Min. Value and Max. Value sliders are colored using a linear interpolation between these colors.
Missing Values checkbox explicitly sets the color of atoms for which SZMAP values were not calculated. Checking this checkbox ensures that atoms determined to be masked out during the SZMAP calculations are colored a different color (specified by the color box on the lower right) to differentiate them from atoms that have a calculated value near zero. Missing values are found where the water probe clashes.
Symmetric around zero checkbox enforces a symmetric range where the absolute value of the Min. Value and the Max Value are equal. Activating this checkbox ensures that the positive and negative color scales are equivalent, and also dictates that the color selected as the middle color in the gradient will represent a value of zero.
Lock middle color to zero checkbox sets the color of atoms with values close to 0.0 to the middle color even if the negative and positive ranges are of different magnitudes.