Custom Views
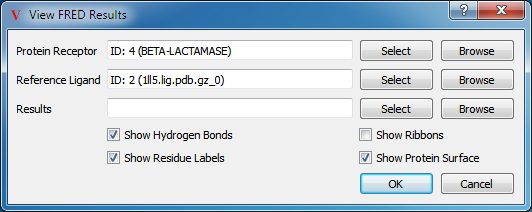
There are a number of very common uses of the 3D display which can take some effort to set up correctly by hand. For this reason, a number of automatically setup custom views are available. These custom views are designed to quickly show in an expected and logical manner the results of various different applications. Support currently exists for viewing FRED, ROCS, or EON results. These views can be accessed by choosing the desired option in the Tools menu. An example of the interface to each of these custom views can be seen in Table: Custom View Inputs.
|
|
|
FRED Results View |
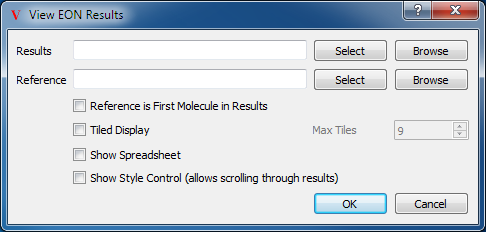
EON Results View |
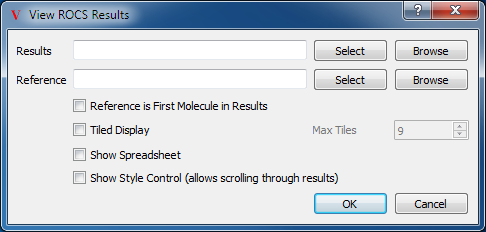
ROCS Results View |
The first thing to notice about all the views are the molecule choice buttons. The FRED View has three, while the EON and ROCS Views have only two. Clicking on the Select button next to any of these allows selection of a molecule from the currently loaded set. Clicking on the Browse button allows selection of a molecule from a file on disk. Following the molecule choice buttons are various check boxes for customizable display options for that view.
FRED View
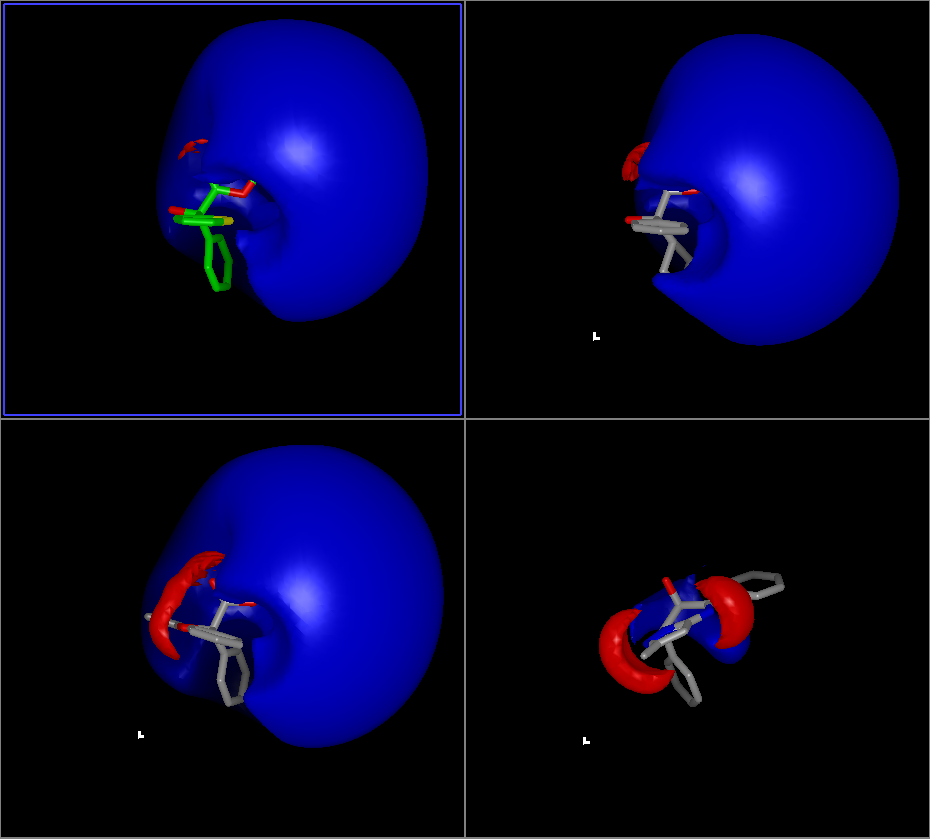
The first view is the FRED View, the results of which can be seen in Figure: FRED Results View. This view sets up the protein’s active site (the region around the reference ligand) with a cropped electrostatic surface and the nearby molecular structure. Optionally, it will also display the protein’s associated ribbon. Finally, it labels the c-alpha carbons on the protein with residue information.
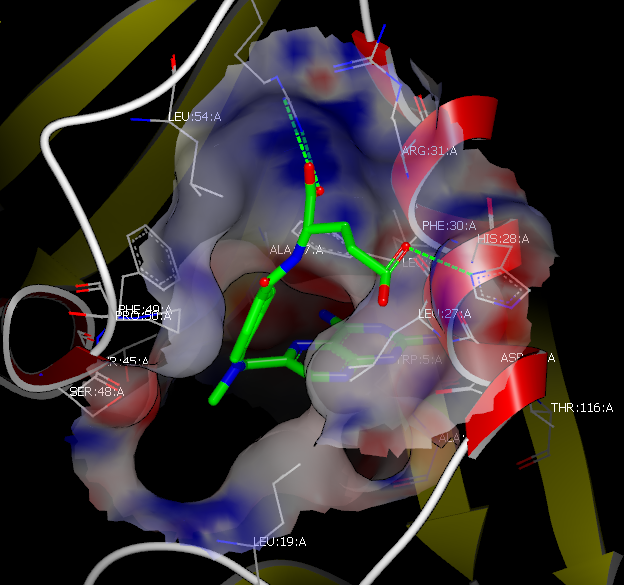
FRED Results View
The FRED View then places the reference ligand in the active site and colors the carbons using the “Reference Color” (the default is green). Finally, it loads the optional results and makes the first molecule in that list the Focused molecule.
The FRED View has several optional parameters, as shown in Table: Custom View Inputs. Hydrogen bonds, protein ribbons, residue labels, and the protein surface can all be toggled using the checkboxes at the bottom of the dialog. Furthermore, there are additional preferences with respect to the distance cutoffs used that can be found in the application preferences.
The FRED View also adds a custom pane to the Style Control to enable more specific interactions with the scene generated by FRED View (see Figure: FRED Pane).
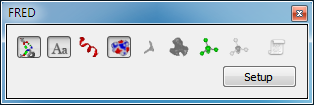
FRED Pane
The custom pane contains a row of nine buttons above a “Setup” button which relaunches the original FRED View dialog (see Table: Custom View Inputs). The first eight buttons toggle the display of hydrogen bonds to the protein, residue labels, ribbons, active site surface, the FRED inner docking contour, the FRED outer docking contour, the reference ligand, and any other extra molecules that might be associated with the protein such as waters or co-factors. The last button toggles the display of FRED docking constraints (if any) and furthermore contains a drop down menu with a list of all the individual constraints.
Note
Receptors in OEDesignUnit entries are not compatible with FRED View at this time
EON View
The EON View has two molecule pickers, one for the result set, and one for the optional reference molecule (see Table: Custom View Inputs. Below these are the parameters to the EON View. The first checkbox specifies whether or not to use the first result as the reference molecule or not. The second checkbox is the Tiled display option, which sets the application into Tiled mode with the various results displayed in their own individual panes. Next to this checkbox is a numeric entry box to set the max number of tiles in the display. The third check box toggles whether or not to load the spreadsheet display as well. Finally, the last checkbox toggles whether to display the Style Control. This ensures that the EON pane in the Style Control is visible, allowing scrolling through the results with that pane’s slider.
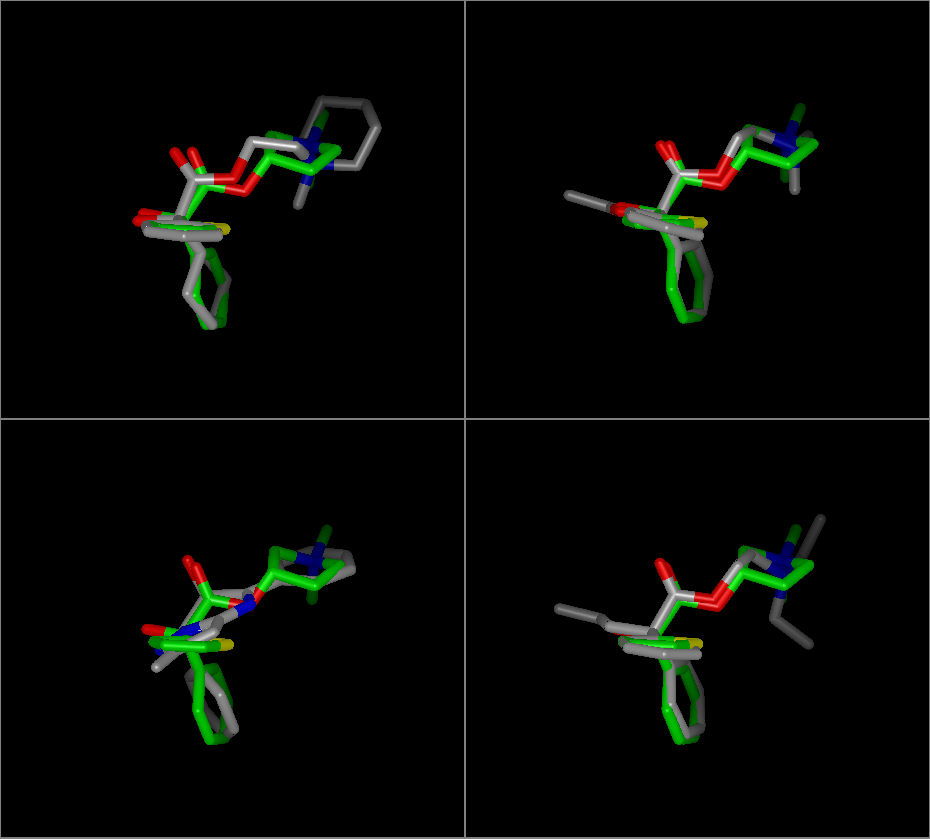
The EON View places the reference molecule in the first tile and colors that molecule using the “Reference Color” (the default is green). The other molecules are displayed in their own tiles. If the molecules contain electrostatic Tanimoto (ET) grids (produced by EON with the -writegrid option), each molecule will have these grid contours displayed for comparison with the reference. An example of this can be seen in Figure: EON Results View.
EON Results View
As mentioned previously, the EON View adds a custom pane to the Style Control to enable more specific interactions with the scene generated by EON View (see Figure: EON Pane).
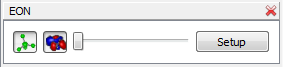
EON Pane
The custom pane contains a row of two buttons and a slider followed by a “Setup” button which relaunches the original EON View dialog (see Table: Custom View Inputs). The first button toggles the display of the reference molecule. The second button toggles the display of any ET grids that were attached to the molecules by EON. The slider allows scrolling through the results.
ROCS View
The last custom view is the ROCS View. This view, like the EON View, has two molecule pickers, one for results and one for a reference molecule (see Table: Custom View Inputs). It also has all of the same options as the EON view.
The ROCS view colors the reference molecule using the “Reference Color” (the default is green) as well as making that molecule Locked. The rest of the results are either overlaid in that same pane or displayed in their own individual pane overlaid on just the reference depending on whether or not Tiled mode was specified. An example of this can be seen in Table: Custom View Inputs.
ROCS Results View
As mentioned previously, the ROCS View adds a custom pane to the Style Control to enable more specific interactions with the scene generated by ROCS View (see Figure: ROCS Pane).
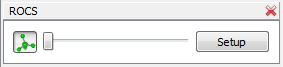
ROCS Pane
The custom pane contains a toggle button, a slider, and a “Setup” button which relaunches the original ROCS View dialog (see Table: Custom View Inputs). The toggle button toggles the display of the reference molecule. The slider allows scrolling through the results.