Overview
The BROOD product contains four applications as well as a script that can be run in conjunction with OpenEye’s molecular visualizer VIDA. Two of the programs, vBROOD and BROOD, and the VIDA script provide the ability to generate queries, search for similar fragments and visualize and triage the resulting analogs. The additional pair of applications, CHOMP and BroodDBMerge, are utilities that generate and merge BROOD fragment databases, respectively.
In these tutorials, we will primarily focus on generating and exploring analogs of an input molecule or molecules.
The basic workflow for BROOD is:
Build a query fragment from an input molecule.
Search for database fragments that are similar to the query fragment.
Examine the analog molecules built from putting the similar fragments into the initial molecule.
Human Complement C3a Receptor Example
This example follows some of the work on Human Complement C3a Receptor (C3aR) from Reid and coworkers [Reid-2014]. C3aR is a G-protein coupled receptor important for human inflammatory processes and has been identified as a potential drug target for several inflammatory diseases. In their work, Reid replaced a bridging ether with a heterocycle to convert a known antagonist compound into a potent and selective agonist for Human C3aR. In this example, we will design analogs to the known compound. The results will include several compounds studied by Reid.
Specifying the Database
Open vBROOD by double-clicking the icon or typing vBROOD at a command prompt. The GUI will start, displaying the information screen and the five primary task buttons (Build and Run, Build a new query, Run BROOD, Filtering, and View Results).
The first time you open vBROOD, you need to specify a default database. If you have not already done so, download the default database or build your own database and specify it.
For this example, be sure to specify the default BROOD database.
If you do not have the BROOD database available locally, you need to download it from the OpenEye Download Page (select your platform and then the product BROOD).
For help with installing a BROOD database, see Database Installation.
To specify a database, select Edit Preferences under the Edit menu and type the name of the database you want to use in the first line of the pop-up preferences dialog. Alternatively, click the Browse button to navigate to the database.
If you have previously specified the database, you will not need to do this again unless you want to change the database.
Note
The BROOD database is a directory. After the default BROOD database has been downloaded, you need to unpack it and select the new directory. We do not recommend renaming the BROOD database, since you must then rename all the files contained within it. Consistency is required to prevent confusion between the name of the database and the files being searched under that name.
Loading a Molecule
Of the five primary tasks, the one most commonly used is Build and Run. This brings you to a five-step GUI wizard that takes you through building and editing a query, selecting an optional property filter, selecting parameters for the BROOD search, and visualizing the results.
Begin by clicking the Build and Run button, which launches the Load Molecule interface.
Load the molecule
c3a-4.sdfby clicking on the small folder icon in the molecule entry space, then navigate to the BROOD directory of the OpenEye-applications data installation and load the filec3a-4.sdf.On the right, the c3a compound 4 is displayed in a 2D image and is highlighted to suggest several fragments for possible replacement.
On the left, the current molecular property table is now filled to reflect the properties of the molecule. These calculated properties can be used as a guide to consider some of the things that might need to be changed in the loaded molecule.
Note
The c3a compound 4 has appropriate aqueous formal charges. BROOD retains the state of the molecule as it is in the input file, so your query molecule must be in the charge and tautomer state you desire before loading it into BROOD.
Multiple fragments can be selected by shift-clicking. In this case, though, we will simply lasso the fragment we want to select. Hold down the Left button on your mouse and circle the fragment of the molecule shown in the image below. The lassoed fragment will then be highlighted (Figure 1).
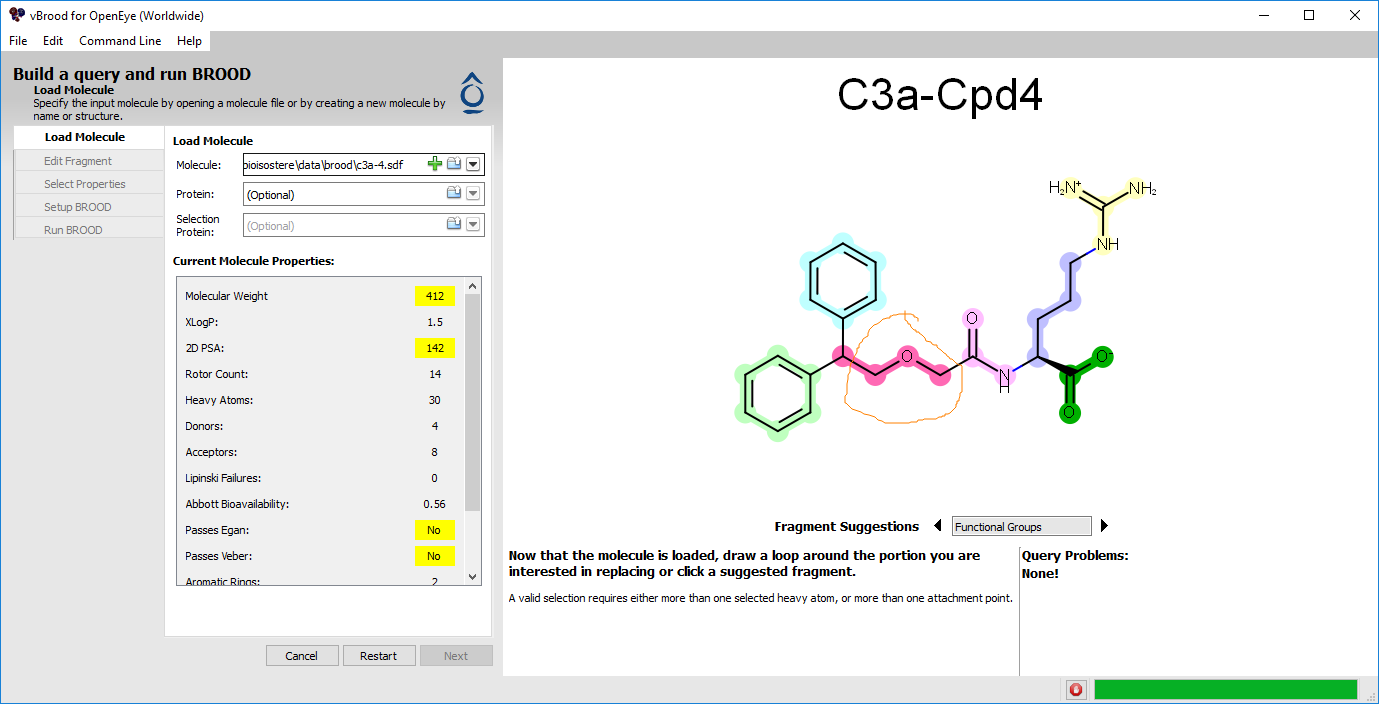
Figure 1. Selecting a query fragment.
Note
When BROOD is run, the selected fragment will be replaced by fragments from the database with similar shape and chemistry.
After the fragment is selected, click the Next button to move on to query editing.
Note
In general, if the molecule you loaded in this step has 3D coordinates, BROOD will use them and will replace the fragment in place. This allows fragment replacement to work in an active site. If the loaded molecule has only 2D coordinates, then a single low-energy conformer will be generated for the ligand using the OMEGA algorithm.
Editing the Query
As the wizard moves to the second stage, the fragment is extracted from the whole molecule and is displayed along with the color atoms generated from the input structure. This interface is designed to help users inspect and edit either the shape or color (i.e., chemistry) atoms of the query. Initially, the three heavy-atom, two attachment-point query will appear annotated with an acceptor color atom. In this example, Reid and coworkers discovered that this acceptor moiety is extremely important. Emphasis to the color force field at this point will be added as well as a constraint.
Note
For additional information about the theory of shape and color force fields, please see the Shape TK or ROCS Application theory sections.
The toolbar with query editing tools is located on the left-hand side of the 3D window. Hovering over each icon gives a brief description.
The first step is to increase the score for replacement fragments that match the constraint.
Select the Color Editing tool (second icon).
Click on the small arrow next to the icon and choose Add Acceptor. This prepares the Selection tool for adding color atoms.
Click on the current acceptor atom, thus adding a second color atom. The annotation on the 3D window should now read “acceptor x2” to reflect the change. This means that the color potential is doubly weighted in this position.
Second, a constraint must be added that requires all analogs identified by BROOD to include an acceptor near this position.
Select the Constraint tool (third icon).
Click on the small arrow next to the icon and choose Add Acceptor Constraint. This prepares the Selection tool to add a constraint.
Now click on the same acceptor atom we chose above. A dashed circle will appear around the atom, annotating the newly added constraint. The query should now look similar to Figure 2 below.
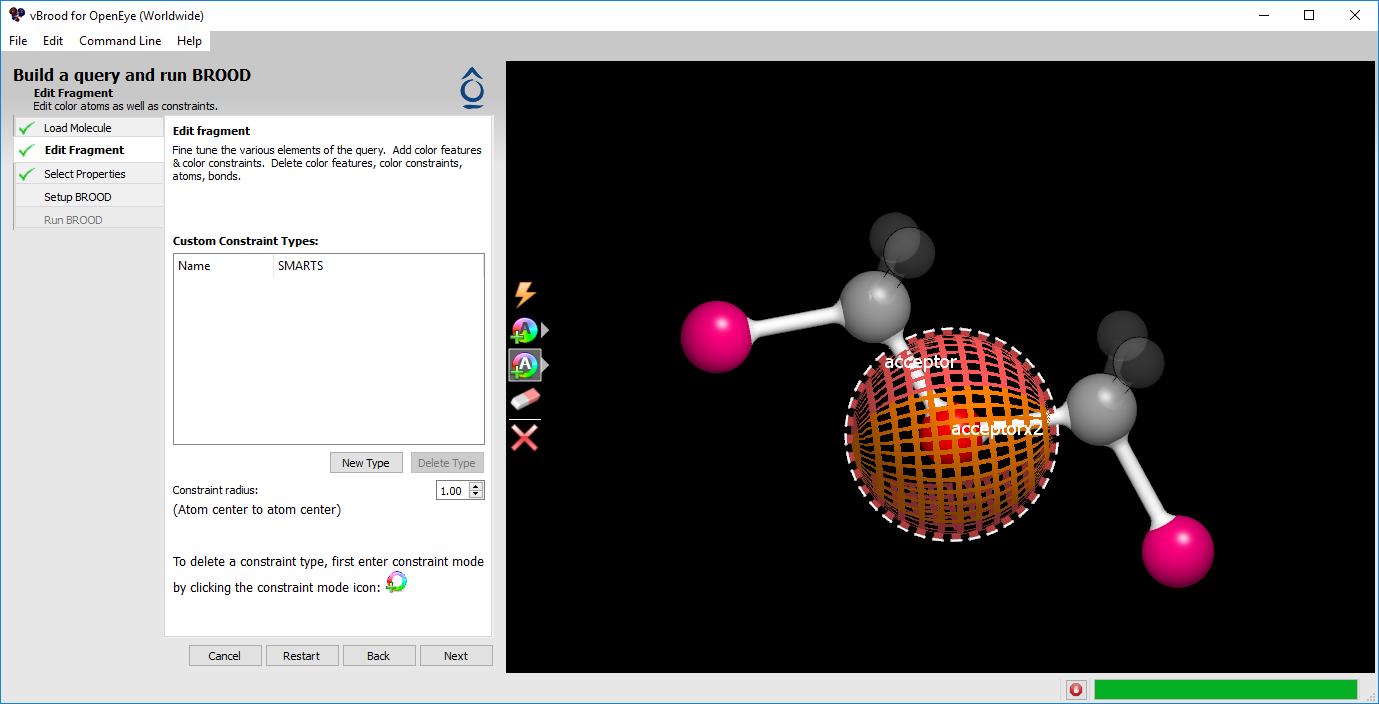
Figure 2. Color and constraint on a query fragment.
Third, click Next to move to the next step in the wizard.
Selecting Properties
This interface allows BROOD to filter the output by the properties of constructed molecules with replacement fragments. For example, BROOD filters by simple rule-of-five, predicted bioavailability, and complexity. Any constructed molecules that fail to meet these property filters will not appear in the output. In all cases, the property filters consider the properties of the whole molecule (rather than only the fragment).
For this example, we will leave property filtering turned off. Click Next to move to the Setup stage in the wizard.
Note
There is a button for saving the query at this stage. In all cases, a copy of the query is written into the working directory when BROOD is run. This button is for saving another copy of the query or for saving a query when you don’t want to follow through and set up a BROOD run. Saving at this point is for convenience only and not necessary.
Using the Property Filter (Optional)
At some point, you may want to use the property filter.
While still on the Selecting Properties step, check the Property Filter checkbox.
Choose a default Drug-like filter or a filter that was built earlier.
Setting Up the BROOD Search
The Set Up BROOD step has many options. Hovering over the options will reveal tooltips describing them. For this tutorial:
Select an Output Prefix. All output files will have this text pre-appended to their filenames. If the prefix has been used previously in the same directory, BROOD will automatically increment a trailing integer. If there is a danger of overwriting the previous output, the prefix will appear in red text.
Select an Output Directory. All output files will be written to this directory.
If you are running on a machine with more than two processors, click the multiprocessor box and set the number of processors.
Note
In general, BROOD’s speed scales by N-1, where N is the number of processors.
You should also verify that:
The database you selected earlier in this tutorial appears in the Database setting.
Shape & Color is selected under Search Options. This is the default, but if you changed it in a previous run, the GUI will remember that value.
Any Size Ring is selected under Ring Requirements. This is the default, but if you changed it in a previous run, the GUI will remember that value. Setting the option to Any Size Ring requires that all substituted fragments have at least two ring atoms on the shortest path between the attachment points, thus providing a conformationally constrained replacement fragment.
The annotated query fragment in the 3D window is the query you intend.
Click Run to start the search.
Opening and Viewing Results
As BROOD searches, the GUI writes log information to the window’s lower portion and continuously updates the status information in the upper left. The lower right corner of the GUI displays a graphical progress bar. The search in this tutorial takes a few minutes to complete and results in 60 analog molecules in three clusters. At intermediate intervals, the current hit list of identified fragments is displayed in vBROOD’s 2D depiction area. A discrete progress bar in the lower right of the GUI also shows the progress. When the job is complete, the bottom half of the screen displays results in a spreadsheet while the upper-right portion gives a preliminary view of the 2D analogs (Figure 3 below).
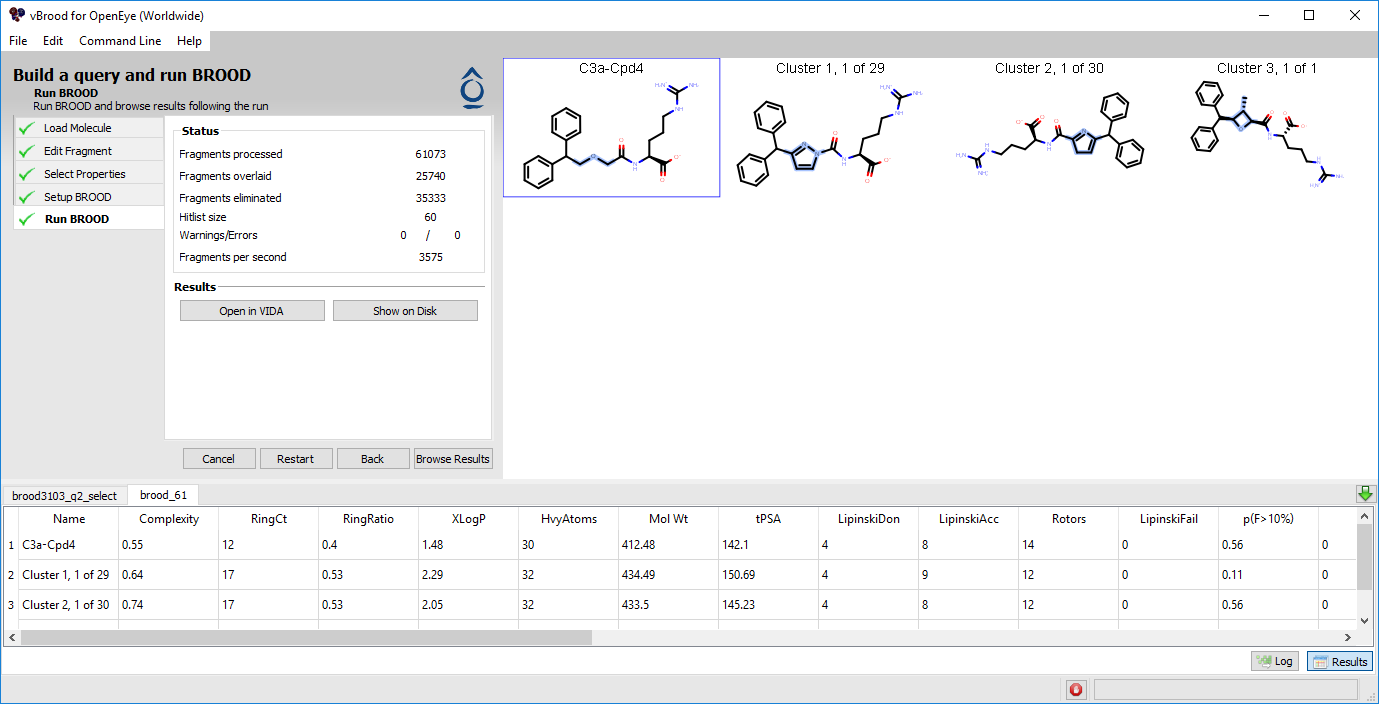
Figure 3. Search results.
Once the run is complete, vBROOD automatically passes the search results to VIDA with a script that allows convenient viewing of the BROOD results. This VIDA interface is simplified and specialized for viewing BROOD results.
Click Open in VIDA for further exploration and triage of the results.
Exploring the Results
BROOD results are organized into clusters; the interface is designed to help users explore these clusters. Along the way, you can identify analog molecules of particular interest and save them to a Favorites list that can be saved as a separate hit list. This portion of the tutorial explains how to navigate through the clusters, add molecules to your Favorites list, and save the Favorites list as a new molecule file.
Keyboard Shortcuts for Navigating BROOD Results
When you first open the BROOD Results Viewer, the keyboard shortcuts are immediately displayed (Figure 4). For this tutorial, we will use the Left, Right, Up, and Down Arrow keys as well as the Q, F, and Delete keys.
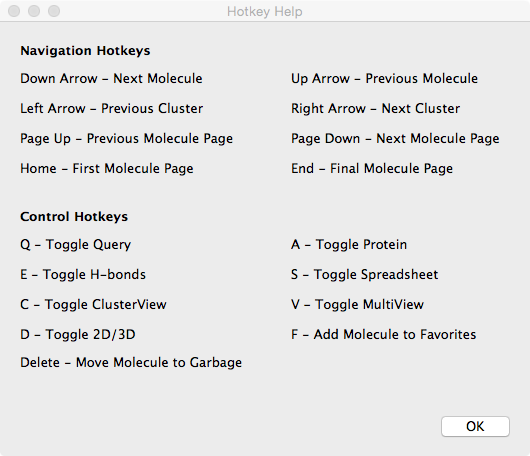
Figure 4. Keyboard shortcuts.
Dismiss the keyboard shortcuts window. It can be redisplayed by clicking the Hotkey Help button on the left.
If this is your first time using the BROOD Results Viewer, you will see the results of the search in four 3D panes as well as a navigation and information pane on the left. The upper-left 3D Viewer pane always contains the query molecule with the replaced fragment highlighted in green and the constant part shaded in deep maroon.
The remaining panes each contain a cluster head of the three clusters identified in this query. By default, the new analog molecules are overlaid with a wireframe version of the query.
Rotate and zoom the panes to examine some of the analogs. The panes will automatically be centered on the replaced fragment.
Use the Q hotkey to toggle the wireframe query overlay on and off.
BROOD Results in the Results Viewer
The results of a BROOD search are automatically organized into clusters based on the similarity of their molecular framework. Particular attention is given to rings and aromaticity while different chemistries are allowed to be grouped. The Arrow keys can be used to explore the results for this search. Clusters found by BROOD are not hierarchical; instead, they are a series of collections, each represented by the compound from the cluster that receives the best BROOD score (Figure 5).
A look at the information pane of the BROOD Results Viewer shows the total number of clusters (three in the case of this tutorial). In addition, two tumblers identify the molecules that are currently visible. The left tumbler represents the cluster being viewed. When the blue highlight is on the left tumbler, the 3D panes are showing the cluster representatives. The Up and Down Arrow keys toggle through the cluster heads, with the selected cluster head highlighted in blue; and the matching blue square around the selected cluster representative in the 3D window will also change. If there are more than three clusters, the Up and Down Arrow keys will also handle scrolling through the all the cluster representatives.
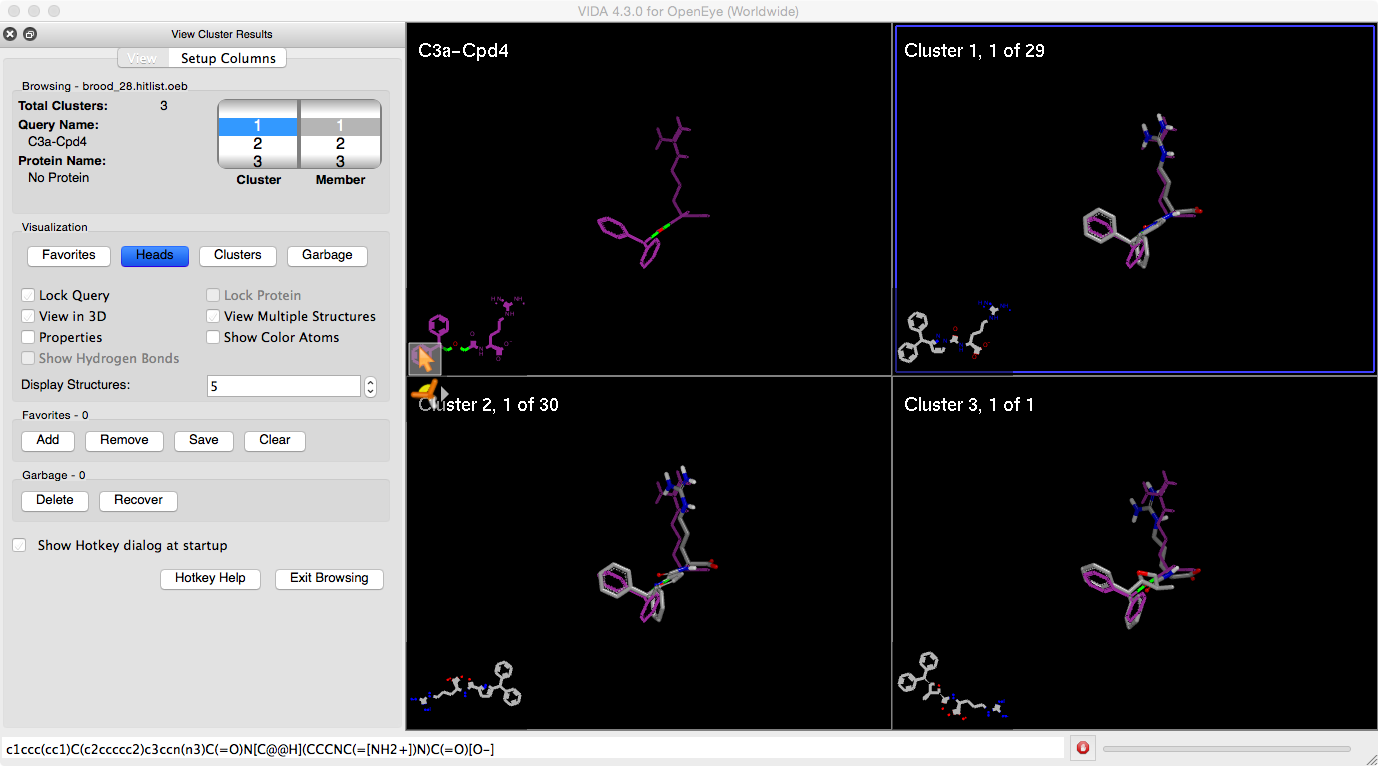
Figure 5. Exploring clusters in the BROOD results.
Click the Down Arrow key. Note that the left tumbler changes from highlighting “1” to highlighting “2” and that the blue highlight box in the 3D window moves from highlighting the first cluster representative to highlighting the second representative. If you want to see all the members of a cluster, you can drill down into a cluster to see all of its members. In this section, we will explore navigation through Cluster 2 using the Arrow keys.
Use the Up and Down Arrows to select the representative molecule of Cluster 2. Note that it is labeled with “Cluster 2, 1 of 30,” indicating that it is the first molecule in a cluster with 30 total members.
Press the Right Arrow key to expand Cluster 2. Notice that in the top-left pane, the blue highlight has moved onto the right tumbler, indicating that you are now viewing cluster members. It is highlighting “1,” indicating that the highlighted molecule in the 3D window (the one surrounded by the blue box) is the first molecule in the cluster.
Use the Up and Down Arrows to move through the cluster members. By default, six panes will be visible and the Arrow keys will cause the molecules to scroll through the panes one by one. Look through some of the molecules in Cluster 2 using the Arrow keys. To toggle the number of molecules displayed, use the V hotkey.
Note
The Page Up and Page Down keys can be used for more efficient navigation. If multiple panes are visible, Page Up and Page Down will change all the visible molecules at one time. This navigation is analogous to the Up and Down Arrow keys, but more efficient.
Use the Page Up and Page Down keys to move through the cluster members.
The Home and End keys will navigate to the first page or the last page of the cluster of molecules you are currently examining. Use the Home and End keys to navigate to the beginning and end of Cluster 2.
The Up Arrow, Down Arrow, Page Up, Page Down, Home, and End keys are all available for navigation throughout all the cluster representatives in the same way they were for navigating the molecules inside Cluster 2.
Working with Favorites in the BROOD Results Viewer
When examining BROOD hit lists, some users like to select particular molecules for future sharing or examination by saving them into a separate culled list. To facilitate this, the BROOD Results Viewer includes Favorites and Trash features. While navigating the analogs as discussed in the previous section, you can choose any molecule and move it to your Favorites. In addition, if you identify molecules you would prefer not to examine again, you can move them to the Trash. Both the Favorites and the Trash can be opened if you inadvertently placed a molecule in the wrong category.
Using the navigation skills developed previously, choose a molecule in Cluster 2. To save it to your Favorites list, first select it by navigating until the blue box is highlighting the molecule (this can also be done by clicking on the molecule). Once highlighted, you can add it to your Favorites list either by using the F hotkey or by clicking the Add button under the Favorites menu. Select several more molecules and add them to your Favorites list.
To examine your current Favorites list, click the Favorites button in the navigation pane. The 3D window will then display the molecules you’ve added to your Favorites list. Navigate to your least favorite molecule in the Favorites list and press the Remove button. This action removes the molecule from the Favorites list and puts it back into its original position in the Results cluster.
When your list of favorite molecules is complete, you can save it to share with colleagues or for later examination. Click the Save button under the Favorites pane and a File-Save dialog will open. The default file format will be OpenEye Binary, although a variety of other file formats are also available. The query molecule will be saved in your Favorites list. If you have any proteins, color annotations, or property annotations, they will also be saved in your hit list. The data saved in your hit list is only limited by the file format you select. While OEB is preferred, SDF can also save much of the information.
In addition to keeping track of your favorite analogs, it can also be useful to get rid of some of the less desirable molecules. For this purpose, there is a garbage can that allows you to place molecules in the Trash.
Using the navigation skills developed previously in this tutorial, navigate to a molecule in Cluster 1 that is not useful. When the blue highlight box is around the molecule, hit the Delete key. The molecule will be removed from the list and the remaining molecules will be renumbered. For example, if you highlight and delete cluster member 15 (labeled “15 of 54”), it will be moved to the Trash and the molecules formerly labeled “16 of 54” to “54 of 54”, will now be relabeled “15 of 53” through “53 of 53”.
If you inadvertently put a desirable molecule in the Trash, you can open the trash can using the Trash button in the Visualization pane of the Results Viewer. When you click this button, the 3D view will change to display the molecules in the trash. These molecules can be navigated as described above, and can be returned to their original place in BROOD’s Results clusters by highlighting them and then clicking the Recover button under the Trash pane on the left panel.
Fragment Joining Tutorial
In the fragment-based design setting, users may occasionally want to link two fragments with crystal orientations in the active site into a single molecule. Ideally, when the two fragments are linked without additional entropy, the binding energies can simply be added. In practice, this kind of additivity is often not possible for a number of reasons, including ligand strain, protein strain, entropy, and desolvation. Nevertheless, BROOD can be quite useful in this setting to suggest potential linker groups that might span the fragment–fragment gap in a low energy manner. This tutorial walks you through the steps for identifying linker fragments.
This tutorial follows the work of Ward et al. [Ward-2012], in which they designed linkers to join two crystallographic fragments to generate a lead.
BROOD Database
If you have not yet installed the BROOD database, please see the Database Installation section for further information before continuing this tutorial.
Loading Two Molecules
For this exercise, we will take two fragments positioned in the same active site and join them with an unstrained linker.
Open vBROOD and select Build and Run from the primary window.
Click on the small down arrow in the Molecule input box.
From the pop-up menu, choose Open Fragments for Bridging. This will open a two file dialog.
Choose two separate fragment files using the appropriate function for your operating system. For this tutorial, select the files
ward-22-21.oebandward-21-22.oebfrom thebrooddirectory in Example and Tutorial Data.
When the files are properly loaded, the 2D window should display them as shown in Figure 6 below.
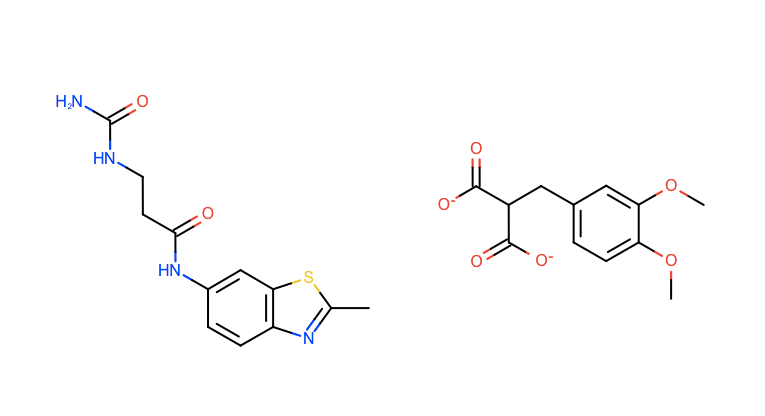
Figure 6. Two molecules loaded for query selection.
Loading the Protein
In any BROOD run, whether fragment replacement or fragment joining, a protein context can be added. When the query molecule or molecules are from a protein active site and the protein is passed to BROOD, the new analogs will be constructed in the context of the protein active site. Before the final hit list is generated, all the new analogs will be tested for clashes against the protein.
After the two fragments are loaded, locate the Protein input box.
Click the folder icon to open an input dialog.
Select the file
ward-protein-join.oedu. This will allow you to include the protein in the search and build joined fragment molecules in the active site of the protein.
Choosing a Query
When the two files are loaded, depictions of two separate molecules will appear in the 2D query window. As with a single query, the fragments for replacement can be lassoed, one from each molecule in this case (Figure 7).
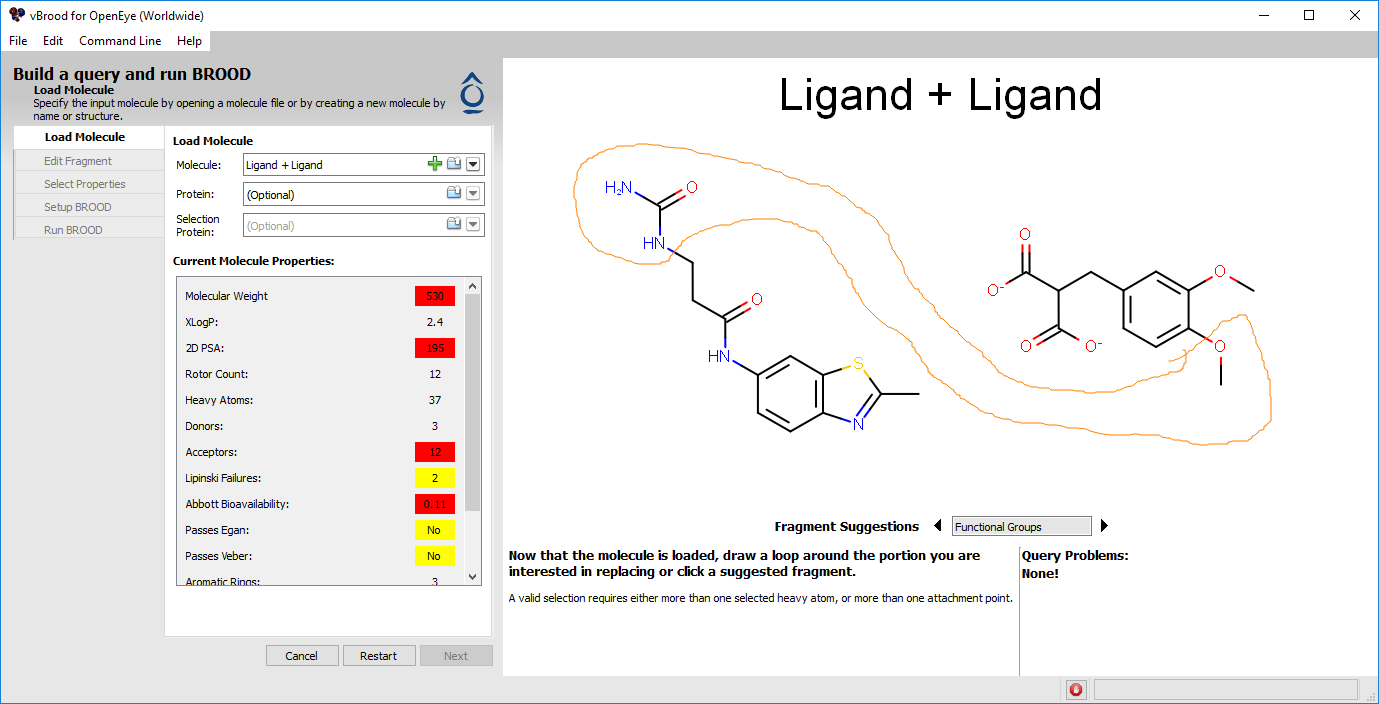
Figure 7. Choosing a query to join two molecules.
Use your mouse to lasso the parahydroxyl and the terminal urea in a single circle. It doesn’t matter that the fragments are not close to each other.
Click Next to move to the 3D window.
Since you loaded a protein in the previous query selection stage, there is now a Show Protein button beneath the window that allows you to toggle the visibility of the protein on and off. Try this now. Having no visible protein makes it much easier to work with the query fragments. On the other hand, being able to see the protein and how the current ligands interact with it can be quite helpful in designing a query. For this exercise, turn off protein visibility.
Select the Eraser icon and delete all the color atoms by clicking them. This will allow BROOD to bridge the two fragments independent of the influence of the terminal urea chemistry.
Now delete all the heavy atoms except for the pink attachment atoms and the oxygen and nitrogen atoms bonded to the attachment atoms. This will allow BROOD to bridge the two fragments independent of the influence of the shape of the terminal urea. In the end, you will have a minimal query required BROOD to carry out an unguided search (Figure 8).
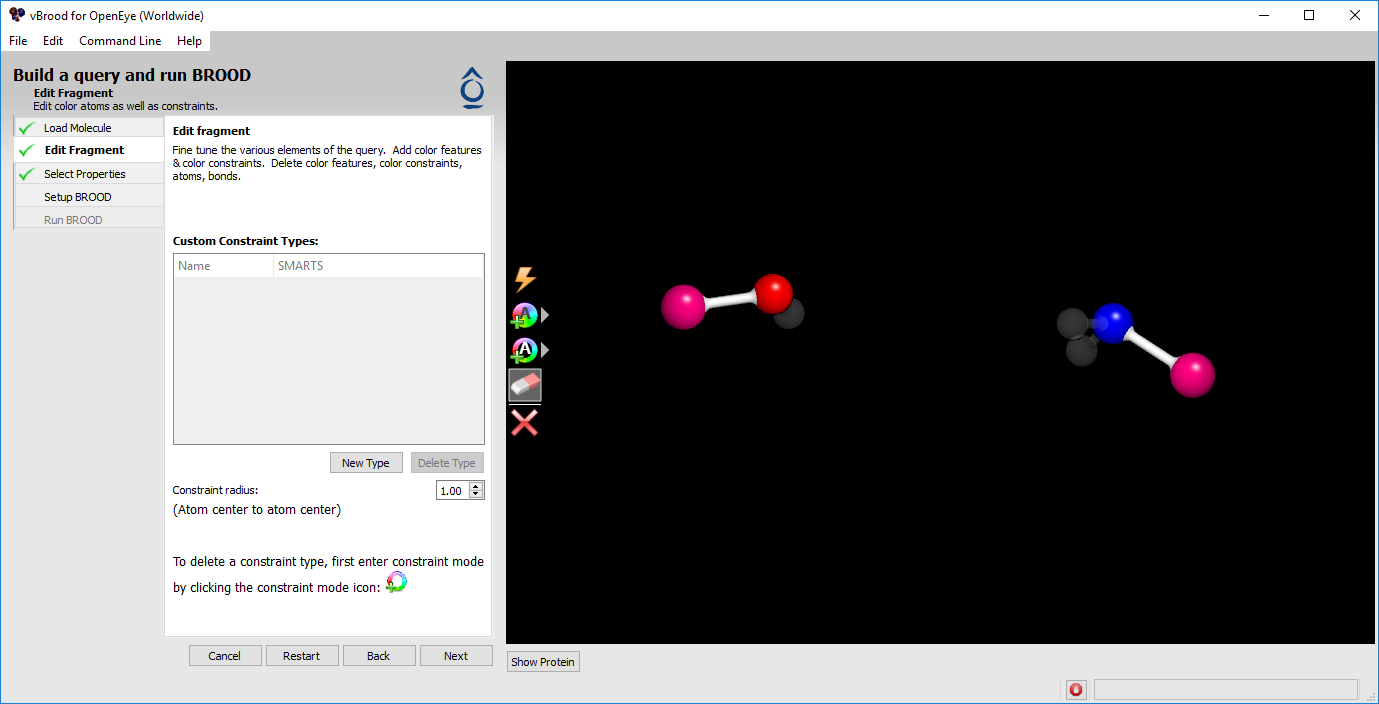
Figure 8. Minimal query for molecule joining.
Setting up a Search
Click Next to move to the filter pane, then click Next again to move to the BROOD Run Setup window.
If you have a multiprocessor machine, click the Multiprocessor check box under General Options and select the maximum number of processors.
Note
BROOD can use from 1 to N+1 processors, where N is the number of logical cores detected on the machine. On many desktop systems, the OS remains responsive even with all the processors engaged by BROOD. Users should explore performance on their own systems.
Under Search Options, select the Link Geometry search type. This will carry out a CAVEAT-like search [Lauri-1994] that attempts to span the empty region between the two fragments.
Try this example with the Quick Search option (see below). Later you can also run without the Quick Search option to compare the calculation time and quality of results.
Next, consider ring selection in the search. By default, BROOD requires a ring in the atom path connecting every two attachment hit. For this exercise, under the Ring Requirements section, select the “Zero Rings” option. This will require that fewer than two ring atoms are located on the shortest atom-path connecting the fragments in each BROOD hit.
Finally, when a protein is included in a search (as in this case), all solutions are checked for bumps with the protein using a 2.25 Å cutoff by default. For this example, adjust the cutoff to 1.7 Å. To do this, click the Advanced Search tab and adjust the number labeled “Protein-ligand bump radius” to 1.7.
Now click Run. The view will switch to the Results Tracking view while the job is running. When the run is complete, the results will be viewable in the vBROOD GUI and in the BROOD Results Viewer. Navigation and exploration of those results work similarly to those in the first tutorial. If you are not familiar with results navigation, it may be useful to review the first tutorial. Here, special attention will be paid to features that are different in this tutorial.
Examining the Log Files
When the BROOD run is complete, click the Log button on the lower right of the vBROOD Results window. You can read the logging information to learn details about the number of molecules that were processed, how many were overlaid, how large the initial hit list was, and the reason that any molecules were eliminated from the hit list.
When running a standard search, the Results page shows every fragment that was overlaid and the hit list of those that passed all requirements. For this example, about 45,000 fragments were overlaid and a hit list of 300 was retained.
Note
The Quick Search function’s goal is to complete its search in approximately two minutes. To accomplish this, the hit list is truncated up to the first 50 cluster representatives. Further, each cluster is represented only by its best scoring molecule. The Quick Search results are often interesting and contain a few attractive ideas. Quick Search allows users to assess whether a more time-consuming search is likely to be fruitful.
Viewing Results in a Protein Site
Now examine the results in 3D by clicking the Open in VIDA button. As in the previous example, this opens the BROOD Results Viewing script and automatically loads the results with the modified interface. As before, the results are organized by cluster and displayed in the context of the query. When you examine the Quick Search results, each cluster will have at most one member, so navigation is simple.
Because we loaded a protein as part of the query, the protein structure is also available in the Results Viewer. Using the A hotkey or the Lock Protein check box in the visualization panel, the protein display can be turned on and off. When the protein is turned on, the protein residues near the query molecule are displayed.
When the protein is visible, hydrogen bonds between the protein and the ligand annotations can be added and removed using the E hotkey or the Show Hydrogen Bonds check box. This works best if the query is not locked (use the Q hotkey or the Lock Query check box).
When the protein is visible, a partial surface covering the area of the active site can be turned on and off using the R hotkey. The surface is colored with the electrostatic potential (Figure 9).
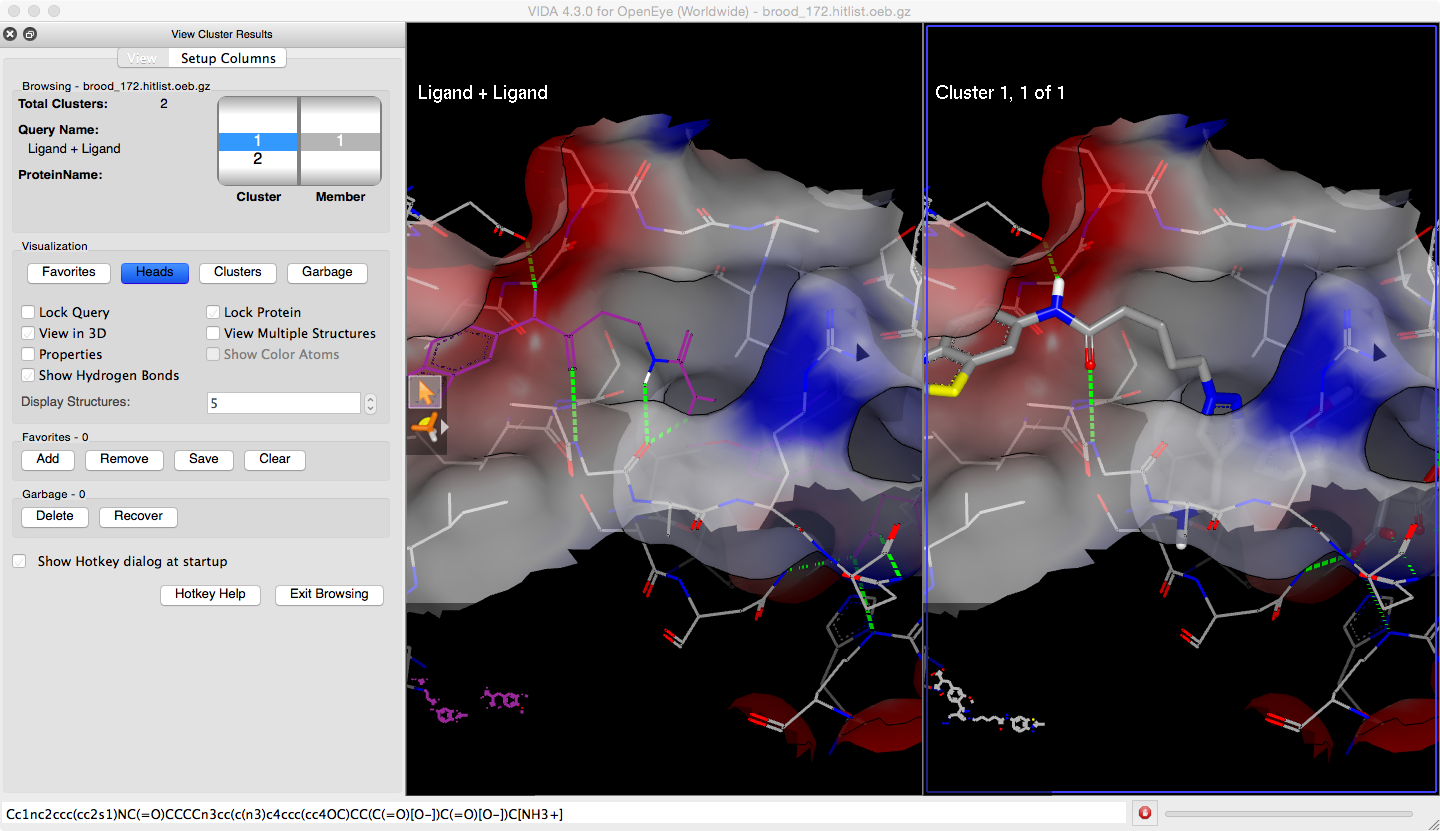
Figure 9. BROOD results in an active site with surface and interactions.
The other features of the Results Viewer can be reviewed in the first tutorial.
Generating a Database with Crystallographic Conformations
This example demonstrates how users can create a BROOD database with fragment conformations pulled from small molecule crystal structures rather than conformations generated by OMEGA. For this task, we will be using CHOMP, BROOD’s application for fragment database generation.
Preparing Data Sources
For this exercise, CHOMP requires two molecular inputs. The first input will be the molecules you want CHOMP to use to generate molecular fragments for the BROOD database. The second input will be the 3D molecular structures CHOMP should use to extract example conformers for the fragments generated from the first input. The same file can be used for both inputs; for instance, if your company has a large collection of small molecule crystal structures, you can use it to both generate the molecular fragments for the BROOD database and to define the allowable conformations of those fragments.
The molecular file for fragmentation can be in any supported 1D, 2D, or 3D molecular file format (including SMILES or 2D SDF). If the molecules include titles, these can be used in the BROOD Results to track the most common sources of each fragment.
The molecular file for crystal conformer specification must be a 3D structure file. We recommend using SDF, MOL2, or OEB. These formats can be exported from common crystallographic database tools (refer to their manuals for details of the process). In our experience, the PDB format has too many ambiguities for reliable handling of 3D fragment conformations; we recommend avoiding the use of PDB files here if possible.
For this tutorial, example files have been included in the BROOD installation. For the first input, you will use the file biotin.ism; for the second input, you will use the structural file biotin.xtal.oeb.
Note
Using the same input for fragment generation and conformer specification assures that there will be a crystallographic conformation for every fragment generated by CHOMP. If different files are used, then fragments may be produced that have no representative conformation in the structural data.
Generating a Database
CHOMP generates BROOD databases in two phases. In the first phase, a unique set of fragments is extracted from the molecular input. In the second phase, conformers are generated for each fragment, the fragments are organized to optimize BROOD search times, and then the fragments are written into a database. For this exercise, each fragment from the first phase will be searched for in the 3D molecules. If the fragment is identified as a substructure of any 3D molecule, the coordinates will be extracted and added as a new fragment conformer. Finally, duplicate conformers of each fragment will be removed before the fragment and its 3D conformations are passed on for organization and database writing.
Note
CHOMP is a command line only program. It is part of the BROOD product and is installed as part of the BROOD installation process. CHOMP is not available from within the BROOD GUI in this release but is available in form on all supported platforms.
Click on the command line menu and select CHOMP from the drop-down menu.
At the prompt, type and execute the command line
chomp --help all.This should generate a list of all the command line parameters and will test whether CHOMP is available in your path.
Please check the first few lines generated and make sure you are running the current version of CHOMP.
Change directory to the
brooddirectory under the Example and Tutorial Data of your installation. It should contain the filesbiotin.ismandbiotin.xtal.oeb. You can also copy these files to another directory if you would prefer.
Execute command line:
prompt> chomp -in biotin.ism -out crystal -readconfs biotin.xtal.oeb.The output is a directory named
crystalwith 45 paired files namescrystal.N.idxandcrystal.N.db, where N varies from 0 to 44. It also contains two metadata files,crystal.all.idxandcrystal.info.Because this is a very small database, many of these files are 0 bytes in size. Only segments 0, 1, 2, 3, 4, 5, 6, 8, 9, 10, 11, 12, 15, 16, 17, and 18 are used, and even these files are quite small. Use the appropriate file system listing mechanism on your platform to confirm that these files contain information.
The database is now ready for searching. There are two ways to select it for searching within vBROOD.
To use the newly created database as the default database:
Start vBROOD and select
Edit->Edit Preferences.A preferences dialog will open; the first item will be the database directory.
Either hand edit or use the Browse button to locate and select your newly created database.
To use the newly created database without changing the default:
Start vBROOD and select the Build and Run button.
Open the crystallographic query file
4ggz.oeband select the central aliphatic chain connecting the acid to the ring.Click Next to move to the Edit Fragment tab.
Click Next to move to the Select Properties tab.
Click Next a third time to move to the Setup BROOD tab.
Now, the critical step is in the second entry, labeled Database. Use the Folder icon to select the crystal database you just created with CHOMP. Selecting the database this way will not change your default database in vBROOD.
Finally, change the Ring Requirements parameter to the No Requirements selection and click Run BROOD.
BROOD will quickly execute and return a single result that is nearly identical to the input structure. The inclusion of the unusual torsion in the distal aliphatic chain just before the carboxylate moiety is an indication that the fragment is in fact using crystallographic conformations.
Advanced Topic: Editing the Fragments at an Intermediate Step
There are many fragment generation and fragment filtering parameters that control the number and type of fragments generated from your input molecules by CHOMP. The defaults for these parameters mimic our best practices for the general case. If you are generating a specific database for a special case, you may want to examine the fragments generated by CHOMP to determine in detail if you want to modify the default parameters. This section of the tutorial explains how to make this part of the database preparation workflow.
The following steps will quickly lead you to an intermediate Results file containing all the fragments generated for your database. Since this phase is typically significantly faster than full database generation, you can repeat it, adjusting the parameters until you are satisfied. Alternatively, you can hand edit the intermediate file using your own criteria and then pass it into the final 3D database generation phase when you are satisfied with the results.
Consider the command line used above but without the 3D molecule file with the
-readConfsflag. Without the-readConfsflag, by default, OMEGA conformations will be used. Turn off this option by passing False to the-omegaparameter.
Whenever CHOMP is executed (regardless of 3D options), an intermediate file is generated that contains all the fragments generated from the input molecules. With both of these options for conformations turned off, CHOMP will generate the fragment file and then stop.
In the command line described above, use the output designation crystal with the
-outflag. The intermediate file will be calledcrystal.ism.prompt> chomp -in biotin.ism -omega false -out crystalThe output file
crystal.ismincludes 18 fragments numbered one to 18.
This file contains the output fragments along with a complex molecular title. The title includes information about the source molecules for the fragment and can be disregarded for this exercise.
Load this fragment file into your preferred molecular viewer, noting that it may contain a very large number of fragments. By examining the fragments, you can determine if they fit your preferences.
Rerun the command line, using the flag
-maxHvy8 and change the output to avoid overwriting the previous output (-outcrystal2). Now you can compare the output of thecrystal.ismandcrystal2.ismfiles to see the effects of this parameter change.prompt> chomp -in biotin.ism -omega false -out crystal2 -maxHvy 8Examining the output file
crystal2.ismreveals that only 13 fragments are present: the five that are larger than eight heavy atoms have been removed.
In addition to modifying the Fragment Selection parameters, as with -maxHvy above, the -smarts parameter can have a powerful effect on the fragments that are generated by CHOMP. This can be an effective tool regardless of whether the 3D conformers for your database are being extracted from crystallographic conformations or generated by OMEGA.