2D Display
2D molecular depictions are provided using OpenEye’s OEDepict toolkit. A large number of options are available in the applications preferences to customize how the depictions are drawn.
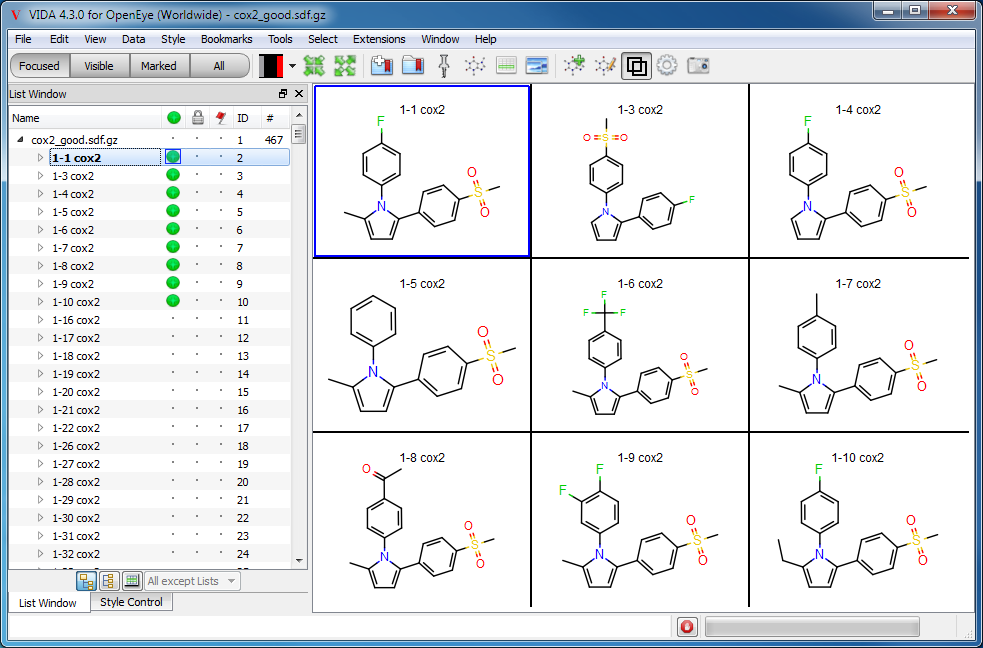
Molecule Depiction
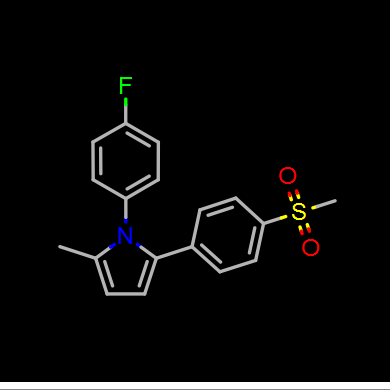
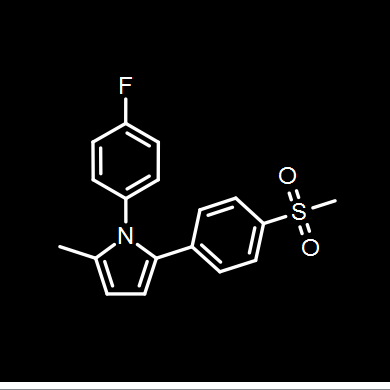
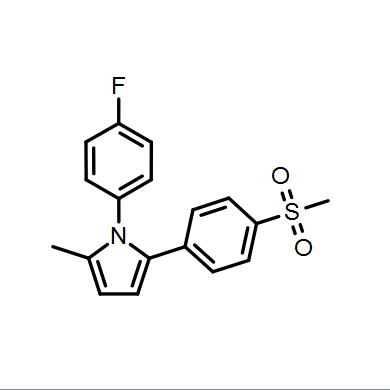
Depictions are drawn in color on a white background by default as seen in Figure: Molecule Depiction, but other color schemes are available and can be seen in Table: Depiction Colors.
|

|
|
|
Color on black |
Color on white |
White on black |
Black on white |
As might be expected, 2D depictions of this nature only make sense for small molecules (< 255 atoms in this case). For proteins, an amino acid sequence view is displayed instead (see Figure: Protein Sequence).
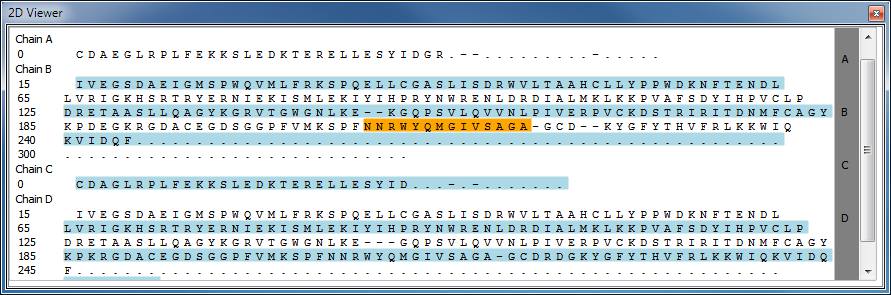
Protein Sequence
Preview vs. Viewer
The 2D display comes in two flavors - the 2D Preview and the 2D Viewer. There are two differences between these two windows. First, the 2D Preview can only show a single molecule – the Focused one – whereas the 2D Viewer can show several in a grid if the application is in Tiled mode. Secondly, the 2D Viewer can be set as the main window, but the 2D Preview cannot. The 2D Viewer is shown in Figure: Molecule Depiction.
The 2D Preview is best suited for use as a small secondary display of the Focused molecule while otherwise browsing. The 2D Viewer often requires more screen real estate and is usually best suited as the main window.
Interaction
2D selection behaves much like selection in the 3D display. Left clicking will select an individual atom, bond, or residue (if in sequence mode). When viewing a depiction, the right mouse button allows lasso style selection, as in the 3D display. When viewing a sequence, holding down the Shift key when selecting will allow selection of a continuous range of residues.
The current selection is reflected in the coloring of the 2D depiction. There may be slight variations between the depicted selection in 2D and 3D due to the difference in how hydrogens are drawn.
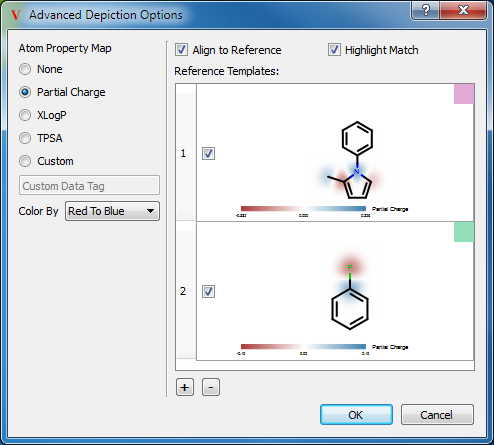
Advanced Depiction Options
Some advanced options for molecular depictions are available in the Advanced Depiction Options dialog (see Figure: Advanced Depiction Options), which can be accessed through the Data menu.
Through this dialog, it is possible to add property maps to depicted molecules in the 2D Viewer and Spreadsheet using the Grapheme toolkit. Additionally, this dialog allows the designation of reference template molecules that can be used to align 2D depictions to a common orientation. The reference templates can also be used to highlight matching substructures in depicted molecules.
Advanced Depiction Options
Atom property map displays are enabled by choosing one of the Atom Property Map options on the left of the dialog. Three of the properties, Partial Charge, XLogP, and TPSA, VIDA will calculate internally. To display property maps for other atom-level properties, select the Custom option and specify a generic data tag to use for property map displays. The atoms must have real-valued generic data on them for the Custom option to work.
Reference molecule templates can be pasted into the dialog or sketched, and multiple templates can be specified. The first template matching a molecule will be used for alignment and highlighting in that molecule’s depictions.
If Align to Reference is checked, molecules in the 2D Viewer and spreadsheet will be aligned to match the orientation of the first matching reference template. If Hightlight Match is checked, the part of the depicted molecule that matches the template will be highlighted using the color shown in the Reference Templates list.
Individual templates can be enabled or disabled using the checkbox next to the molecule in the Reference Templates list. New templates can be added, and selected templates deleted, using the “+” and “-” buttons below the Reference Templates list.