SzmapReport
Overview
The szmap_report utility reads an OEBinary file (.oeb or .oeb.gz)
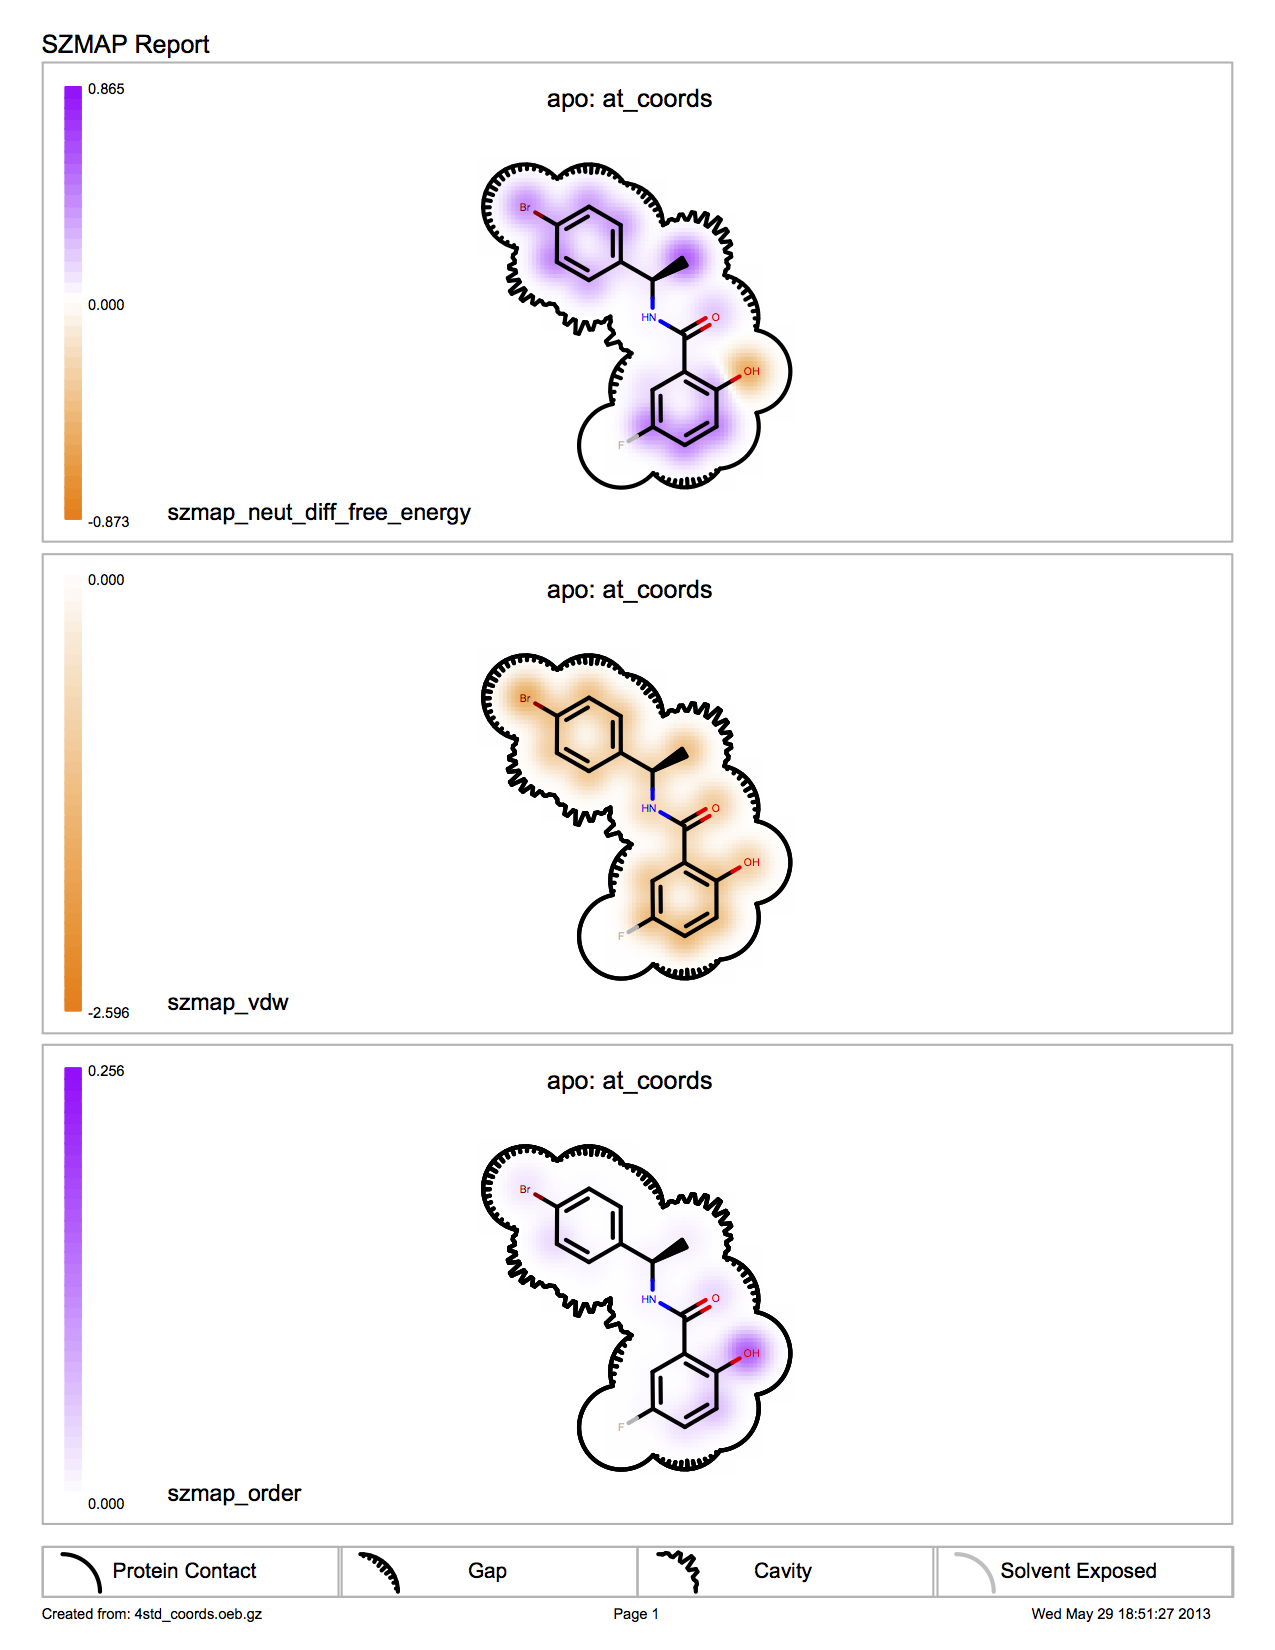
generated by using the -at_coords flag with SZMAP and produces a
.pdf file containing one or more 2-dimensional renderings of the results. The calculated
values for a given property are shown as colored patches around each coordinate position.
(You can also visualize these properties in 3D using Color By Atom Properties).
Atoms at coordinates with no calculated property, because the probe clashed when placed there,
are grayed out.
Note
Versions of SZMAP prior to 1.1.0 attach only a limited number of properties to atoms. To display vdw or order, for example, you may need to rerun calculations with the latest SZMAP version.
If a concatenated series of molecules are used as input to szmap -at_coords, szmap_report
will produce a figure for each molecule. You can control the formatting to either place
the output for each molecule on a separate page, or align the output for different molecules
on the same page.
By default option -surface is true, meaning a 2D surface boundary for
the molecule is shown with different line types depending on how loose or tight the
binding site is around each atom. Boundary styles are: simple black lines for close contacts,
lines with short radial lines indicate a small gap, and outward reaching fingers indicate a cavity,
a place with enough space to place a water or other atoms. Thin gray lines indicate
a solvent exposed region.
If hydrogens are in the output, they are usually suppressed from the display.
If you want to display data calculated at hydrogen positions, use -keep_hydrogens,
but because surfaces are rendered only for heavy atoms, -surface must also set to false.
The output is rendered by OpenEye’s OEDepict and Grapheme toolkits (additional licenses not required). See figure SZMAP report output.

SZMAP report output
Example Commands
prompt> szmap_report 4std_lig_coords.oeb.gz 4std_lig_coords.pdf
This executes SzmapReport with the default parameters. The file 4std_lig_coords.oeb.gz containing SZMAP -at_coords results is used as input, and the output is written to the file 4std_lig_coords.pdf,
Command Line Help
A description of the command line interface can be obtained by executing SzmapReport
with the --help option.
> szmap_report --help
will generate the following output:
Help functions:
  szmap_report --help simple      : Get a list of simple parameters
  szmap_report --help all         : Get a complete list of parameters
  szmap_report --help defaults    : List the defaults for all parameters
  szmap_report --help <parameter> : Get detailed help on a parameter
  szmap_report --help html        : Create an html help file for this program
  szmap_report --help versions    : List the toolkits and versions used in the application
Required Parameters
Optional Parameters
- -output <filename>
- -o <filename>
[keyless parameter 2]
Output .pdf file containing one or more 2D renderings.
[default = szmap_report.pdf]
- -tagname <prop>
- -t <prop>
[keyless parameter 3]
Atom property used to generate color patches around each atom:
Prop must be one of the property names listed in Appendix 2: SZMAP Atom Properties. The list of tags for a given results file can be displayed by SzmapGrid.
The szmap_neut_diff_free_energy property is one of the most useful. It describes the hydrophilicity/hydrophobicity at each coordinate.
If no tag is specified, an array of properties will be displayed for each input molecule.
Molecule Display Options
- -aromstyle <style>
- -astl <style>
Aromatic ring display style: Kekule, Circle, Dash.
[default = Kekule]
- -atomcolor <color>
- -acolor <color>
Atom coloring style: WhiteCPK, BlackCPK, WhiteMonochrome, BlackMonochrome, cow, cob, bow, wob.
Style
Meaning
cow
(color on white) same as WhiteCPK
cob
(color on black) same as BlackCPK
bow
(black on white) same as WhiteMonochrome
wob
(white on black) same as BlackMonochrome
[default = WhiteCPK]
- -atomstereostyle <style>
- -atomsstl <style>
Atom stereo display style: Hidden, AtomStereo, StandardStyle, FancyStyle. Combined expressions: Created by combining primitive tokens with “|”.
[default = AtomStereo|FancyStyle]
General Options
- -title <text>
Title for each page.
[default = “SZMAP Report”]
- -rows <number>
Number of rows on a page [1-10].
- -cols <number>
Number of columns on a page [1-10].
- -resolution <level>
Quality of color maps representing properties. The level will influence the size of the output—high produces output several times larger than medium produces.
Level
Meaning
low
chunky (grain size: 5 x 5)
medium
smooth (grain size: 2 x 2)
high
very smooth (grain size: 1 x 1)
[default = medium]
- -separate
Output separate pages for each at_coords molecule. The default is to concatenate output. Use
-rowsand-colsto adjust the formatting.
- -legend <bool>
Show property legend.
[default = true]
- -surface <bool>
Show 2D molecular surface outline.
[default = true]
- -keep_hydrogens
Show all the explicit hydrogens in depictions. Requires
-surfaceto be set to false.[default = false]
- -tag_set <set>
Tag set used when no explicit tag is specified. The set ‘v1’ is provided for backwards compatibility with SZMAP version 1 results.
Set
Meaning
min
szmap_neut_diff_free_energy, szmap_vdw, szmap_order
max
szmap_neut_diff_free_energy, szmap_neut_diff_entropy,
szmap_interaction,
szmap_vdw, szmap_psolv, szmap_wsolv
v1
szmap_neut_diff_free_energy, szmap_probe_burial
[default = min]