Spreadsheet
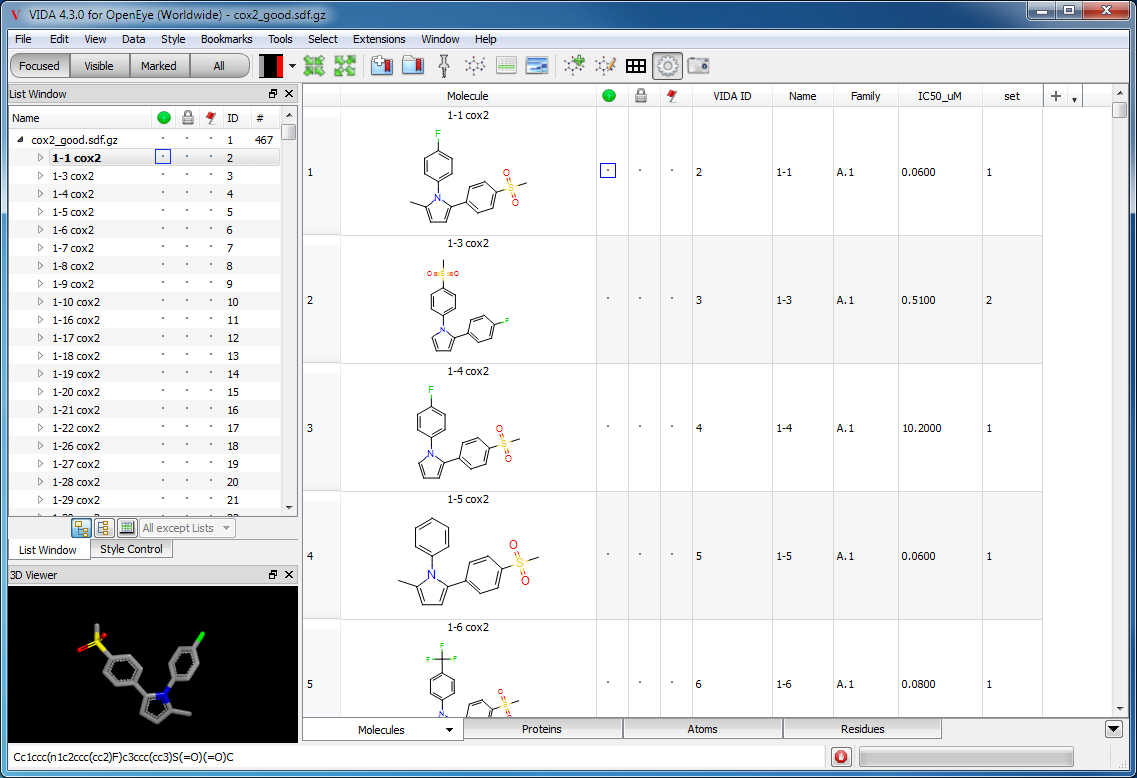
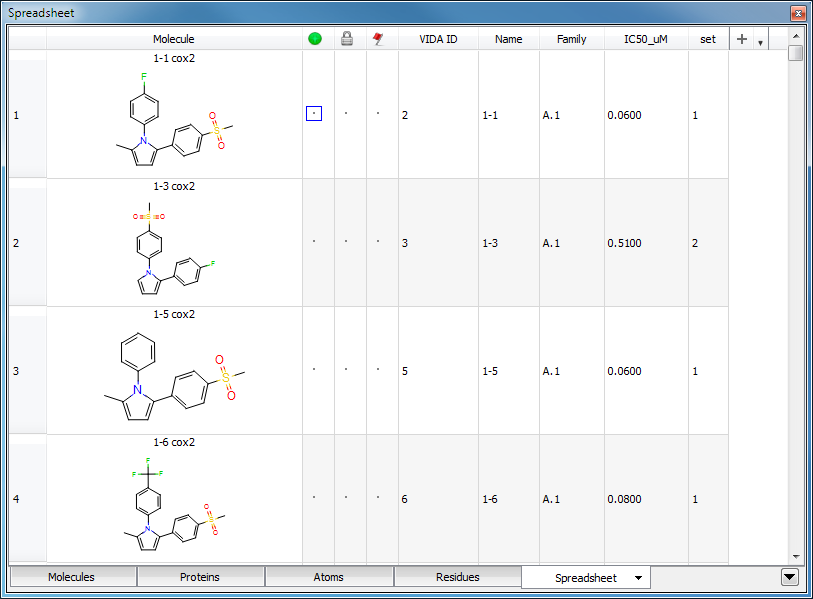
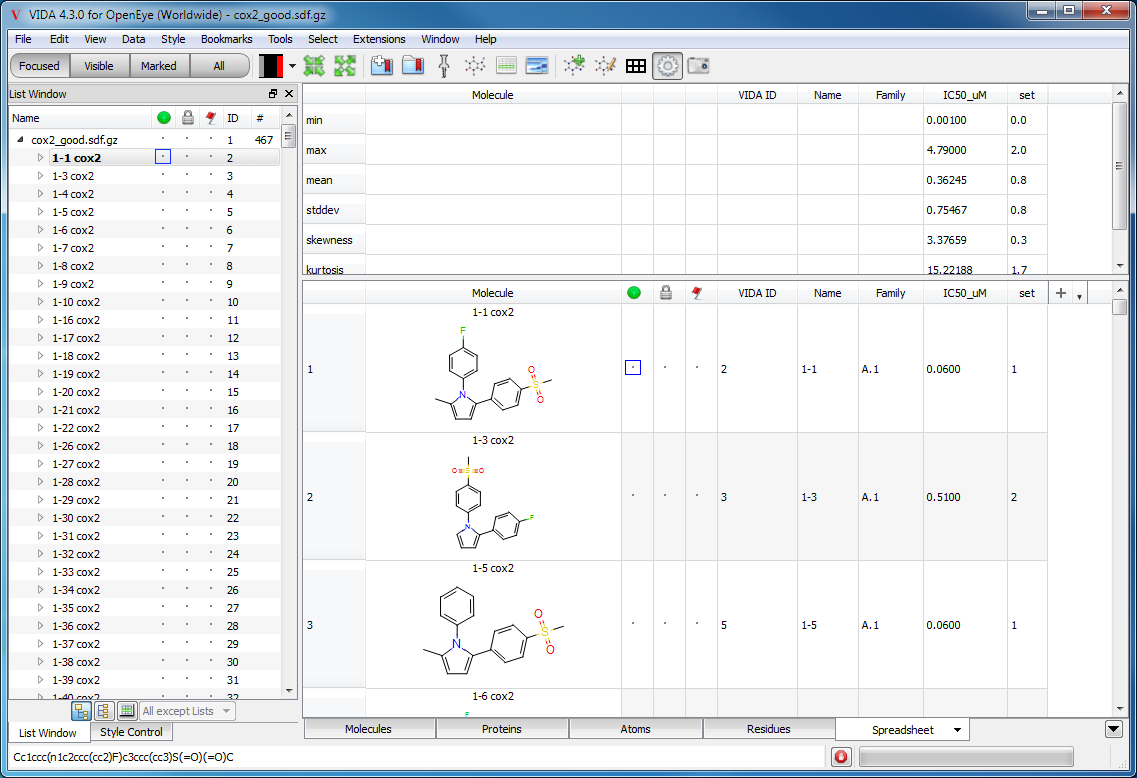
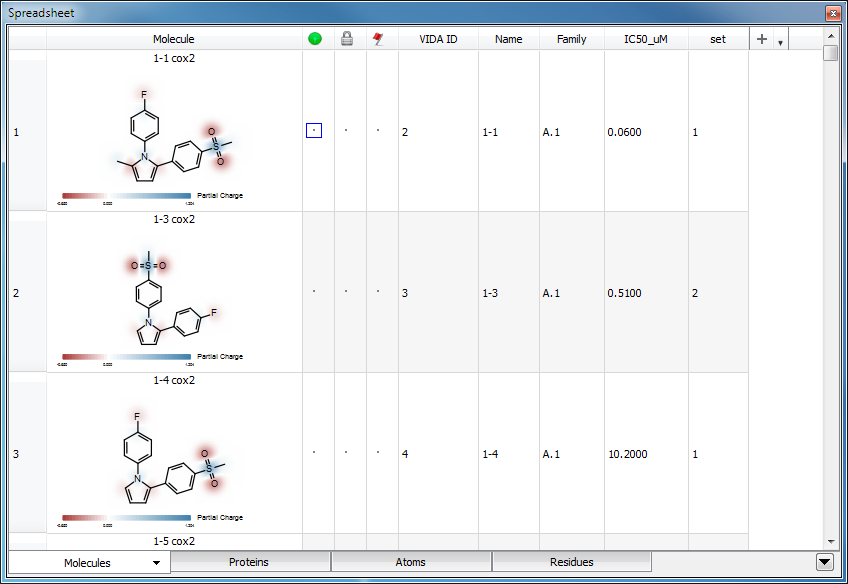
The spreadsheet window is used to view, compute, and analyze data associated with molecules and can be seen in Figure: Spreadsheet Window. The spreadsheet window contains four initial spreadsheets by default: Molecules, Proteins, Atoms and Residues. The Residues and Atoms spreadsheets behave slightly different than the other two and are described later. Additional spreadsheets can be added during use such as the IC50 spreadsheet shown in Figure: Spreadsheet Window.
The Molecules spreadsheet is populated with all currently loaded small molecules (fewer than 255 atoms). Conversely, the Proteins spreadsheet is populated with all of the currently loaded molecules that have more than 255 atoms.
The columns and their associated values are populated from SD data. SD data can be found in both SDF and OEB files. Additional spreadsheet columns can be added from generic data, by computing Python expressions or by importing external data from a comma-separated value (.csv) or tab-separated value file (.txt).
Spreadsheet Window
The spreadsheet being used as the main window of the application
Basic Usage
Columns are divided into two basic types: data and property. Data columns are those found in SD data and/or imported files. Property columns include:
Depiction - This column contains either a 2D depiction of the associated molecule (for small molecules) or an interactive 3D rendering of the protein backbone (for proteins).
VIDA ID - This column contains the unique identifier assigned to that object by VIDA.
VIDA Name - This column contains the title of the molecule as displayed in VIDA.
Visible - This column contains an indicator (green dot) showing whether the molecule is Visible.
Marked - This column contains an indicator (red flag) showing whether the molecule is Marked.
Locked - This column contains an indicator (padlock) showing whether the molecule is Locked.
Clicking on any data cell in the spreadsheet will cause the associated molecule to become the Focused molecule. Double-clicking on a cell in the spreadsheet enables modification of the data value in that particular cell. Some columns cannot be changed, such as the VIDA ID or Depiction columns.
Clicking the mouse on a molecule’s depiction and dragging the mouse to another application will transfer that image to that application. This provides an easy way to transfer molecular images to other documents.
Visible, Marked, and Locked properties can be toggled for selected rows by clicking in their columns, or by pressing the keys, V(isible), M(ark), or L(ock), respectively. When a range of rows is selected, toggling properties in any of the selected rows will toggle the same property in all of the selected rows.
Sorting
A spreadsheet can be sorted by clicking on a column header which will sort the current spreadsheet according to the data values in the associated column. If the data in the column to be sorted contains both numeric and non-numeric values, each set (numeric and non-numeric) will be sorted independently and then concatenated together. Clicking again reverses the sort order.
Multiple columns can be sorted simultaneously by selecting the “Sort Spreadsheet…” option from the top level Data menu. This will launch a dialog that can be seen in Figure: Sorting. This dialog can also be launched by right-clicking on any column header and selecting the “Sort Spreadsheet…” option from the generated popup menu.
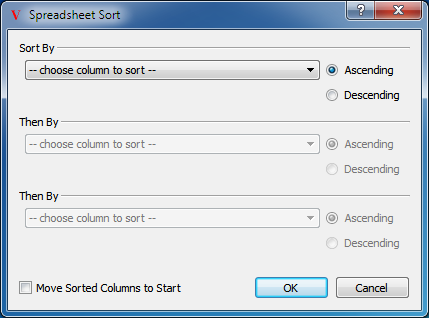
Sorting
Simple dialog to control how the current spreadsheet is sorted
This sorting dialog allows for the selection of up to three columns. The spreadsheet will initially be sorted by the first column selected, with ties being broken by the remaining columns. The sorted columns can be moved to the front of the spreadsheet by selecting the “Move Sorted Columns to Start” option in the dialog.
The first time the spreadsheet is sorted, it may take longer than expected as the data values need to be retrieved from the molecule and any expressions must be calculated. The progress of the sort is indicated by the progress bar at the bottom of the application. If desired, the sort can be aborted by clicking on the stop button to the left of the progress bar.
Displaying Data
The visibility of columns can be toggled by selecting the associated column name from the right-click popup menu generated by clicking on any column header. Data column names can be found in the “Column Visibility” submenu. Hiding the depiction column can allow for more rows to be displayed at the same time.
Certain molecular properties, such as molecular weight, can be added as new columns by selecting the desired option from the “Molecular Properties” submenu in the right-click popup menu. Some of these properties, such as Energy, might not be set on the molecule and as such the associated cell will contain an empty value.
Organizing Columns
Columns can be organized in the spreadsheet by selecting the “Organize Columns” option in the top level Data menu. This will launch a dialog which can be seen in Figure: Column Controller.
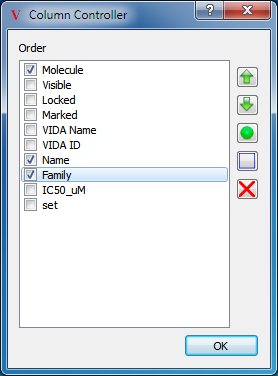
Column Controller
The display of individual columns can be customized using this dialog
The order of the columns can be controlled by selecting individual columns and then clicking on the up or down arrow buttons to change that columns position in the order. Furthermore, columns can be deleted by clicking on the button with the red X icon. Please be aware that deleting a column will delete the associated data from all currently loaded molecules and spreadsheets.
Creating New Columns
Columns for common molecule and atom properties can be easily added to a spreadsheet using the pull-down menu in the far right column of the spreadsheet header. The Molecule Properties (or Atom Properties for the Atoms spreadsheet) submenu of this menu offers large selection of common properties that can be used to make new spreadsheet columns.
|
|
|
Creating a new column |
Using a math function in the expression |
Referencing another column |
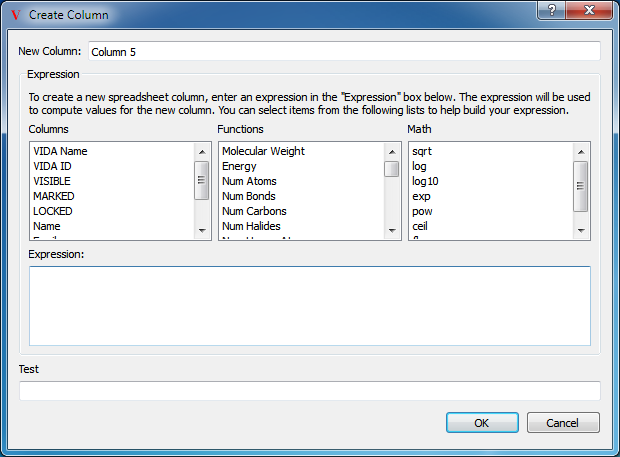
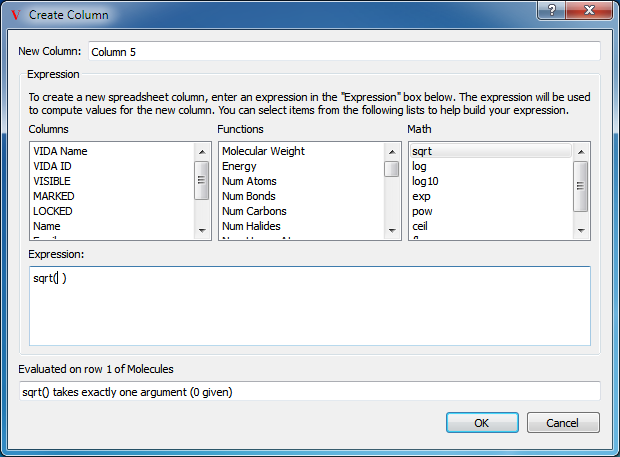
For more complicated properties, new columns can be added to the spreadsheet with values that are based on, or calculated from, molecular properties or existing spreadsheet data. To create a new columns, select the “Create Column” option in the top level Data menu, or click the “+” button in the spreadsheet header. This will launch a dialog to guide the process and can be seen in Figure: Create Column.
Create Column
Create a new spreadsheet column by specifying a Python expression
The text entry field at the top contains the name for the new column. A new, empty and editable column can easily be created by supplying a new column name and then clicking the “Create” button.
Beneath the name is a collection of three lists containing functions which can be used in building the expression to be evaluated when populating the column. The first box contains a list of the already existing columns which can be used as part of an expressions. The second box contains a list of available molecular properties. The third box contains a list of available mathematical functions.
Beneath the boxes is a large text entry window which will contain the desired Python expression used to calculate the new data values. Any valid Python expression can be specified here. Just beneath this window is a test field which displays the output of running the specified expression on the first row in the current spreadsheet.
Math Functions
Specifying a math function to be used in the expression
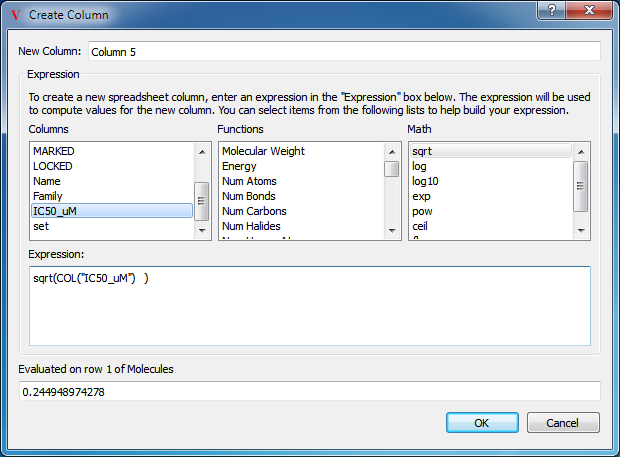
Any of the previously mentioned functions can be added to the Python expression simply by selecting the desired function in the appropriate drop down box. If that function requires additional input (such as functions like sqrt), the cursor in the expression editor window will automatically be placed inside the function. Functions can be combined with standard math operators such as “*”, “+”, “-”, and “/”. If a function requires additional input that is not provided, an error will be displayed in the Test section at the bottom of the dialog as seen in Figure: Math Functions. Frequently, the desired input is contained within another column which can be referenced by selecting the desired column from the third drop down box or simply by typing “COL(‘COLUMN NAME’)” as seen in Figure: Referencing a Column.
Referencing a Column
Referencing another column to provide data for the expression
Once the desired expression has been assembled, the column can be created and added to the spreadsheet by clicking on the “OK” button.
Math Functions
A number of math functions are available for use in spreadsheet expressions as described in the previous section. The currently available math functions can be found in Table: Math Functions.
Name |
Description |
|---|---|
sqrt(x) |
Return \(\sqrt{x}\). |
log(x[,base]) |
The logarithm of x to the given base. If the base is not specified, returns ln(x). |
log10(x) |
The base 10 logarithm of x. |
exp(x) |
Return \(e^x\). |
pow(x,y) |
Return \(x^y\). |
ceil(x) |
Return the ceiling of x as a float. This is the smallest integral value >= x. |
floor(x) |
Return the floor of x as a float. This is the largest integral value <= x. |
OEChem Functions
A large number of molecular properties are available for use in spreadsheet expressions as described above. The currently available molecular properties can be found in Table: OEChem Functions.
Name |
Description |
|---|---|
Molecular Weight |
Molecular weight. |
Energy |
Molecular energy of the molecule as specified in the input file. |
Num Atoms |
Number of atoms in the molecule. |
Num Bonds |
Number of bonds in the molecule. |
Num Halides |
Number of halogen atoms in the molecule. |
Num Carbons |
Number of carbon atoms in the molecule. |
Num Heavy Atoms |
Number of heavy atoms (non hydrogen) in the molecule. |
Num Hetero Atoms |
Number of hetero atoms in the molecule. |
Num Hydrogens |
Number of hydrogen atoms in the molecule. |
Num Hydrogen Acceptors |
Number of hydrogen bond acceptors in the molecule. |
Num Hydrogen Donors |
Number of hydrogen bond donors in the molecule. |
Carbon-Hetero Ratio |
Ratio of carbons to hetero atoms in the molecule. Returns 1 if there are no carbons in the molecule. |
Num Rigid Bonds |
Number of rigid bonds in the molecule. |
Num Rotatable Bonds |
Number of rotatable bonds in the molecule. |
Formal Charge |
Sum of the formal charges on all atoms. |
Num Formal Charges |
Number of atoms with a specified formal charge. |
Partial Charge |
Sum of the partial charges on all atoms. |
Is Chiral |
1 or 0, indicating whether the molecule is chiral. |
SMILES |
SMILES representation of the molecule. |
Molecular Formula |
Molecular formula for the molecule. |
Filtering
New spreadsheets may be generated from an existing one by means of filtering. The mechanism to filter a spreadsheet is very similar to the creation of a new column. To create a filtered spreadsheet, select the “Filter Spreadsheet…” option from the top level Data menu, or right-click in the header of the spreadsheet and choose “Filter…”. This will launch a dialog which can be seen in Figure: Filter Dialog. This dialog will assist in the creation of a new filtered spreadsheet based on the currently viewed spreadsheet. Please note, that it is possible to create filtered spreadsheets on other filtered spreadsheets. The result of a filtering operation can be seen in Figure: Filtered Spreadsheet.
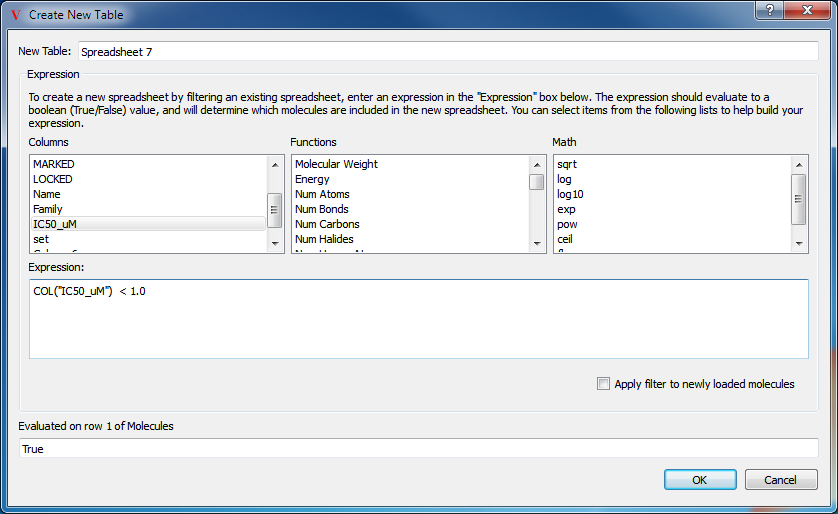
Filter Dialog
Create a new spreadsheet by filtering on a specified column
Filtered Spreadsheet
A new spreadsheet created by filtering on the values in a specified column
Filter expressions are very similar to column generation expressions, except that the return value of a filter expression determines whether or not that row will be included in the new spreadsheet. Rows for which the expression returns either False or 0 will not be included.
A wide variety of filters are possible through the judicious use of Python in the expression. For instance, the following expression will filter only those matching the specified text string:
"<100" in str(COL("IC50_uM"))
Statistics
Statistics for each numeric column can be viewed in the spreadsheet window. The display of statistics is controlled by toggling the “Show Statistics” option in the top level Data menu. Toggling this option controls the display of statistics for just the currently viewed spreadsheet.
The following statistical information is computed for each numeric column:
min - The minimum value of the column.
mean - The maximum value of the column.
stddev - The standard deviation of the column.
skewness - The skewness of the column.
kurtosis - The kurtosis of the column.
Statistics
Displaying statistical information on the associated spreadsheet
The statistics display is a dynamic view of the spreadsheet data and therefore when data is altered in the spreadsheet the statistics view is automatically updated. For large data sets, this may take some time and could cause editing the spreadsheet to be cumbersome. To avoid this problem, it is best to hide the statistics display until the editing process is complete.
Formatting Columns
There are a variety of different display styles for spreadsheet columns which can be edited on an individual basis. The customizable styles include color, font, significant digits, and cell height. The style for individual columns can be edited by selecting the “Format Columns…” option in the top level Data menu. This will launch the dialog seen in Figure: Column Formatting.
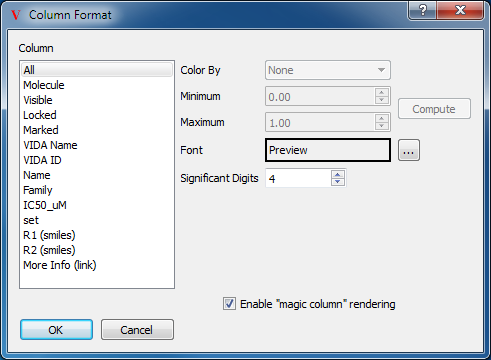
Column Formatting
Many formatting options are available for each individual column
On the left hand side of the dialog is a list of all the currently available spreadsheet columns, including an All option. Any formatting changes made in this dialog will be applied to the selected columns in this list.
On the right hand side of the dialog is a collection of formatting and display options. At the top is a drop down menu of available coloring schemes which include:
Red to Blue
Blue to Red
Rainbow
Rainbow Backwards
Red Yellow Blue
Grey to Green
The selected coloring scheme will be applied to the column using the scale specified beneath the drop down menu determined by the minimum and maximum values. The default values are 0.0 and 1.0 respectively, but the current minimum and maximum values for the selected column can be computed by clicking on the “Compute” button to the right of the minimum and maximum fields.
The “Enable ‘magic column’ rendering” option allows specialized rendering of data, based on column names and cell contents. With this option enabled, data in any column with a name containing “(smiles)” will be interpreted as SMILES strings, and displayed as chemical structures. Data in any columns with “(link)” in the name will be interpreted as URL’s. The name of the column, minus the “(link)” string, will be displayed in each cell as an active hyperlink. URL’s in columns without “(link)” in the column name will be displayed as raw hyperlinks. See Figure: “Magic Column Rendering”.
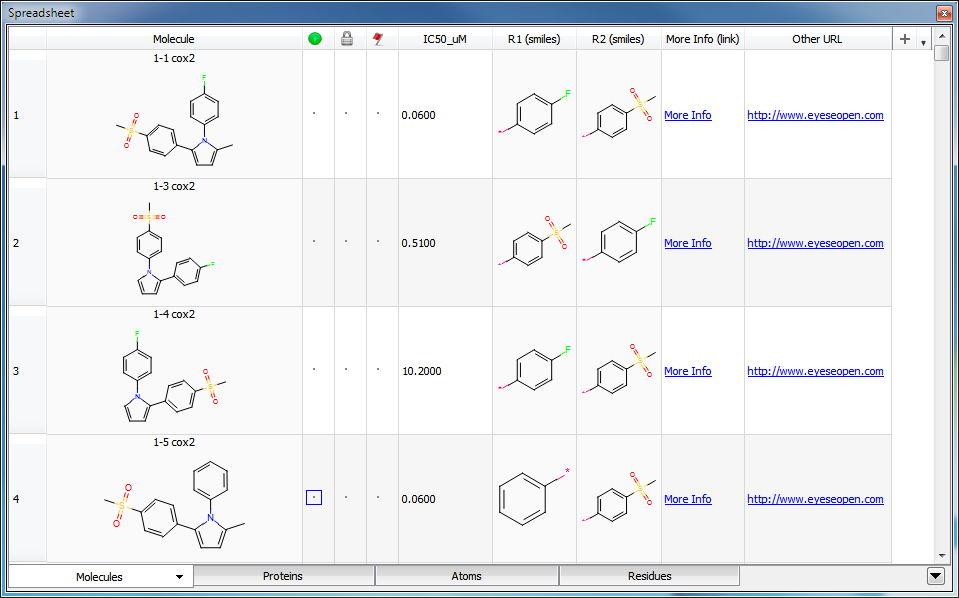
Magic Column Rendering
With “magic column” rendering enabled, columns containing “(smiles)” or “(link)” in the column name will be displayed as chemical structures or hyperlinks, respectively.
Common HTML tags can be rendered in spreadsheet cells, with the notable exception of image (<img>) tags, which will not work.
Advanced Depiction Options
The advanced depiction options described in the 2D Display chapter apply to structure depictions in the spreadsheet, as well as the 2D Display. See Figure: “Template Highlighting” and Figure: “Atom Property Maps” for examples.
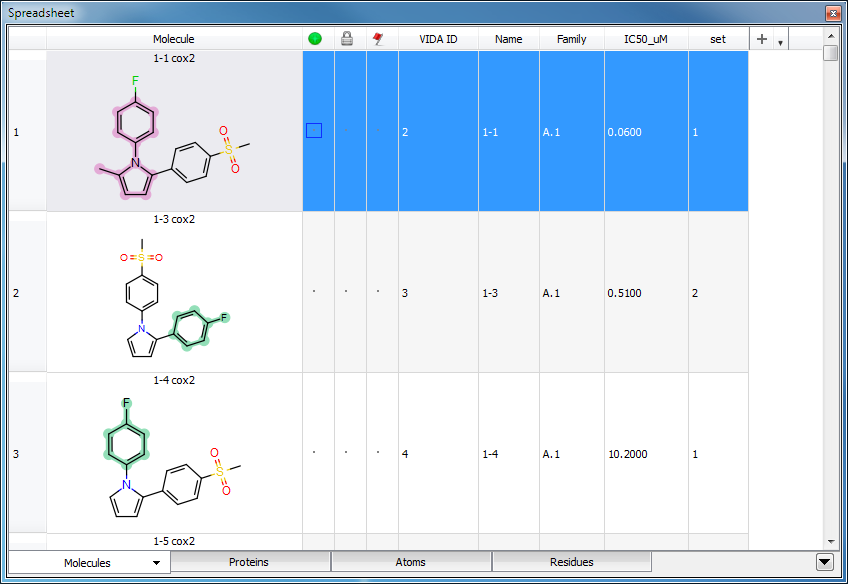
Template Highlighting
Spreadsheet depictions with template highlighting enabled
Atom Property Maps
Spreadsheet depictions with Partial Charge property maps enabled
Importing/Exporting
Importing
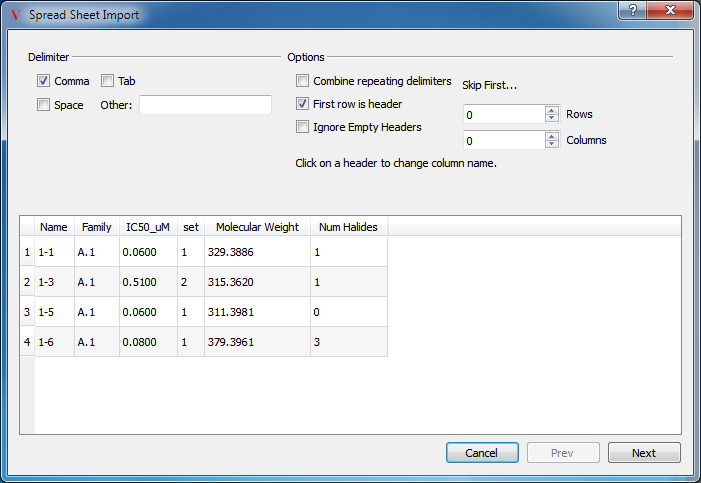
Spreadsheet data can be imported from external files in a variety of formats including comma-separated values (.csv) and tab-delimited values (.txt). To import a file, select the “Spreadsheet…” option in the Import submenu of the top level File menu. This will launch a dialog to assist in the import process which can be seen in Figure: Importing (1).
Importing (1)
Specifying the delimiter type and other options
At the top of the dialog are a number of options to specify the format of the file to be imported and at the bottom is a quick preview of what VIDA thinks the first five rows are. Note that in the figure only four rows are displayed in the preview because the first row is being interpreted as the header. The preview will update dynamically to match any changes made to the options at the top.
Once the preview of file to be imported is satisfactory, click on the Next button to specify how the rows are to be matched to currently loaded molecules and what to do with rows that do not match (see Figure: Importing (2)).
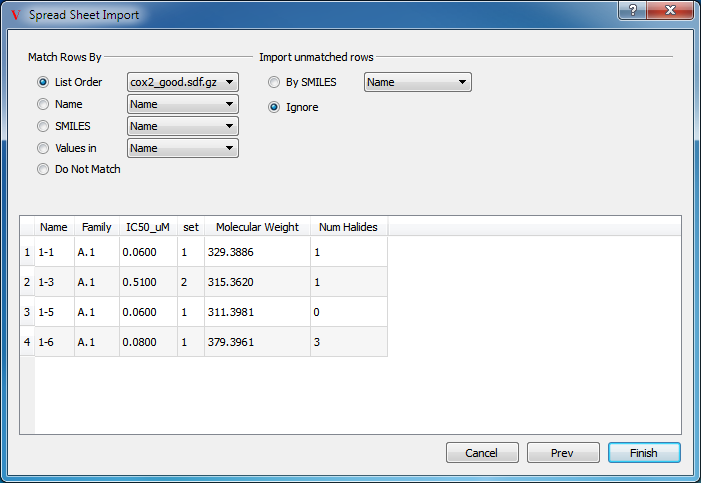
Importing (2)
Specifying how to match the imported data
There are a number of mechanisms available to match data rows to the appropriate molecules in VIDA:
List Order - matches the order of rows in the spreadsheet with the order of molecules in the selected list.
Name - matches the molecule’s name with the name in the selected column of the imported data.
SMILES - matches the molecule’s canonical SMILES string with the SMILES string in the selected column of the imported data.
Values In - matches the value in the selected column between the imported data and the value already in the spreadsheet.
Do Not Match - assume that you are importing new molecules
Unmatched rows can also be imported into the spreadsheet by creating a new molecule in VIDA to be associated with that row. The following options are available for unmatched rows:
By SMILES - use the SMILES string in the selected column of the imported data to create a new molecule.
Ignore - Do not import unmatched data.
Exporting
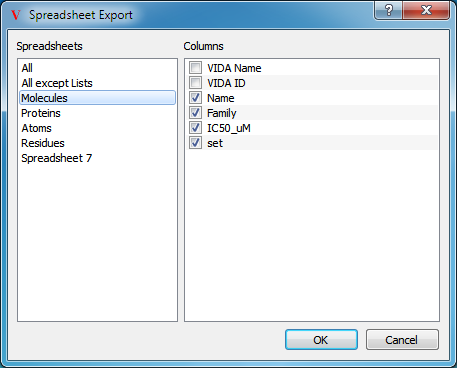
Spreadsheets may be exported to an external file by selecting the “Spreadsheet…” option in the Export submenu of the top level File menu. Selecting this option will launch a dialog which allows for specification of which columns to export (see Figure: Exporting). Supported formats include comma separated (.csv), tab delimited (.txt), and Portable Document Format (.pdf).
Exporting
Specifying which spreadsheet and columns to export
Atom Spreadsheet
The Atom spreadsheet is a specialized spreadsheet provided by default that contains an entry for every atom in the Active molecule. A wide variety of atom properties can be displayed in the spreadsheet. Highlighting one or more rows in the spreadsheet will select the associated atoms in the 3D display. Atom visibility and marked status can also be controlled by toggling the state of the relevant columns.
Residue Spreadsheet
The Residue spreadsheet is a specialized spreadsheet provided by default that contains an entry for every residue in the Active molecule. Alternate residue conformations (if present) can be controlled by clicking on the relevant columns in the spreadsheet.
Note
In order to perceive alternate conformations the ALL input flavor must be turned on for the PDB file format. This can be set in the Molecule I/O section of the application preferences.