ML Predict: Use Pretrained Regression Models to Predict Properties of Molecules
In this tutorial, we will use a trained, fully connected neural network model to predict physical properties of molecules. The floe predicts the property of each molecule and explains it. It also generates confidence intervals.
This tutorial uses the following floe:
To learn how to build a machine learning model to use for prediction, read the tutorial for the ML Build: Regression Model with Tuner using Fingerprints for Small Molecules Floe.
Note
If you need to create a tutorial project, please see the Setup Directions for the Machine Learning Model Building Tutorials.
Floe Input
The required inputs for this floe are:
Molecule Dataset P1
Tensorflow Machine Learning Model Dataset M1
The P1 dataset contains several OERecords. The floe expects an OEMol from each record, which is the molecule whose physical properties the model will predict.
Here is a sample record from the dataset:
OERecord (
    Molecule(Chem.Mol) : c1ccc(c(c1)NC(=O)N)OC[C@H](CN2CCC3(CC2)Cc4cc(ccc4O3)Cl)O
)
There can be another float field containing the physical property values to validate against. The following dataset does not contain said field.
To learn how to generate these models, read this tutorial on building models in Orion. The M1 dataset contains one or more machine learning models for use in this tutorial. It is a sample trained TensorFlow Model that can be used to predict solubility.
Input Machine Learning Model
Sample trained Tensorflow model for prediction M_1 (TF Model 6_8_71.oedb)
Run Generic Property Prediction Floe
Choose the ML Predict: Regression using Fingerprints for Small Molecules Floe. Click “Launch Floe” to bring up the Job Form. The parameters can be specified as below.
Input Small Molecule Dataset: Select P1.
Input Tensorflow Model: Select M1.
Output Property for Fingerprint-based Regression: The predicted molecules will be saved to the name in this field, so change it to something meaningful to you.
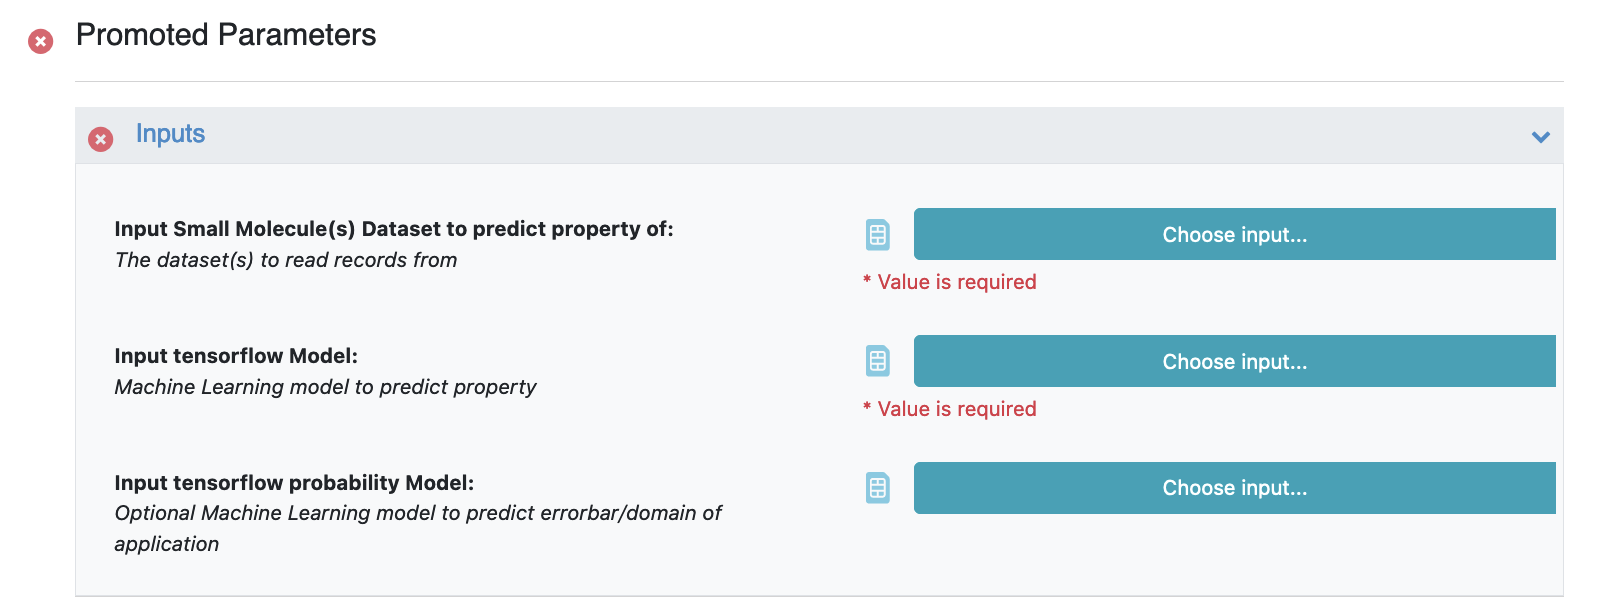
Figure 1. Input datasets.
Set Model ID of which Tensorflow model to use to predict.: The Model ID can by found by activating the dataset in the 3D & Analyze Page. For our case it is 1.
Property Validation Field: If your small molecule dataset has a field containing the predicted value (sourced from elsewhere), use this option on to get a statistical comparison between this value and the prediction.
That’s it! Let’s run the floe. Click the “Start Job” button.
Analyze OEModel Floe Report
Here is a sample image of the Floe Report (assuming you ran a fully connected neural network model like M1).
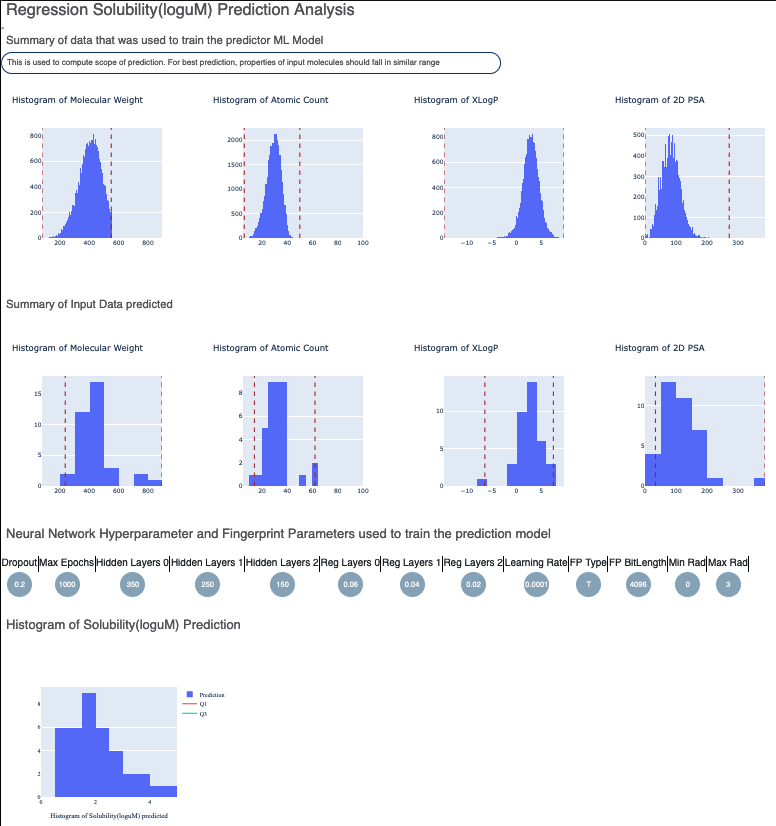
Figure 2. The Floe Report for the property prediction floe.
These statistics help analyze the input molecules predicted. First are the hyperparameters on which the model was trained. Next is the histogram of the output prediction, as well as the confidence of each prediction. Finally, there is a plot showing the confidence of the prediction versus the actual output.
The following graphs show outlier prediction using:
MAD Technique: Median of Absolute Deviation
Percentile Technique: Percentile Outlier
The third plot shows the number of active (1) fingerprint bits versus the prediction to inspect if any correlation exists.
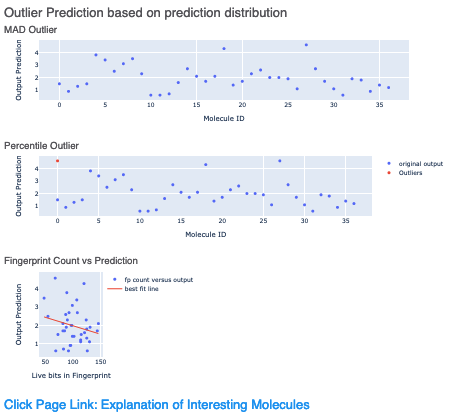
Figure 3. Three methods of outlier prediction.
Lastly, there is a link to a page under Interesting Molecules that shows the annotated images which explain the outlier and central molecules.
Analyze Output
On the Data page, activate the data that the floe produced. This should have the same name you chose in the Output Prediction field for your floe. Activate the dataset by clicking on the circle with a plus sign.
On the 3D & Analyze page, you should see the molecules, their predicted pyrrolamide values, and the explanation of the output.
Output Columns and Explanations
Confidence: How confident the model is with its prediction on a scale of 0–1.
Contributions: Explanation of the prediction based on a local model. If the image has a dark background, it means there is an error or warning issued. Based on the choice of molecule explainer (fragment by default), different parts will be color-annotated, with blue denoting more contribution towards the physical property (solubility) and red denoting the opposite.
HighestTaniSimilarity: The highest 2D Tanimoto similarity with any molecule in the training set.
HighestTaniSimilarityProperty: The NegIC50 of that training set molecule on record.
These two fields show whether there is a similar molecule in the training set, and if so, what its physical property value is.
Scope: If there is an error or warning, what caused the issue.
Class Predict (Physical Property): Predicts the property as High, Medium, or Low. The background color suggests how confident the model is, with green (most confidence), yellow (average confidence), and red (least confidence or out of scope).
Prediction (Physical Property): Physical property prediction of the molecule.
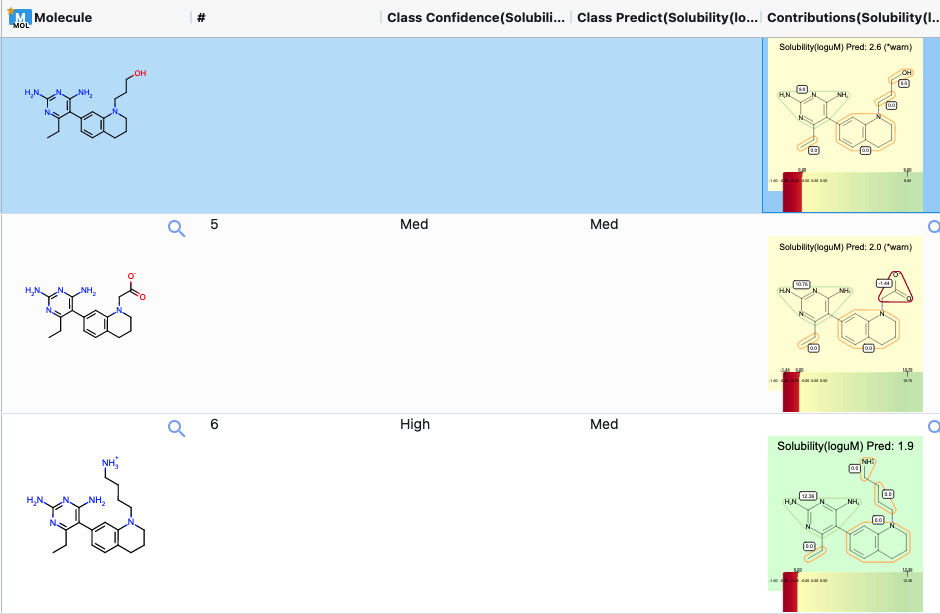
Figure 4. Output columns of the spreadsheet on the 3D & Analyze page.
Note
We assign ID numbers to each record molecule. This follows a linear ordering over all molecules. If you activate both the successful and failure predictions and sort them by number, the order should be the same as for the input.