Data Processing of Small Molecules for ML Model Building Floes
We often see noisy samples with multiple values, especially when working with open source data. This floe attempts to clean such noisy data before it is supplied to a machine learning (ML) framework for training properties. The data processing floe analyzes and preprocesses data for training ML models. The floe cleans the molecule by retaining the largest molecule (if multiple molecules are present in a single record), adjusts ionization to a neutral pH, and rejects molecules that fail typecheck. The floe also investigates molecular properties, including molecular weight, atom count, XLogP, rotatable bonds, and PSA. Outlier molecules are sent to the failure port. The Floe Report gives a detailed report of these results.
For duplicate molecules, we add a duplicate warning in the output and include a box plot in the Floe Report to indicate the count. For the float (regression) response value, the duplicates are set to an average. If the variance of the float value is too high, we reject all the duplicate molecules. For an input string or int response for classification purposes, we set this to the highest count of response.
The Floe Report provides additional details, such as the correlation of response with physical properties and a count of outliers. In this tutorial, we will use this floe to clean custom-made noisy data.
This tutorial uses the following floe:
Data Processing of Small Molecules for ML Model Building
Note
If you need to create a tutorial project, please see the Setup Directions for the Machine Learning Model Building Tutorials.
Floe Input
One of the required inputs is a molecule dataset, P1.
This dataset contains several OERecord(s). The floe expects an OEMol from each record. The model will predict the physical properties of these molecules.
Here is a sample record from the dataset:
OERecord (
    *Molecule(Chem.Mol)* : Cc1c(c(c(cn1)COP(=O)(O)O)C=O)O
    *Herg Class(String)* : Active
)
Input Data
Run the Generic Property Prediction Floe
Choose the Data Processing of Small Molecules for ML Model Building Floe. Click “Launch Floe” to bring up the Job Form. The parameters can be specified as below.
Input Small Molecule Dataset: Choose P1 from above.
ML Data Processed Output Molecules: All the molecules that have been cleaned will be saved to this file. Change it to a name you will recognize.
- Under Options, select the Response Value Field parameter and set it to the property that will be used to train the ML models.
A Float value for a regression property to be learned.
A String/Int value for a classification property. For our example, set it to Herg Class.
Response Analysis: Choose Auto, so the floe will default to classification; the input Herg Class is a String value (same for Int). If the response value is Float, it would default to regression. However, there are borderline cases where either the String or the Int classes have too many values. The floe will suggest using the data to train a regression model instead. On the other hand, if a regression float field has less response values, the floe suggests training a classification model.
In our case, we can keep Response Analysis on Auto or change it to Classification.
Trim Molecules with Outlier Chemical Properties: Remove molecules with Molecular Weight, Atom Count, Rotatable Bonds, LogP, PSA and response values higher than three times the variance of data. Since ML models don’t perform well on noisy data, the default Trim Outlier removes outliers based on the histogram of chemical properties of the entire dataset. If you wish to remove specific properties, such as molecular weight, select Cutoff, along with the next parameter.
Min and Max Cutoff Values: This changes the Trim Molecules with Outlier Chemical Properties parameter to Cutoff. The first value is a lower cutoff for the Trim Molecules property, and the second value is a higher cutoff.
Scaffold Splitting: For a detailed explanation of this parameter, please see the Scaffold Splitting section at the end of this tutorial.
Graph Feature Vector Generation: This option allows you to parameterize GCNN tensors for this floe. This step creates a crucial collection of graph feature tensors, with each tensor representing a molecule in your dataset. Think of this as the “featurization” step where your molecules are converted into a format (graph feature vectors) that the GCNN can understand.
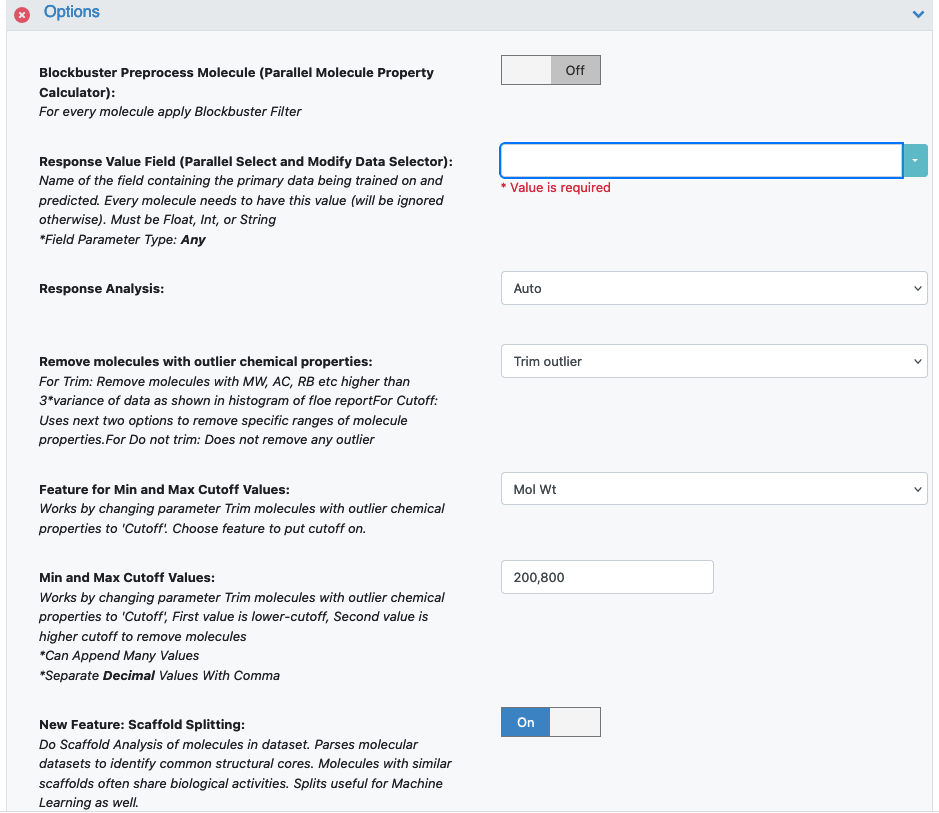
Figure 1. Response Value and Response Analysis parameter fields.
Press the “Start Job” button to run the floe.
Analyze the Output
There are two output ports: Success and Failure.
On the Data page, activate the output failure data that the floe produced. This should have the same name you chose in the ML Data Processed Failure Molecules field for your floe. Activate the dataset by clicking on the circle with a plus sign.
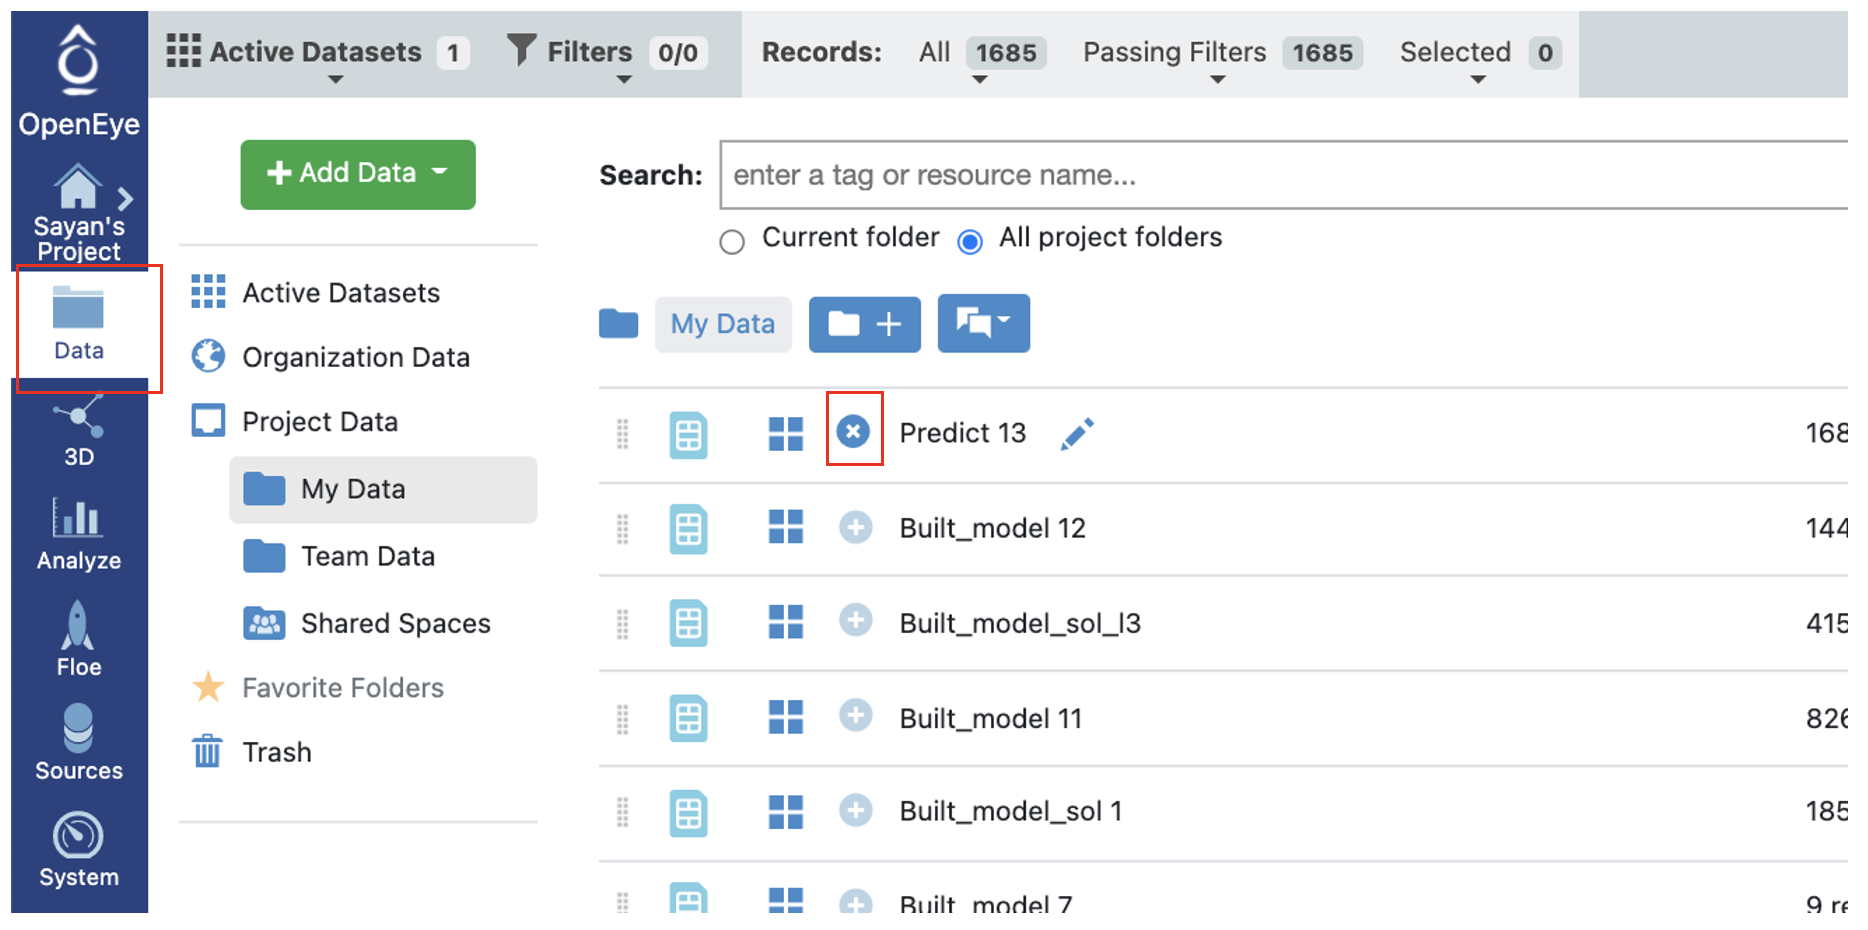
Figure 2. Activating a dataset.
Output Meaning
Failure Data: There are two reasons for failure: either the molecule falls out of scope for physical properties like XlgP or MW, or it is a duplicate.
On the Analyze page, you should be able to see the molecules and why they were sent to the failure port. Another field states whether the molecule was a duplicate, and if so, what was the response of the single copy that was sent to the success port. For classification, if there are n duplicate molecules, n-1 will be sent to Failure; the sole molecule sent to Success will have the median of response values. For regression, this will be the average value, unless the spread of response value is too high. Note that this cutoff can be changed under the cube parameter of the Data Process Statistics Calculator Cube.
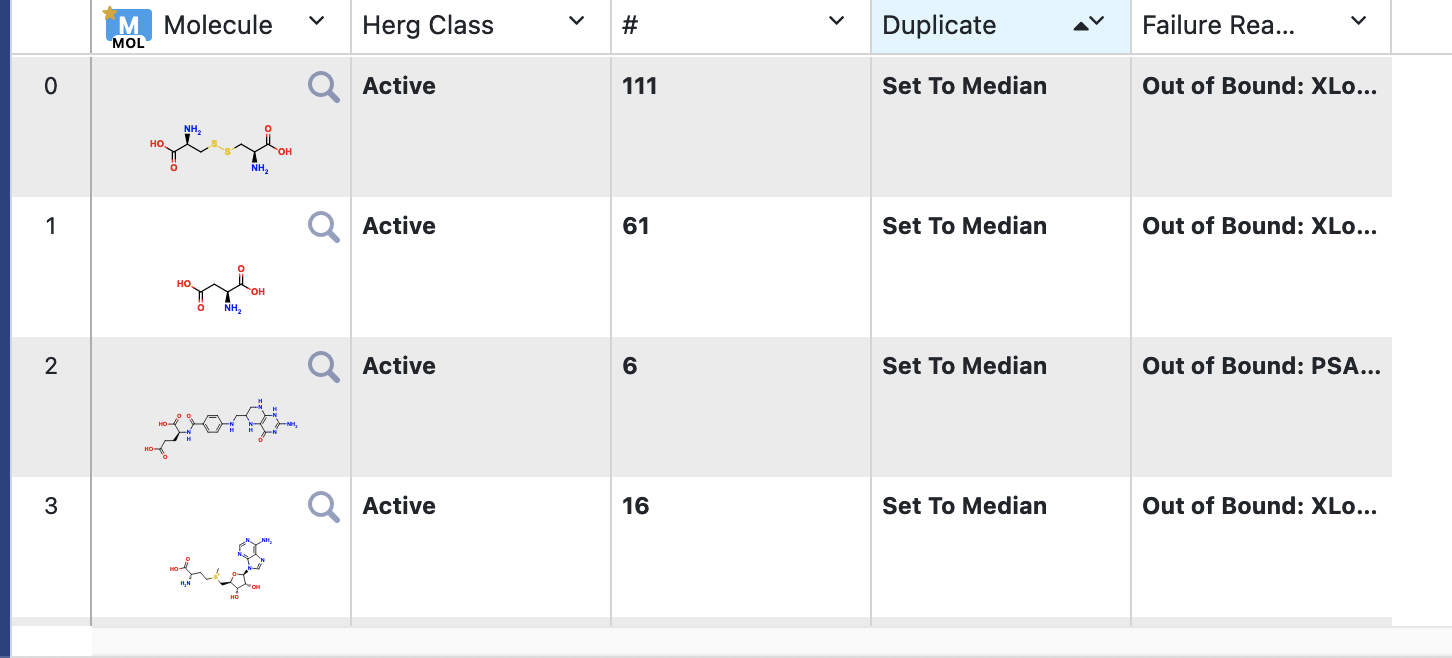
Figure 3. Failure data.
All data not deemed a failure will be sent to the Success port.
Success Data: Success data either falls within scope, or, if there were multiple copies of a molecule, this is the first instance and its response is set to Median (for classification examples such as this) or Average (for regression).
Analyze the OEModel Floe Report
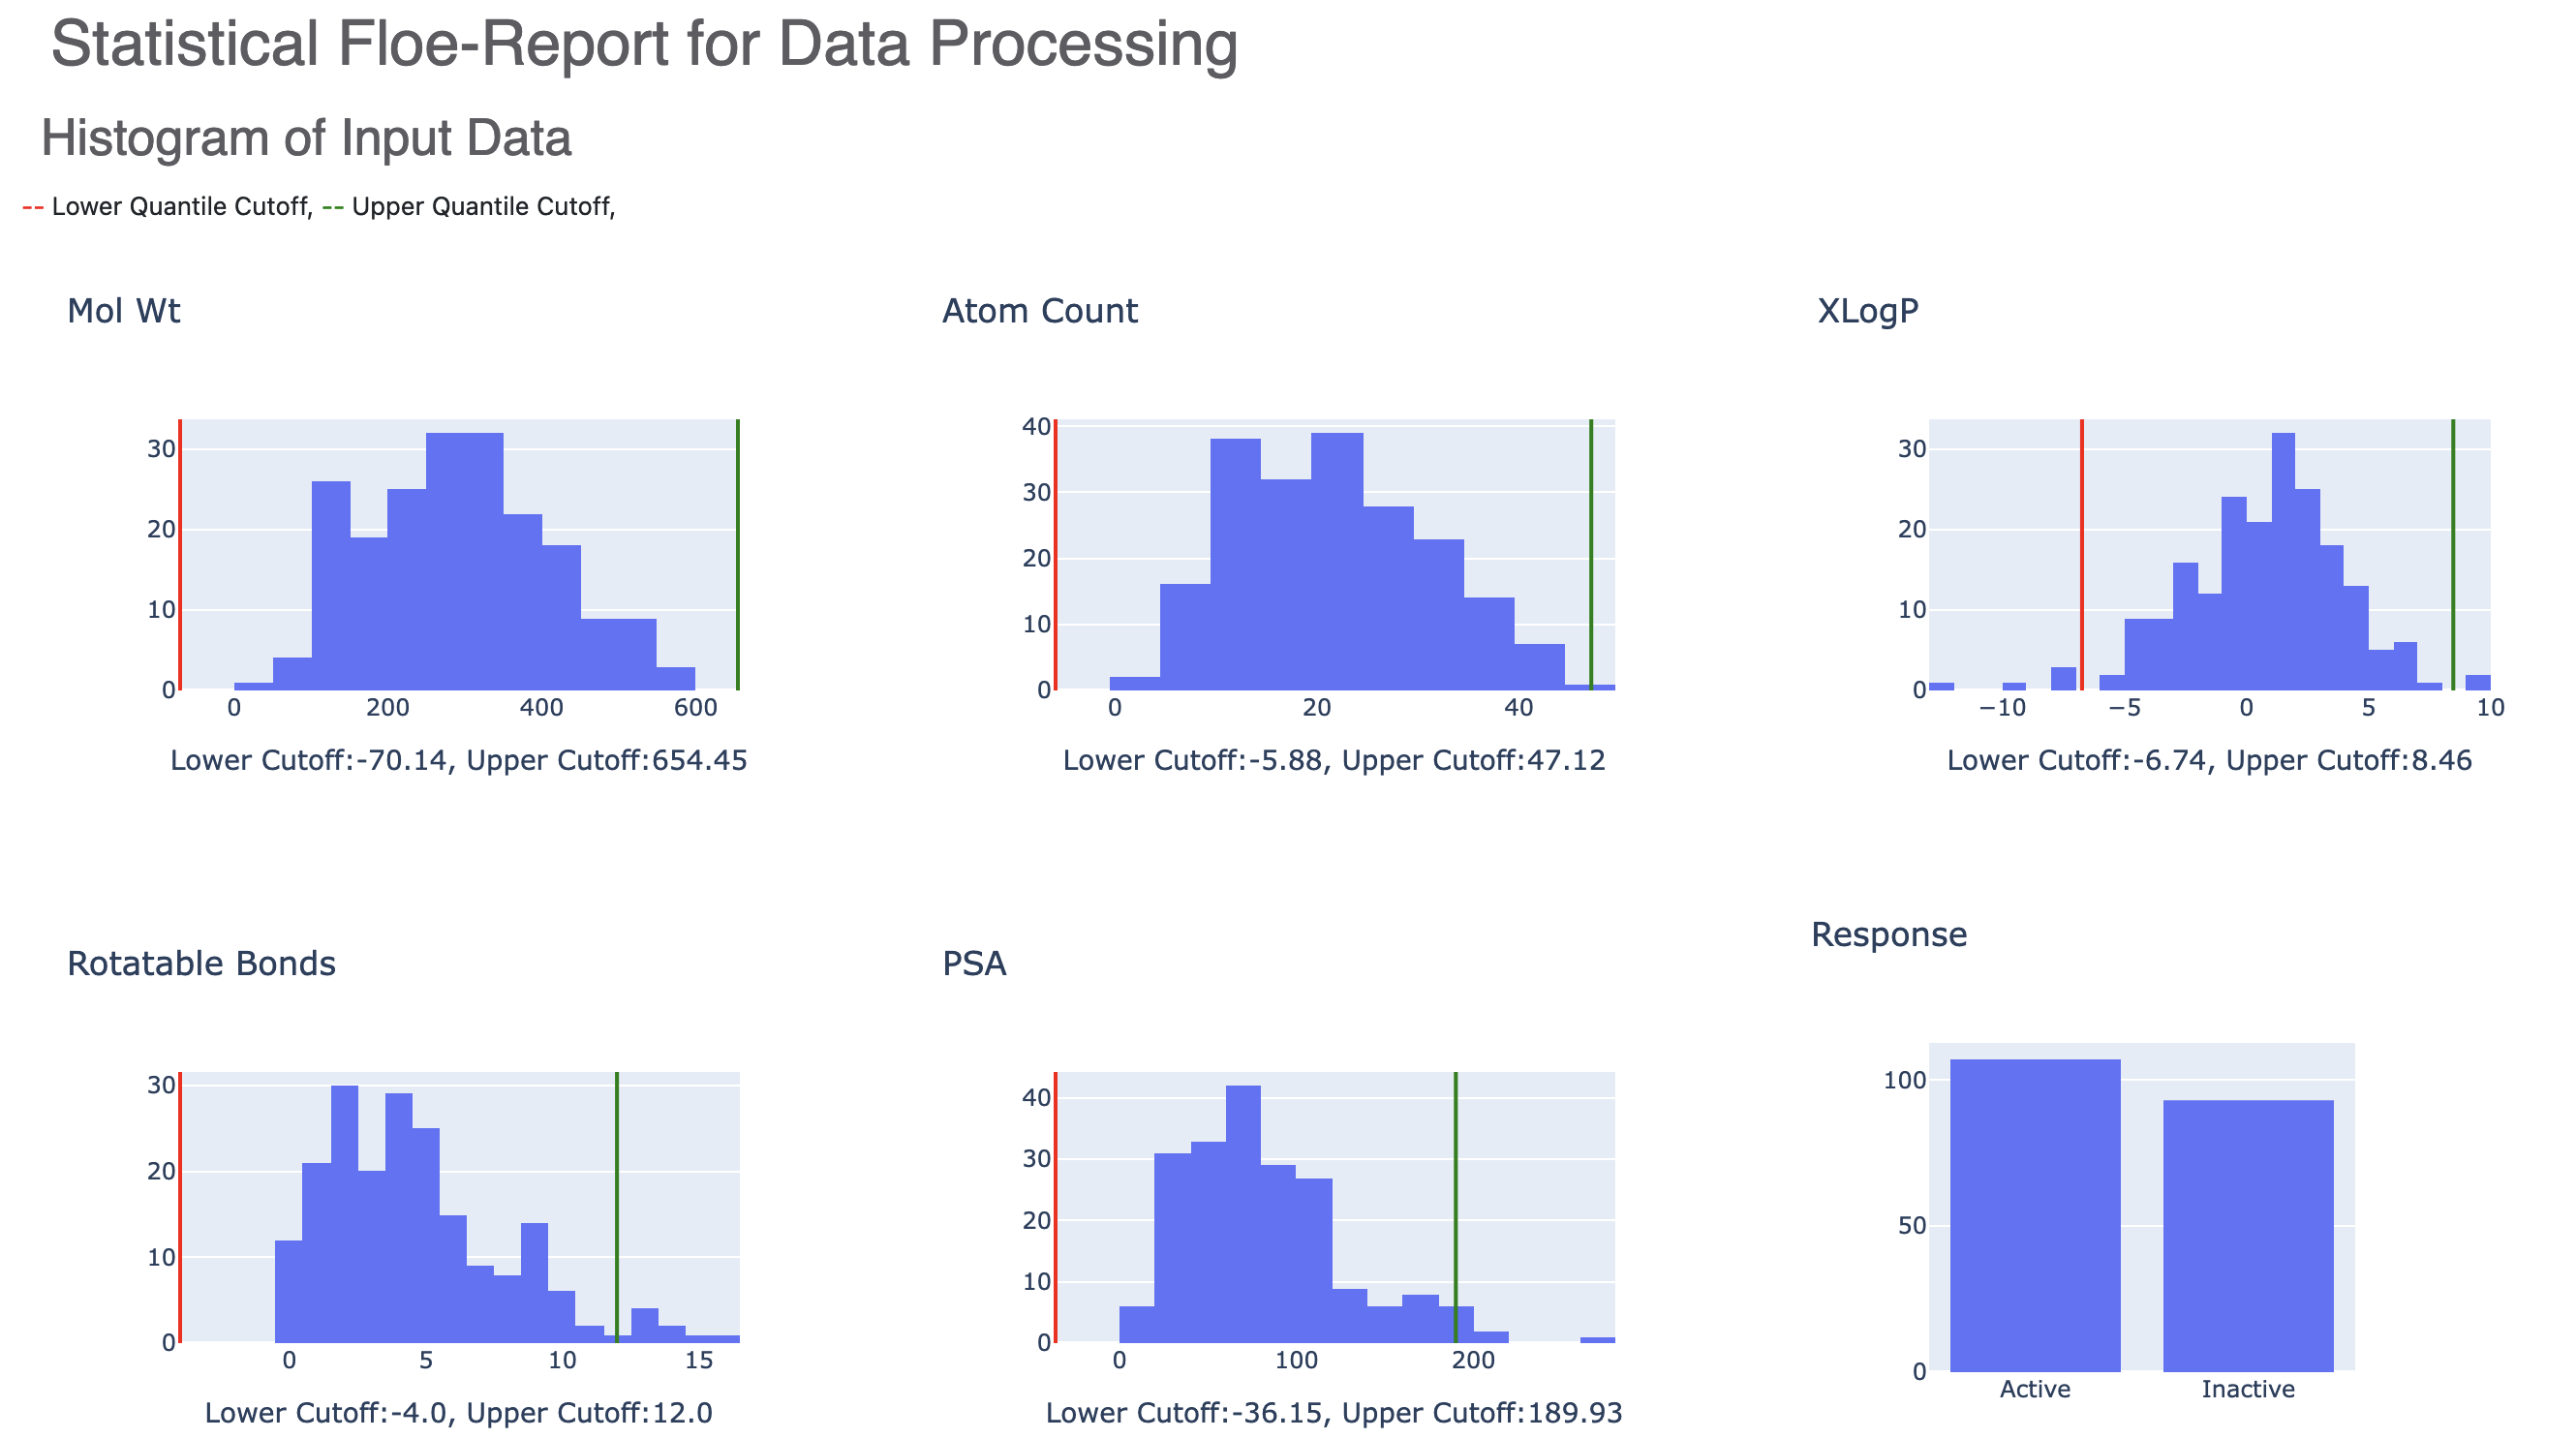
Figure 4. Histograms of input data.
The Floe Report contains histograms of the input data with the lower and upper quartiles marked by red and green lines, respectively. Any molecules outside of these bounds are sent to the failure port. The resulting response histogram is also shown.
The Floe Report also contains information about failed molecules. Figure 5a gives a count of the molecules sent to failure and for what reason. Figure 5b shows a histogram of duplicates. The names and responses of these molecules can be seen by hovering over this plot.
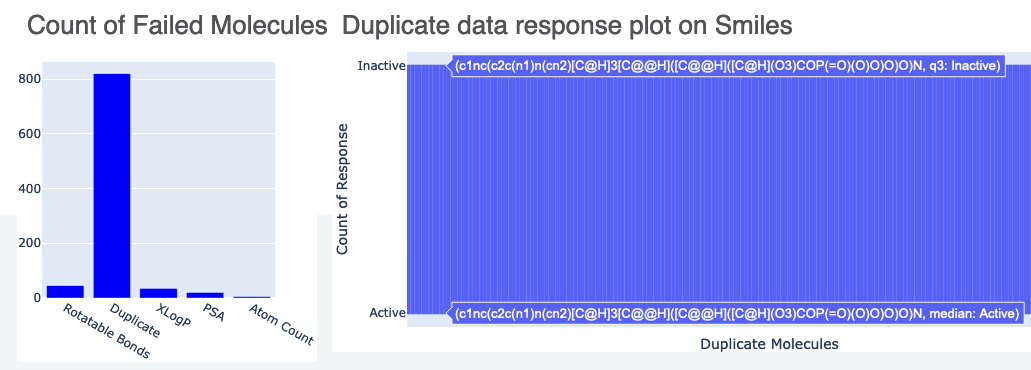
Figure 5. Data for failed molecules: a. count of failed molecules and b. duplicate data response using SMILES.
The final part of the report suggests node sizes for the ML models to be trained on this data.
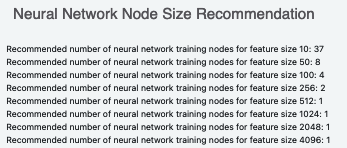
Figure 6. Neural network node size recommendations.
Scaffold Split
The data preprocessing floe can also analyze the scaffold diversity of the input dataset. Scaffold analysis parses molecular datasets to identify common structural cores. Molecules with similar scaffolds often share biological activities. This process reveals patterns that are crucial for understanding structure-activity relationships. Scaffold analysis aids in predictive modeling. It allows for the creation of robust models tailored to specific scaffold clusters, enhancing virtual screening and lead optimization. Additionally, scaffold analysis ensures rigorous model validation and generalization by partitioning datasets into training and testing sets based on scaffold similarity.
The scaffold split divides data into training and validation sets (validation being done after the entire training is completed). The data preprocessing floe creates values of true and false. True is for the training set, and false is for the validation set. The goal is to perform a three-way partition (train-test-validation). The initial division of the input into train and validation is 90-10 by default and changeable by cube parameters. The splits do different things based on how the split is done.
The ML Build floes split the training set (true from the data prep floe) again using cross-validation to make the three-way split train-test-validation. True is split into train and test, making it 80-10-10 to train-test-validation. The three-way split helps to evaluate the best hyperparameters to use in your floes. The ML Build floes do a k-fold cross validation (the value of k can be changed in the cube parameters). For each fold, the model partitions training into a new set of train-test data. This is done during runtime: fixing the test set would limit the power of cross validation learning.
Finally, once the model is trained, the validation is done on what the data prep scaffold floe had returned false. These are the two ways to split the validation set:
For a hold-out based scaffold split: We hold out molecules that belong to a novel scaffold for validation and do not put them in training. If the evaluation metrics on the validation set are favorable, we know the model works on entirely different core structures than those in the training set, making it less likely to rely on overfitting to specific chemical features.
For an even distribution-based scaffold split: If your input dataset is small and you want to make sure the training set evaluates the entire range of chemical variety in the set, this option produces an even mix of the whole scaffold between training and validation.
The parameters accommodate the scaffold analysis options, as seen in Figure 7.
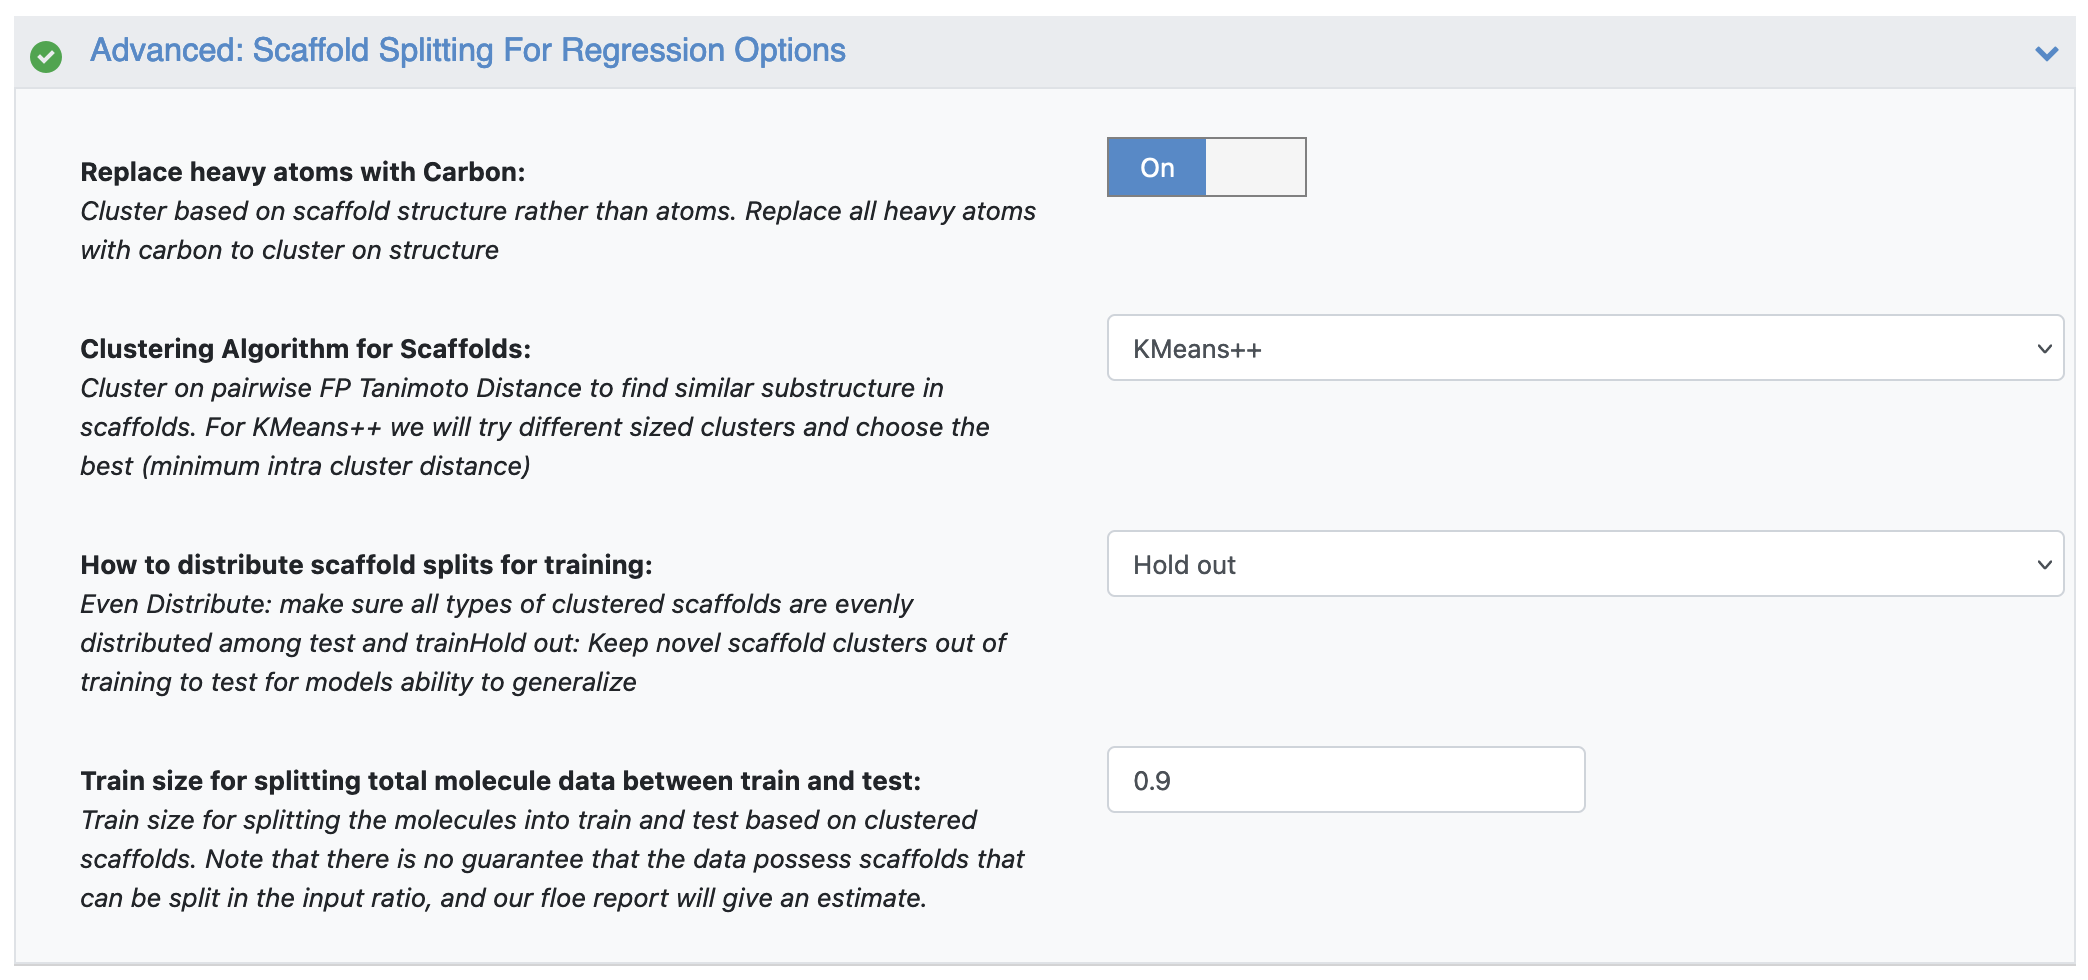
Figure 7. Parameters under the Advanced: Scaffold Splitting for Regression Options.
They affect the dataset in several ways.
Replace Heavy Atoms with Carbon: Heavy atoms are replaced with carbon and molecules are uncolored. The cluster is based on the scaffold structure rather than atoms.
Clustering Algorithm for Scaffolds: Clustering is done on the pairwise FP Tanimoto Distance to find similar substructures in scaffolds. Clustering and t-SNE statistics are presented for clustered scaffolds. For KMeans++, we try different sized clusters and choose the best based on the minimum intra-cluster distance.
How to Distribute Scaffold Splits for Training: Since the idea is to use scaffold-clustered data for machine learning, we attempt to split the input data by using either Even Distribute to evenly spread the clustered molecule scaffold among train and test, OR Hold Out to exclude novel scaffolds from testing to inspect model generalization.
Split Total Molecule Data between Test and Train: Split the molecules into X% train and (100-X%) test based on clustered scaffolds. Note that there is no guarantee that the data possess scaffolds that can be split in the input ratio. For the Hold Out option, there is no guarantee that scaffolds will have exactly (100-X%) of the data for the test split. We continue iteratively combining the smallest cluster or outlier scaffold with the next smallest cluster until it reaches approximately (100-X%) of the total data.
Optionally, if a good split is found, the floe will tag data as either scaffold train or test for the ML Build floes.
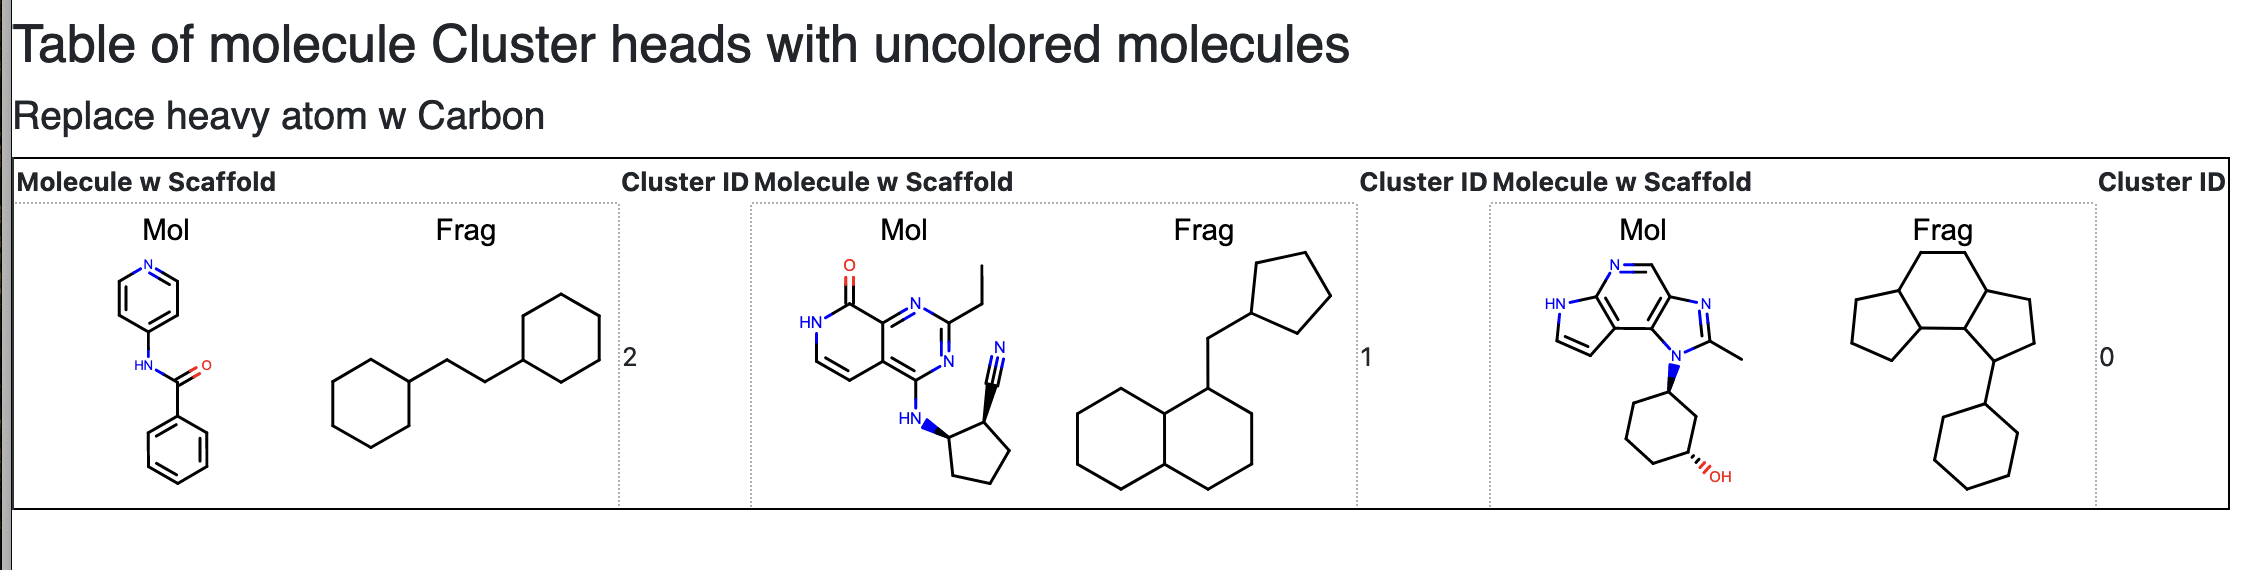
Figure 8. Cluster scaffolds after heavy atoms have been replaced by carbon.
In Figure 9, the Floe Report shows the types of core molecules found in the dataset. This is followed by a t-SNE plot of the core molecules. The 2D fingerprints of these cores are determined and the fingerprint distance is the input for the t-SNE plot, depicting if any spatial similarity exists between the core molecules. A histogram of the number of molecules in each core is also included. This shows the structural diversity of the input dataset.
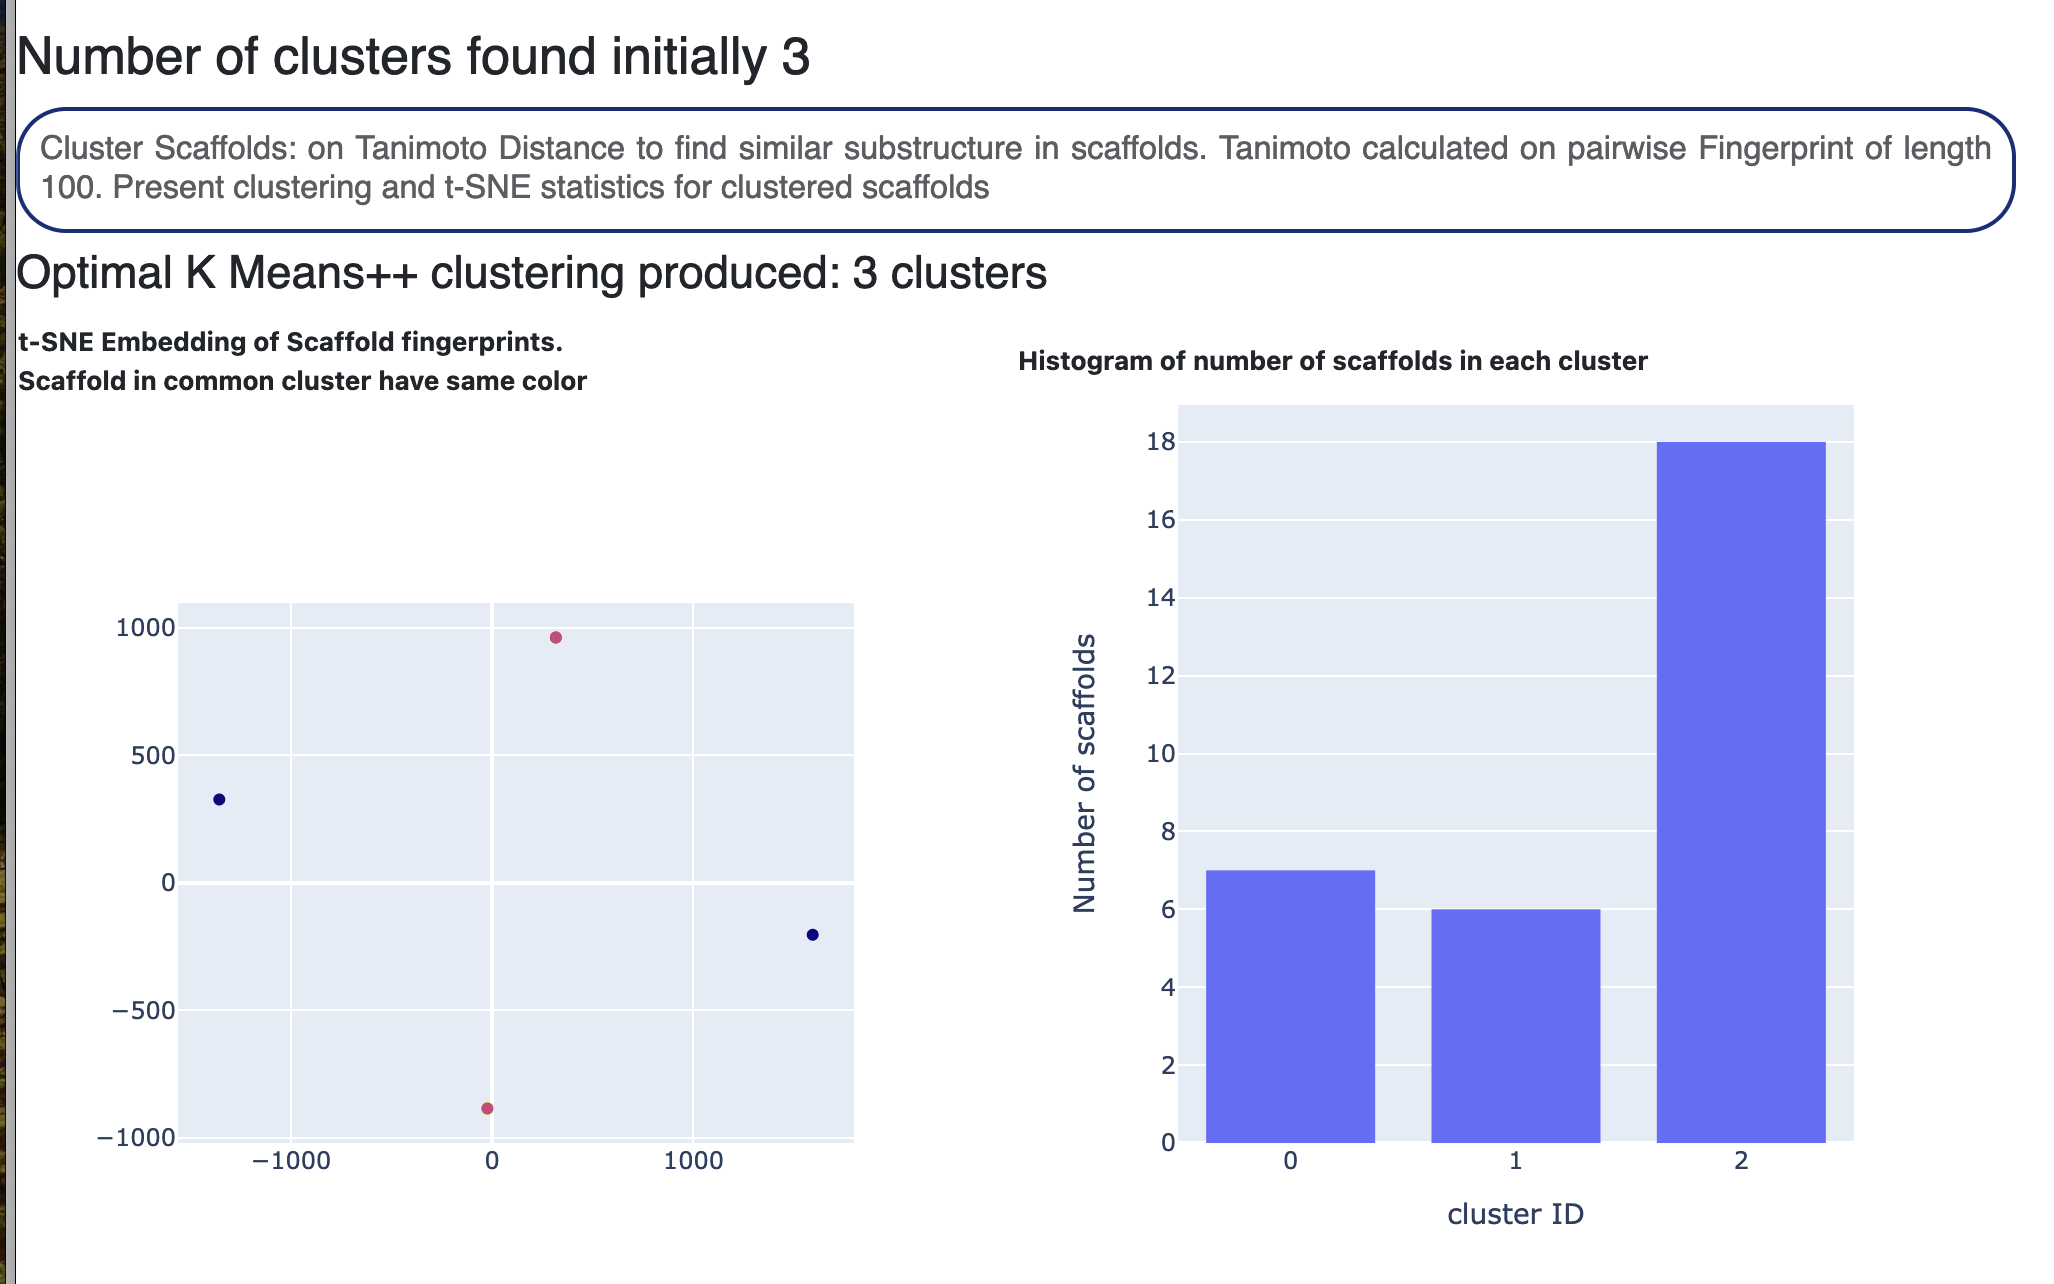
Figure 9. The Floe Report.
Finally, in Figure 10, we show some statistics on the split of molecules into train and test for our ML Build floes. We cluster the molecules based on either DBScan or Kmeans++, as chosen by the user. We report the average inter- and intra-pair distance between each core cluster. If the user chose Even Distribute for the clusters, we spread all members of each cluster between train and test. This will then build a model that has seen each type of scaffold, and therefore the training set captures the diversity of the data. For Hold Out, we continue merging the smallest clusters until a set big enough for test data size is reached. This test data is significantly different than the training in terms of core structural diversity. Models built using Hold Out show the ability to generalize it in the test metric. For this instance, we report how many data we were able to assign to the test set.
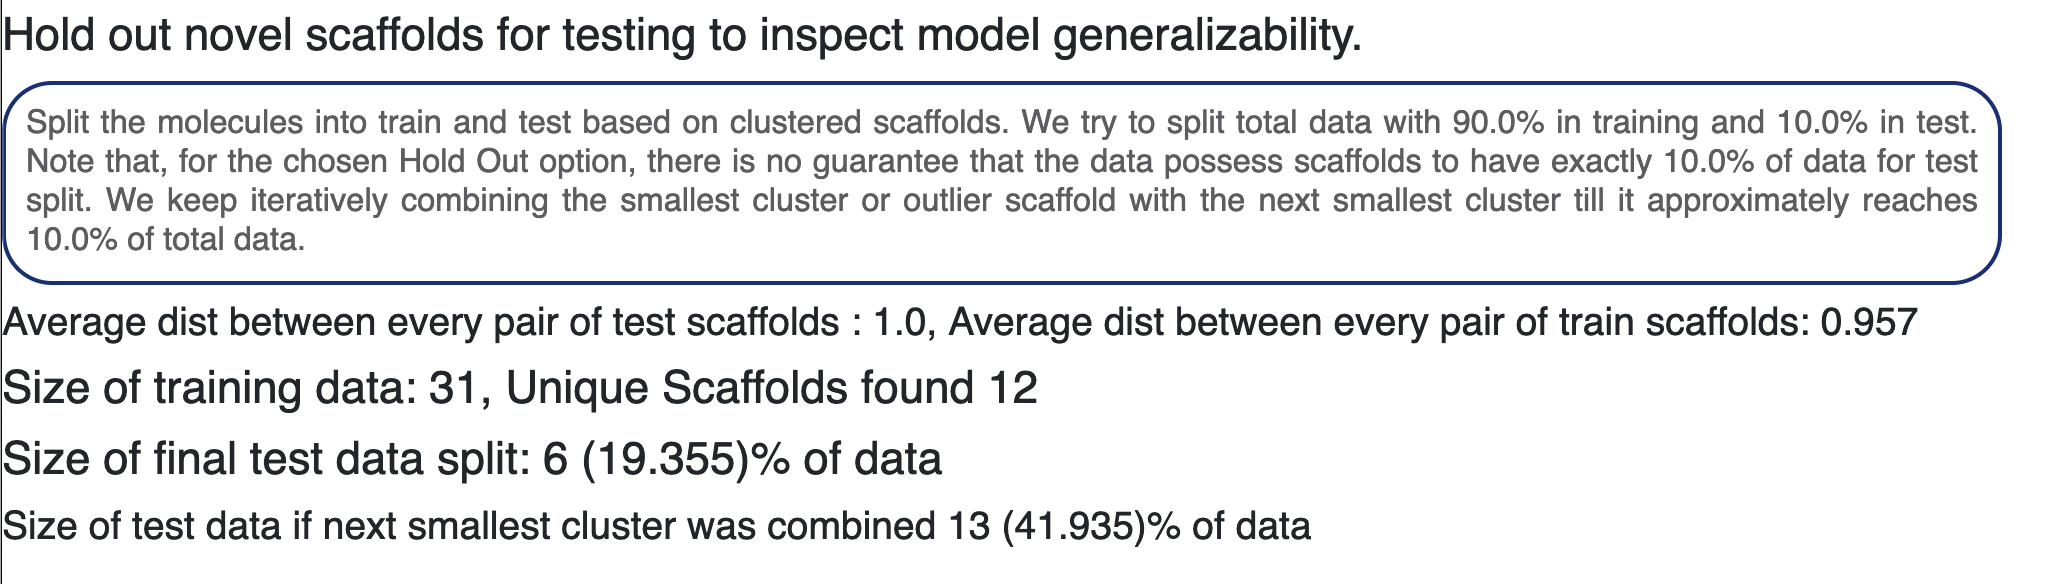
Figure 10. Statistics for splitting the molecules into test and train groups.