ML Predict: Regression using Feature Input Floe
In this tutorial, we will use a trained and fully connected neural network model to predict the physical properties of molecules. The model was trained on a feature vector provided by the user. This floe expects a feature vector of the same length as the training set to make predictions on. The floe predicts the properties of each molecule and explains them. It also generates confidence intervals and other information. The Floe Report provides a summary of the output.
This tutorial uses the following floe:
ML Predict: Regression using Feature Input
It is suggested to read the previous tutorial to learn how to build a machine learning model to use for prediction.
Note
If you need to create a tutorial project, please see the Setup Directions for the Machine Learning Model Building Tutorials.
Floe Input
The inputs required for this floe are:
Molecule Dataset (P1)
Tensorflow Machine Learning Custom Feature Input Regression Model Dataset (M1)
The P1 dataset contains several OERecords. The floe expects from each record:
An OEMol, which is the molecule whose physical properties the model will predict.
A FloatVec field for every record. The length of these FloatVec fields needs to be the same. For CSV files, you can convert comma-separated Float values in a single column to such FloatVec values. Orion automatically converts CSVs to data records you uploaded.
Here is a sample record from the dataset:
OERecord (
    *Molecule(Chem.Mol)* : c1cc(c(nc1)N2CCC(CC2)NC(=O)c3cc(c([nH]3)Cl)Cl)[N+](=O)[O-]
    *Feature(FloatVec)*: 25, 1.26, 2, 0.33, 4, 2, 1, 0, 0, 4, 104.15
)
There can be another Float field containing the physical property values to validate against. The following dataset does not contain said field.
Input Data
The M1 dataset contains one or more machine learning models. To learn how to generate these models, read the previous tutorial on building models in Orion. You can download a sample trained Tensorflow Model to predict IC50 below.
Input Machine Learning Models
Run a Generic Property Prediction Floe
Choose the ML Predict: Regression using Feature Input Floe. Click “Launch Floe” to bring up the Job Form. The parameters can be specified as below.
Input Small Molecule Dataset: Choose P1 from above.
Input Tensorflow Model: Select M1 from above or your own dataset. Make sure you set the Model ID of which Tensorflow Model to Use to Predict to 1.
Output Property for Feature-based Regression: All the molecules predicted will be saved to this file. Change it to a name you will recognize.
Figure 1. Floe description of the ML Predict: Regression using Feature Input Floe.
Model ID of Which Tensorflow Model to Use to Predict: Identify the model ID to use to predict the properties of your molecules. You can go to the Analyze page for the model dataset to find the ID of the model you want to base the predictions on. You can find more information on how to select this model in the How-to Guide: Use built machine learning model for property prediction/verification of unseen molecules.
Preprocess Molecule: We recommend using the same value that was used for training.
Number of features to explain: The model agnostic explainer lists which features from our input vector play a significant role in predicting the Response Value field. This parameter adjusts how many top features we want to see. Of course, the maximum length of this field should be <= the length of our input feature vector (11 in this case). We recommend keeping the number below 10 (that is, show the top 10 most significant feature votes), as the explainer diagrams get difficult to interpret if there is too much data.
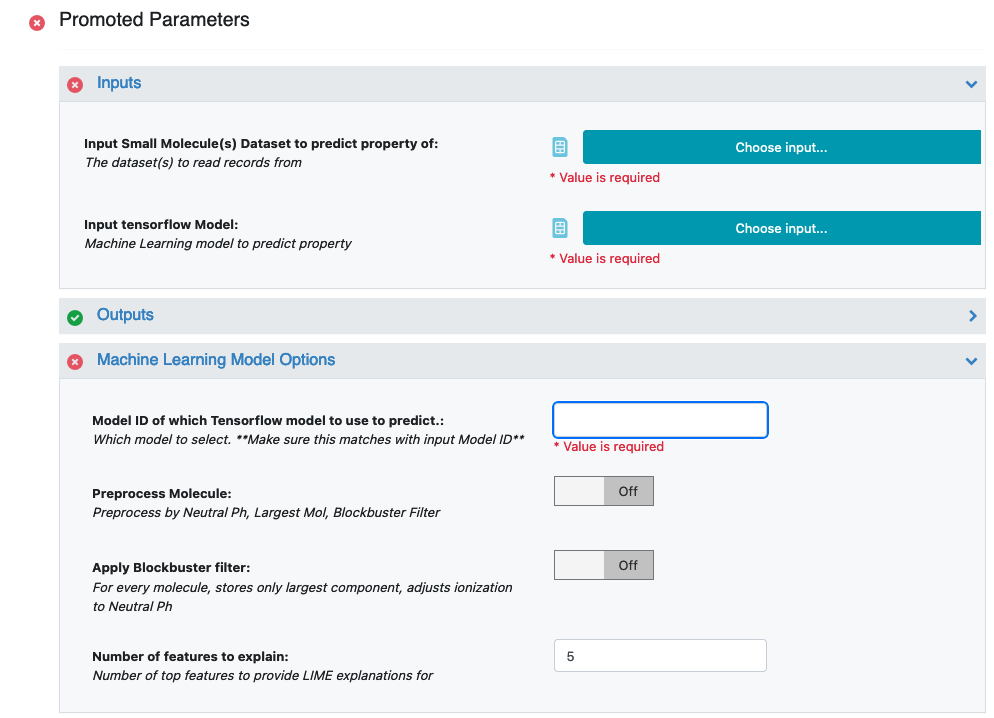
Figure 2. Promoted parameters.
Custom Feature: Choose Feature. This is the feature vector that the ML model was trained on, and the input on which property of P1 will be predicted.
Property Validation Field: If your small molecule dataset has a field containing the predicted value (sourced from elsewhere), you can turn the validation option on to get a statistical comparison between this value and the prediction.
That’s it! Let’s run the floe. Click the “Start Job” button.
Analyze OEModel Floe Report
Here is a sample image of the Floe Report (assuming you ran a fully connected neural network model like M1).
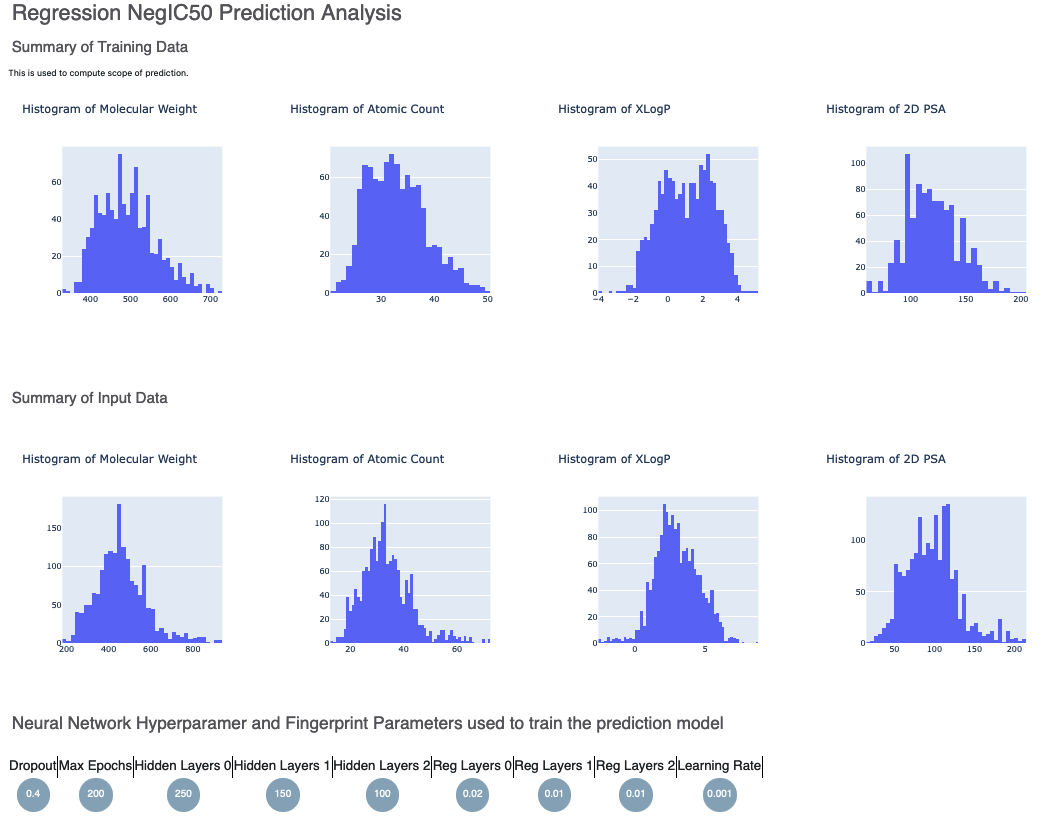
Figure 3. Histograms for the statistics of the input data.
Figure 3 shows histograms that summarize statistics on the whole input data. Next, in Figure 4, is the histogram of the output prediction. We Also have the parameters the model was trained on. These statistics help analyze the input molecules predicted.
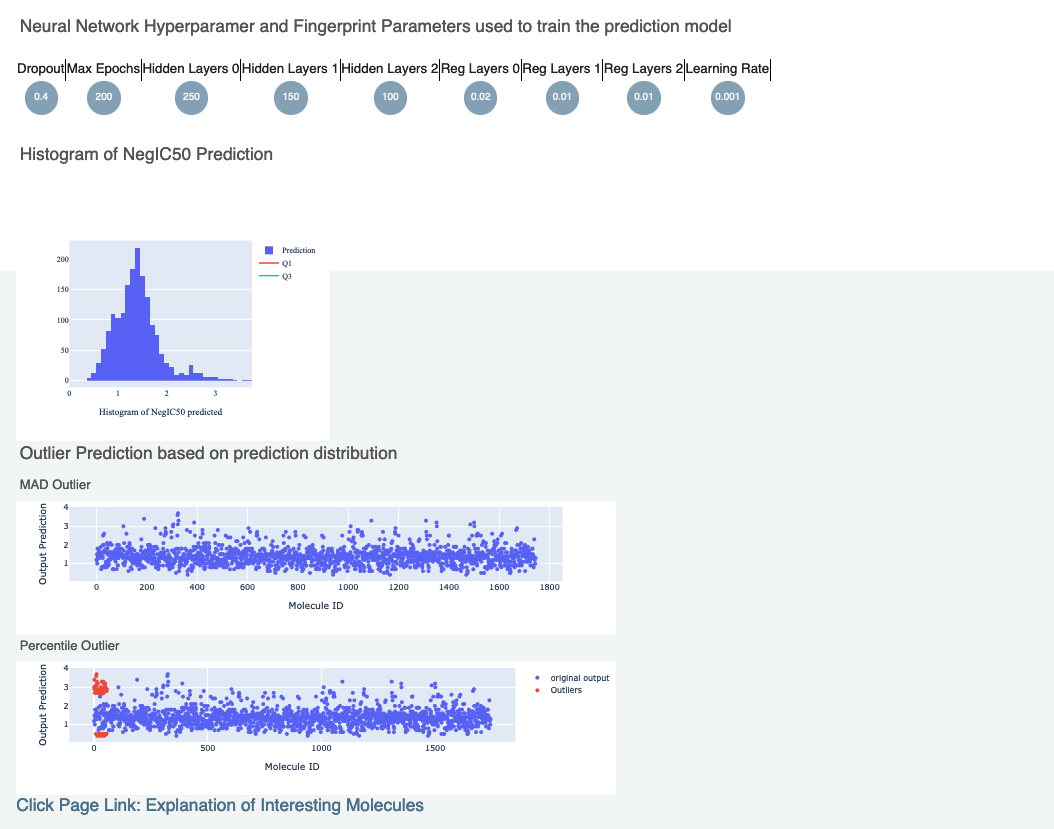
Figure 4. Output prediction, training hyperparameters, and outlier predictions.
Figure 4 also includes outlier prediction using:
MAD Technique: Median of Absolute Deviation
Percentile Technique: Percentile Outlier
Finally, there is a link to a page under Interesting Molecules that shows the annotated images which explain the outlier and central molecules.
Analyze Output
On the Data page, activate the data that the floe produced. This should have the same name you chose for the Output Prediction field of your Floe. The data can be activated by clicking on the circle with a plus sign.
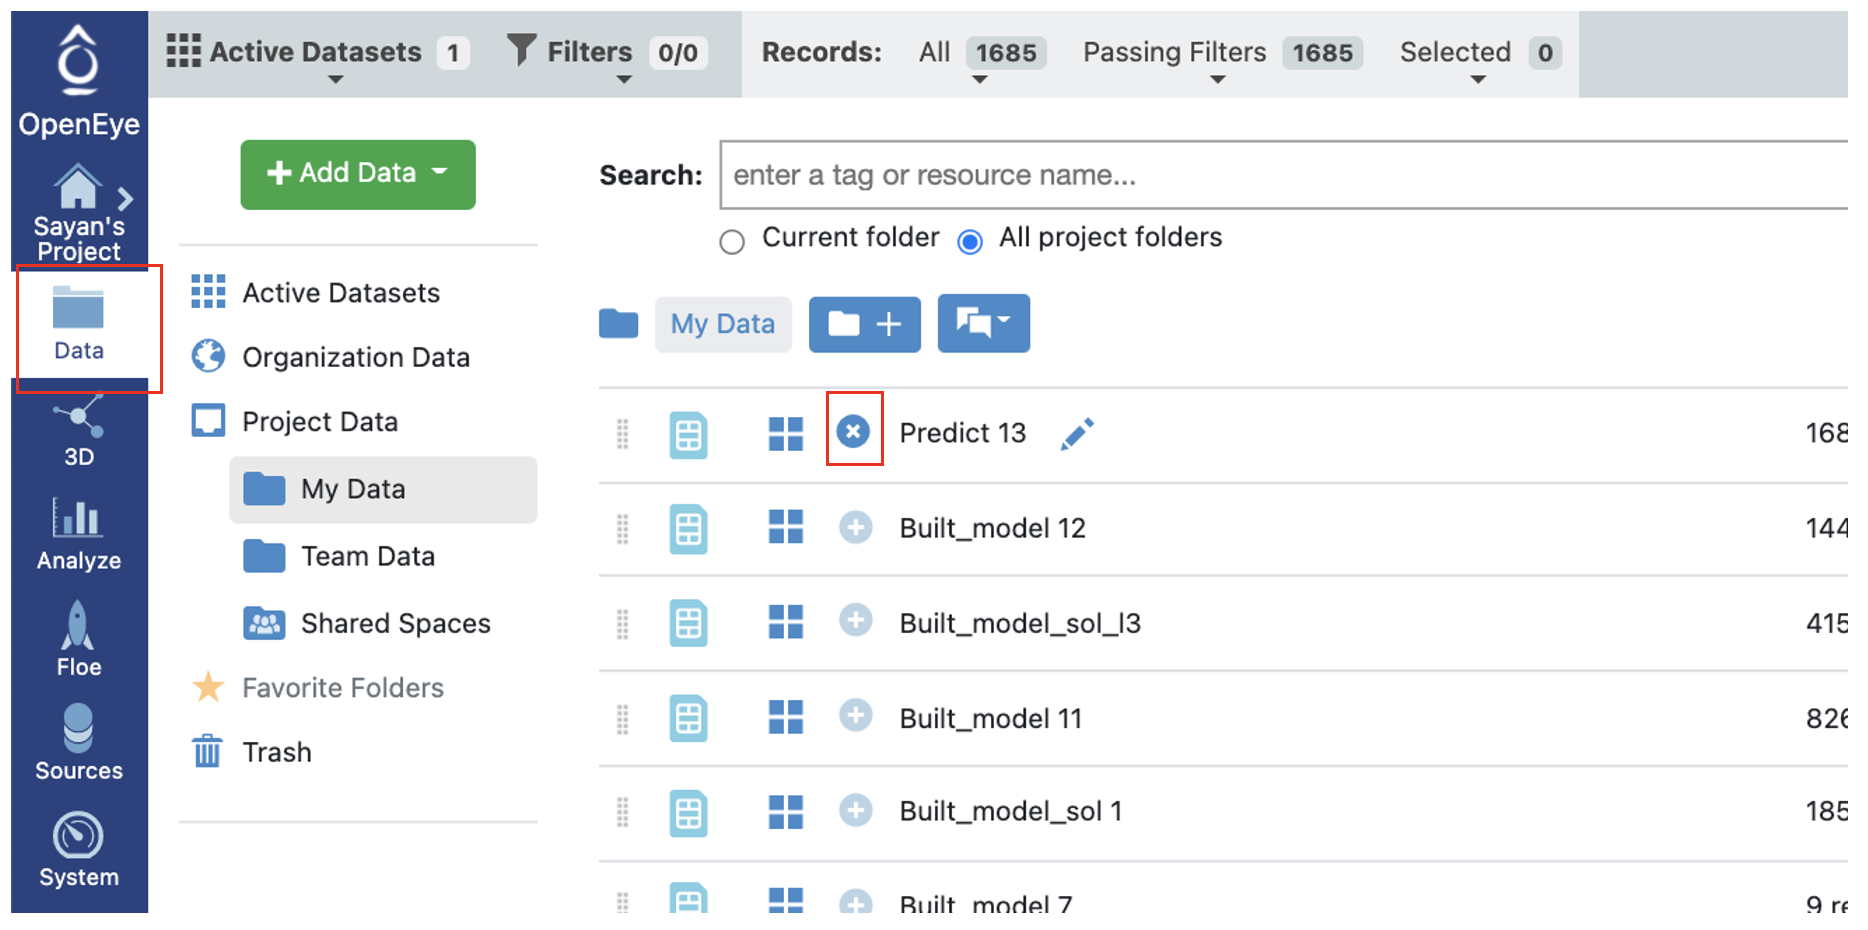
Figure 5. Activate a dataset on the Data page.
On the Analyze page, you should be able to see the molecules, their predicted pyrrolamide values, and the explanation of the output. Note that, unlike fingerprints, we cannot map features back to molecules, so our explainer now is a graph listing the top features which factored most strongly in the prediction. The x-axis count of this plot can be altered by adjusting the Number of Features to Explain parameter.
There are three output ports: Success, Failure, and No Confidence.
Output Meanings
Failure Data: Either the molecule is too large or too small, or the molecule has an unknown atom.
No Confidence Data: The molecule’s property falls out of scope of training set. In this case, the model predicts with no guarantees. The explainer image has a red background.
Success Data: If the molecule falls within scope, the explainer has a green background. If the molecule falls at the edge of the scope, the explainer has a yellow background.
The output columns in the spreadsheet are described below.
Class Confidence (Property Unit): High, Medium or Low confidence in prediction.
Class Prediction (Property Unit): High, Medium or Low prediction of property. This depends on whether the value lies within <25% (low prediction), >75% (high prediction), or in between.
Contributions: The explanation of prediction is based on a local model. Unlike fingerprints, we cannot map features back to molecules, so our explainer now is a graph listing the top features which factored most strongly in the prediction. The x-axis count of this plot can be altered by adjusting the Number of Features to Explain parameter.
Scope: If there is an error or warning, this will state what caused the issue.
Prediction (Property Unit): The physical property prediction of the molecule.
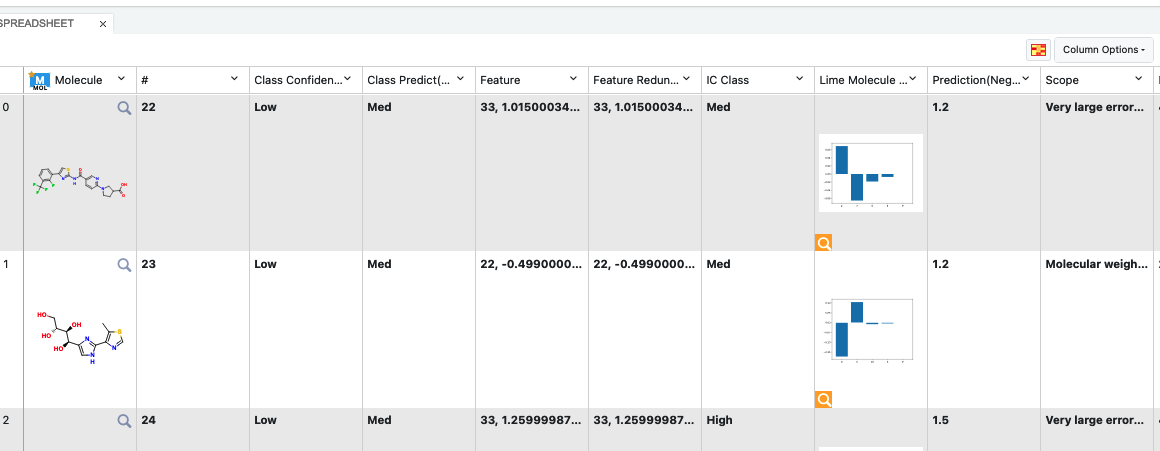
Figure 6. Output columns of the spreadsheet on the Analyze page.
Note
We assign ID numbers for each molecule. This follows a linear ordering over all molecules. So, if you activate all the successful, no confidence, and failure predictions, and sort them based on ID number, the order should be same as the input.