Predict the Solubility of Small Molecules
In this tutorial, we will use the solubility floe to predict molecule solubility in log(μM). The floe predicts the solubility of each molecule and explains the prediction based on chemical moiety. It also gives confidence intervals and other insightful information. The Floe Report provides a summary of the output.
Note: All other pretrained floes to predict molecule properties work the same way.
This tutorial uses the following floe:
Solubility Prediction for Small Molecules using ML and Cheminfo Fingerprints
Note
If you need to create a tutorial project, please see the Setup Directions for the Machine Learning Model Building Tutorials.
Floe Input
The input dataset P1 contains several OERecords. The floe expects an OEMol from each record. These are the molecules for which the model will predict solubility. Note: uploading .csv, .sdf and other common file formats to Orion should automatically convert them to datasets.
Here is a sample record from the dataset:
OERecord (
    Molecule(Chem.Mol) : c1ccc(c(c1)NC(=O)N)OC[C@H](CN2CCC3(CC2)Cc4cc(ccc4O3)Cl)O
)
There can be another Float field containing solubility values to validate against. The following dataset does not contain said field.
Input Data
Run OEModel-Apply Floe
Choose the Solubility Prediction for Small Molecules using ML and Cheminfo Fingerprints Floe. Click “Launch Floe” to bring up the Job Form. The parameters can be specified as below.
Input Small Molecule Dataset for Prediction: Choose P1 from above.
Output Solubility: All the molecules predicted will be saved to this file. Change it to a name you will recognize.
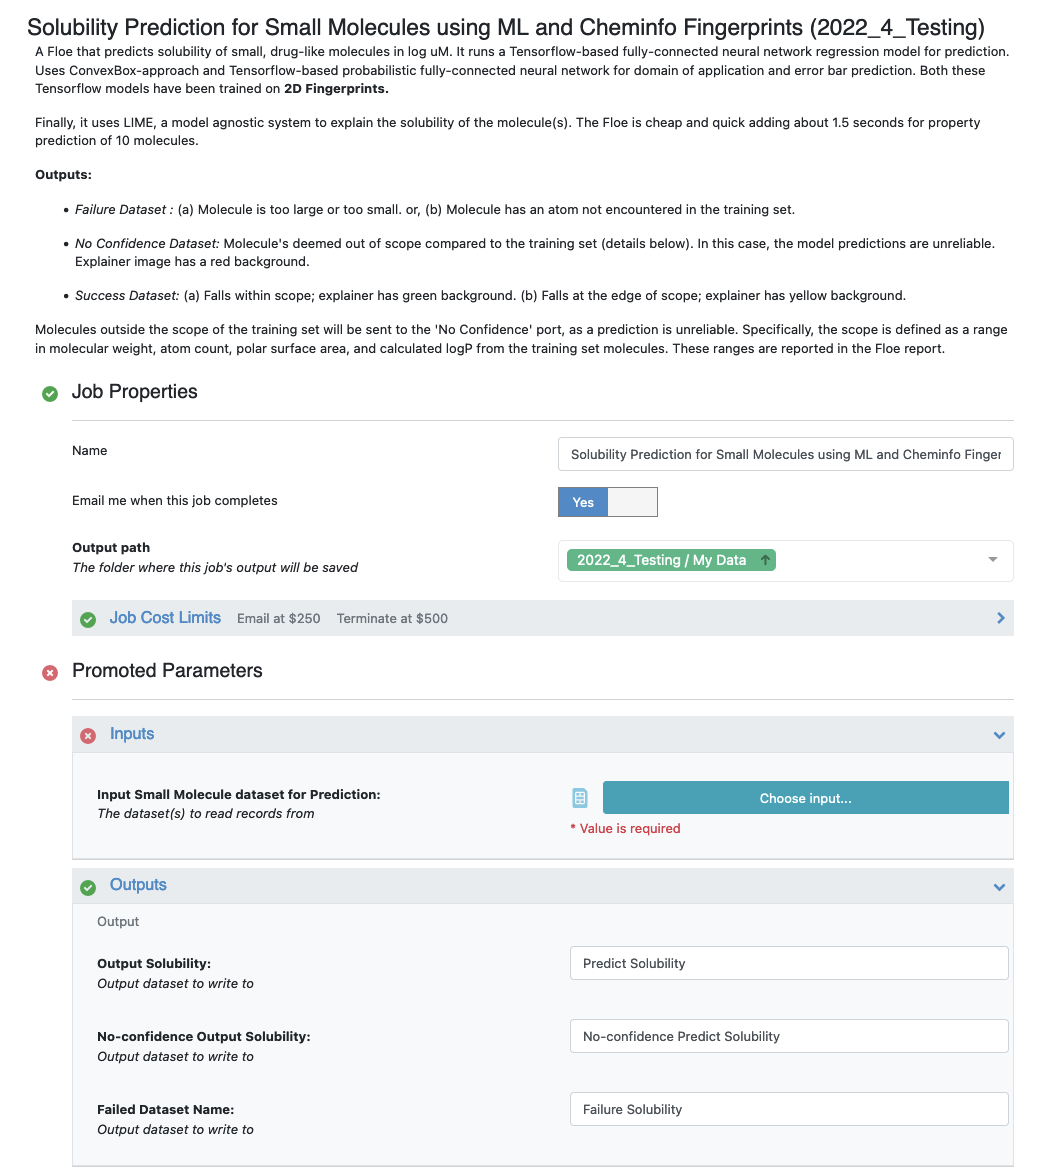
Figure 1. The Job Form.
That’s it! Let’s run the floe. Click the “Start Job” button.
Analyze OEModel Floe Report
Here is an image of the expected Floe Report.
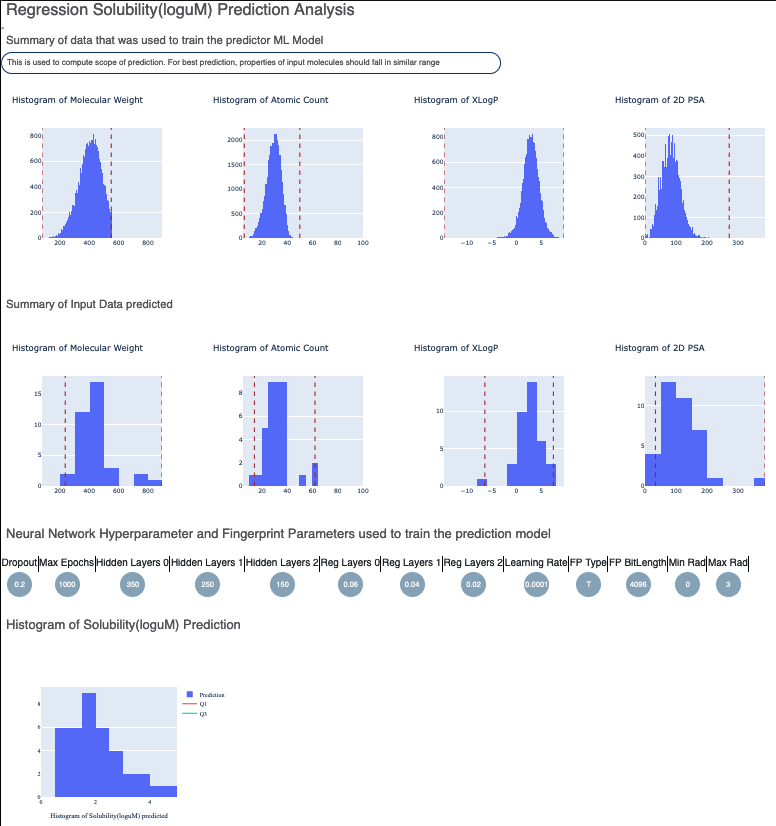
Figure 2. Summary of prediction data.
The results contain the histogram summary of the data used to train the solubility ML model. The red dotted lines illustrate the upper and lower quartile. This includes a histogram summary of the input prediction data P1. It is worthwhile to compare the x-axis ranges of the training and prediction data. If they are largely different, the prediction quality may deteriorate.
Figure 2 includes the hyperparameters of the neural network the solubility model was trained on. Next you can see a histogram of the output prediction and one for the confidence of each prediction. Finally, there is a plot of the confidence versus the actual output prediction. These overall statistics help analyze predictions for the input molecules.
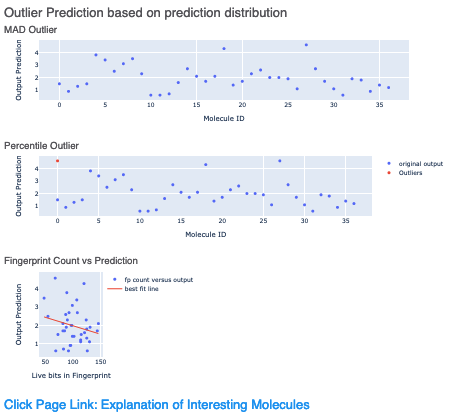
Figure 3. Outlier prediction plots.
The following outlier predictions are included in Figure 3.
MAD Technique: Median of Absolute Deviation
Percentile Technique: Percentile Outlier
A plot for the number of active (1) fingerprint bits versus the solubility to determine if a correlation exists.
The final item on the Floe Report is a link to Interesting Molecules with annotated explainers.
Analyze Output
On the Data page, activate the data that the floe produced. This should have the same name you chose for the Output Solubility field of your floe. The data can be activated by clicking on the circle with a plus sign.
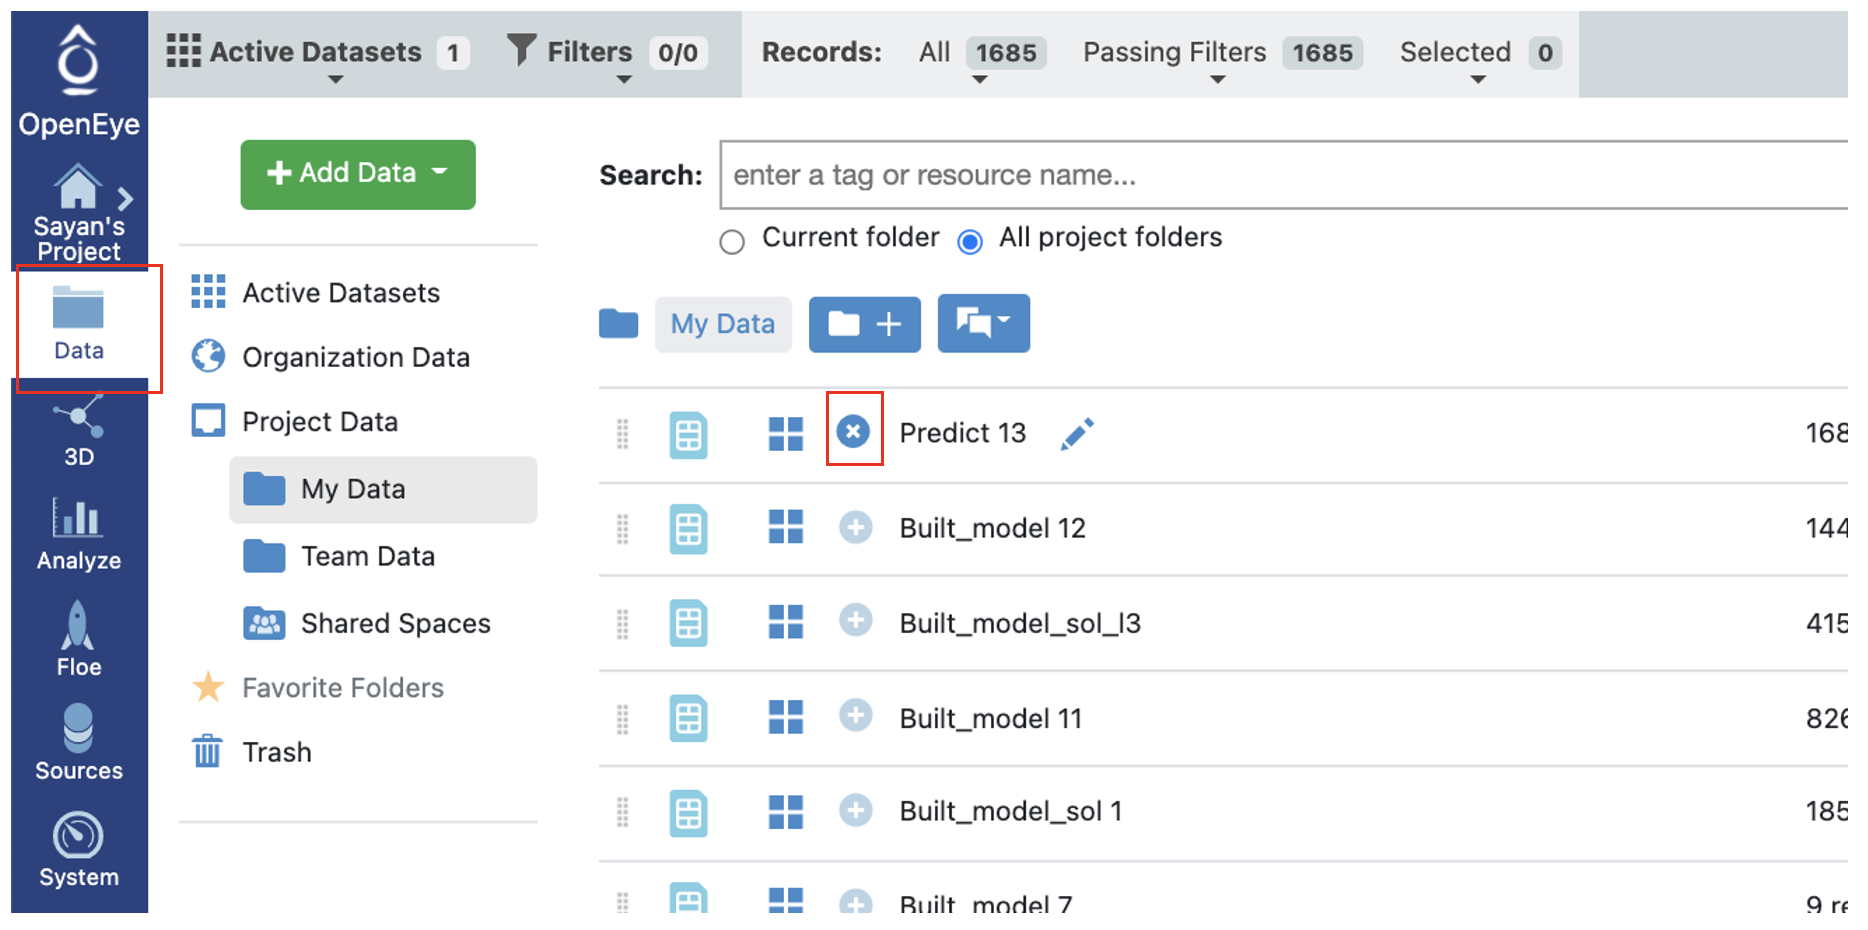
Figure 4. Activate the dataset.
In the Spreadsheet Panel on the Analyze page, you can see the molecules, their predicted solubility values, and the explanation of the output.
Output Columns and Explanations
Confidence (Solubility logμM): How confident the model is with its prediction on a scale of 0–1.
Contributions (Solubility logμM): Explanation of the prediction based on a local model. If the image has a red or yellow background, it means there is an error or warning issued. Based on the choice of molecule explainer (fragment by default), different parts will be color-annotated, with blue denoting more solubility and red denoting the opposite.
Highest Tanimoto Similarity: The highest 2D Tanimoto similarity with any molecule in the training set.
Highest Similar Property Value: The highest NegIC50 of that training set molecule on record.
These two fields tell us if there is a similar molecule in the training set, and if so, its solubility value.
Scope: If there is an error or warning, this will state what caused the issue.
Class Predict (Solubility logμM): Predicts the property as High, Medium or Low. The background color suggests how confident the model is, with green (most confidence), yellow (average confidence), and red (least confidence or out of scope).
Prediction (Solubility logμM): Prediction of the solubility of the molecule in loguM.
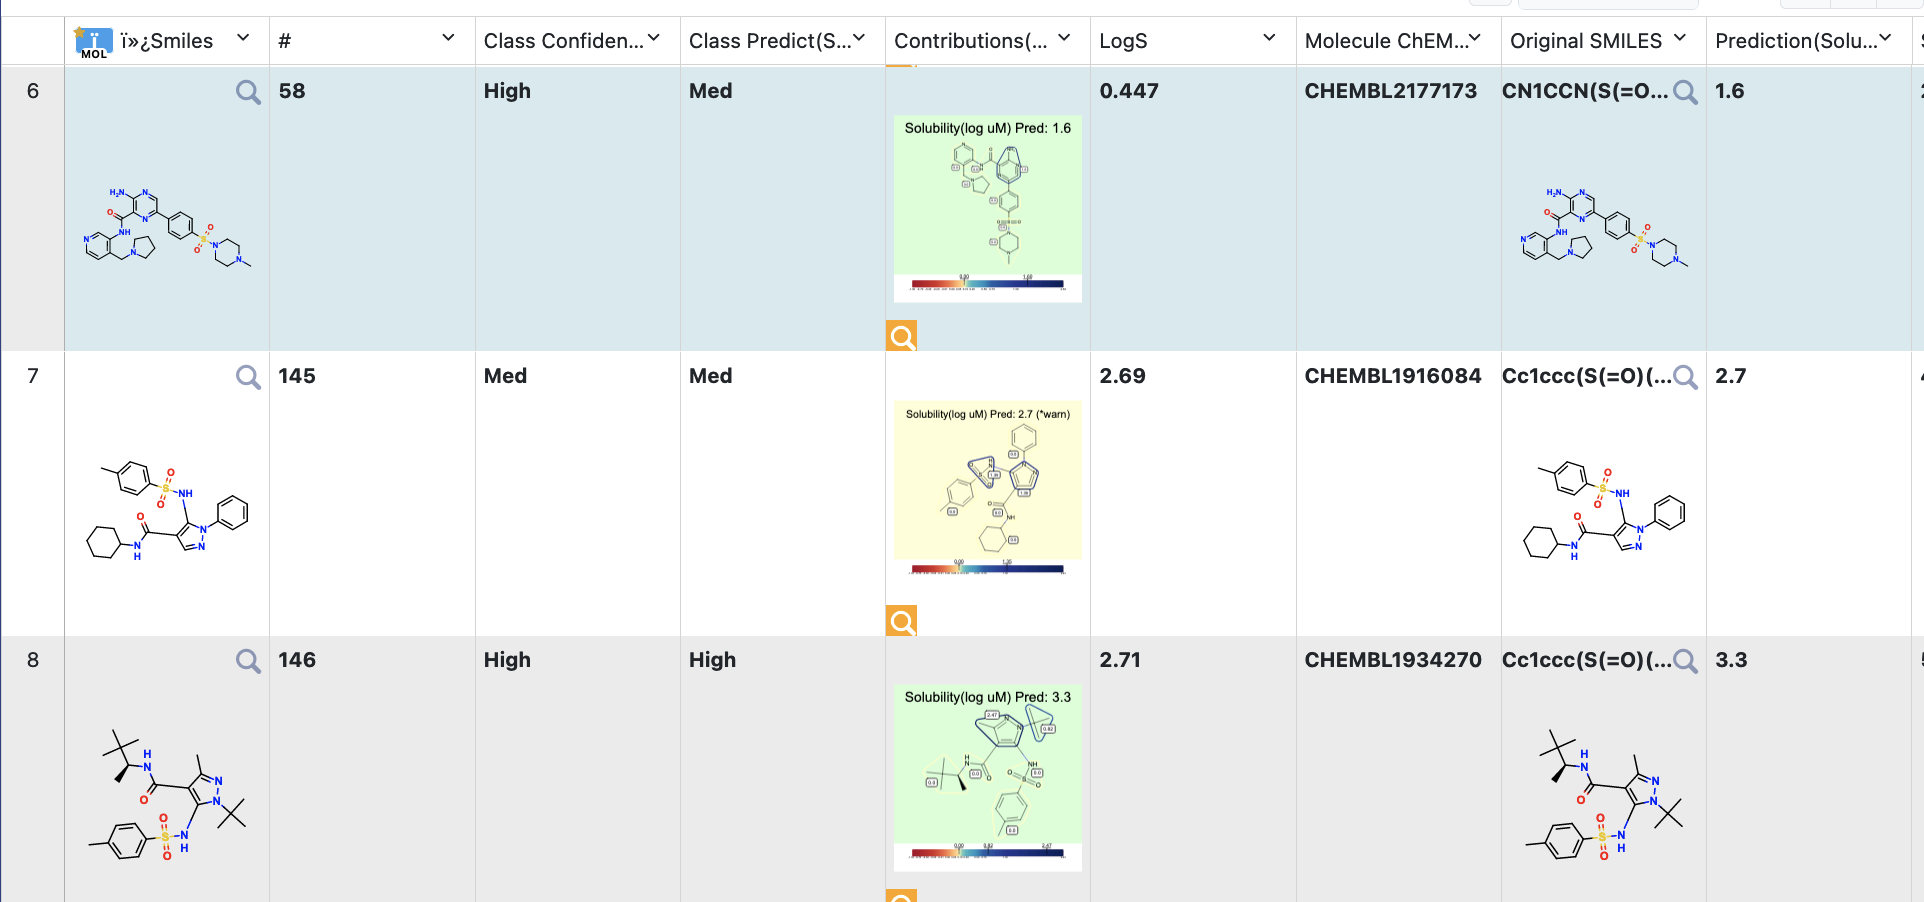
Figure 5. Spreadsheet of the output data.
Note
We assign ID numbers to each record molecule. This follows a linear ordering over all molecules. So, if you activate both the successful and failure predictions and sort them by number, the order should be the same as for the input.