Structured Water Analysis
Why You Need Water Analysis
Water is important in protein-ligand binding. It can mediate indirect interactions between protein and ligand and create networks to stabilize the binding. Identifying water locations in the binding site provides insights into which waters can be targeted for displacement or interaction. Some water molecules might be trapped in the ligand binding area. If this ligand is mutated to another ligand, the trapped water could cause clashes, leading to inaccurate results in nonequilibrium switching. Furthermore, if you already have molecular dynamics simulations with explicit solvents, this tool allows you to revisit previous runs and extract valuable water information.
This water analysis tool is embedded within the Short Trajectory MD with Analysis Floe (STMD) and Analyze Protein-Ligand MD Floe (APLMD), and can be utilized in two ways:
Run the STMD Floe from the start to include water analysis in your workflow.
Use an existing MD output and simply run the Analyze Protein-Ligand MD Floe to perform water analysis.
Results and Benefits of Using This Tool
By running this water analysis, you will get:
Structured water information if any structured water is identified.
How the water molecules are structured throughout the entire simulation.
Which atoms the water molecules interact with and the occupancy of these interactions.
2D Floe Report Image and Table
After running the analysis, you can find the 2D interaction figure for each ligand at the top of its respective Floe Report. This figure shows the interactions between the ligand and the protein, as well as between the ligand and water molecules. It’s important to note that only the water molecules that form ideal H-bond interactions with the ligand above 5% will be shown in the 2D interaction figure.
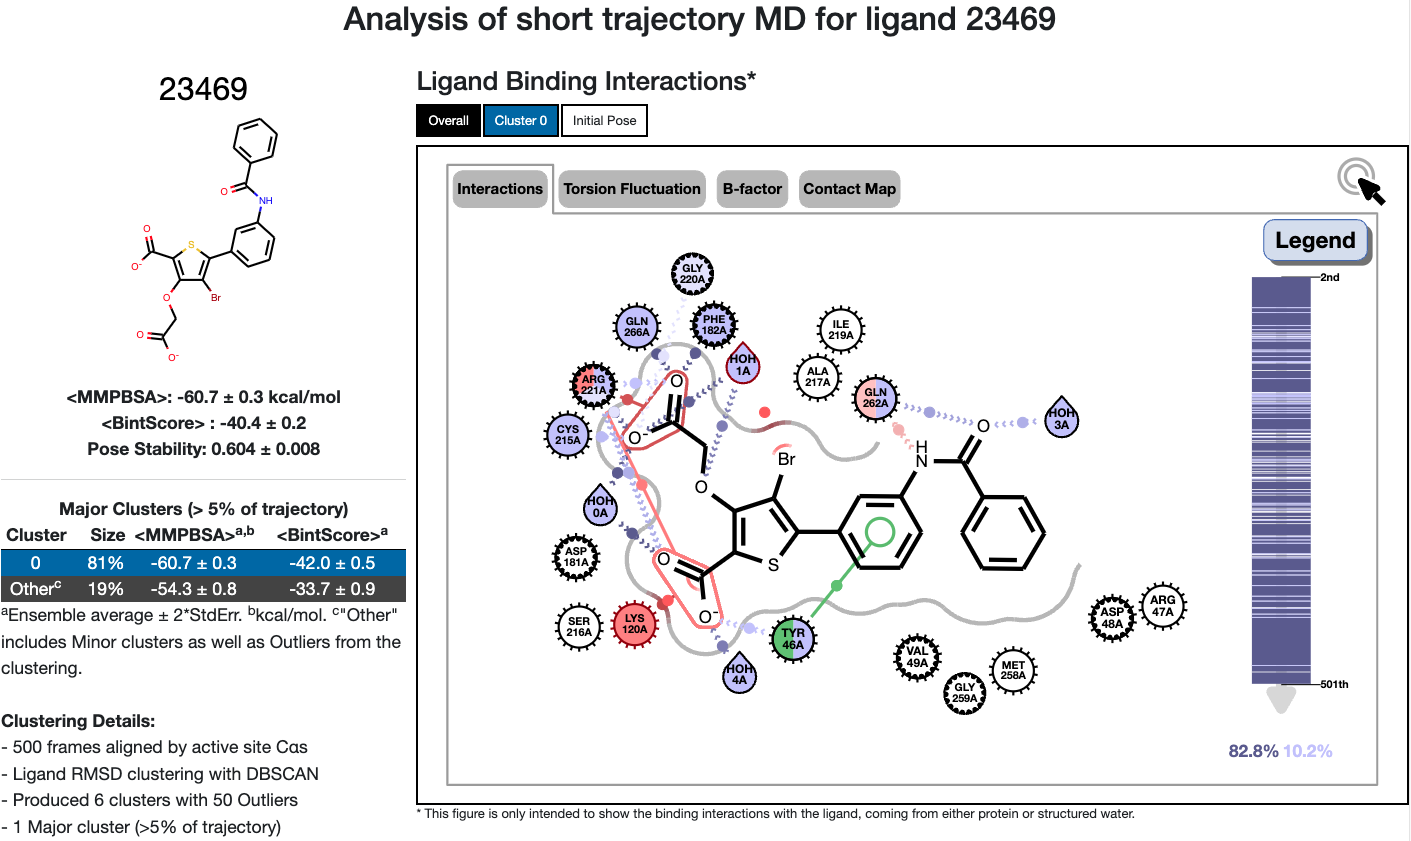
Figure 1. Top portion of the STMD Floe Report.
Right after the 2D interaction figure, there is a table reporting interactions that form both from water and ligand, as well as water and protein based on the full trajectory.
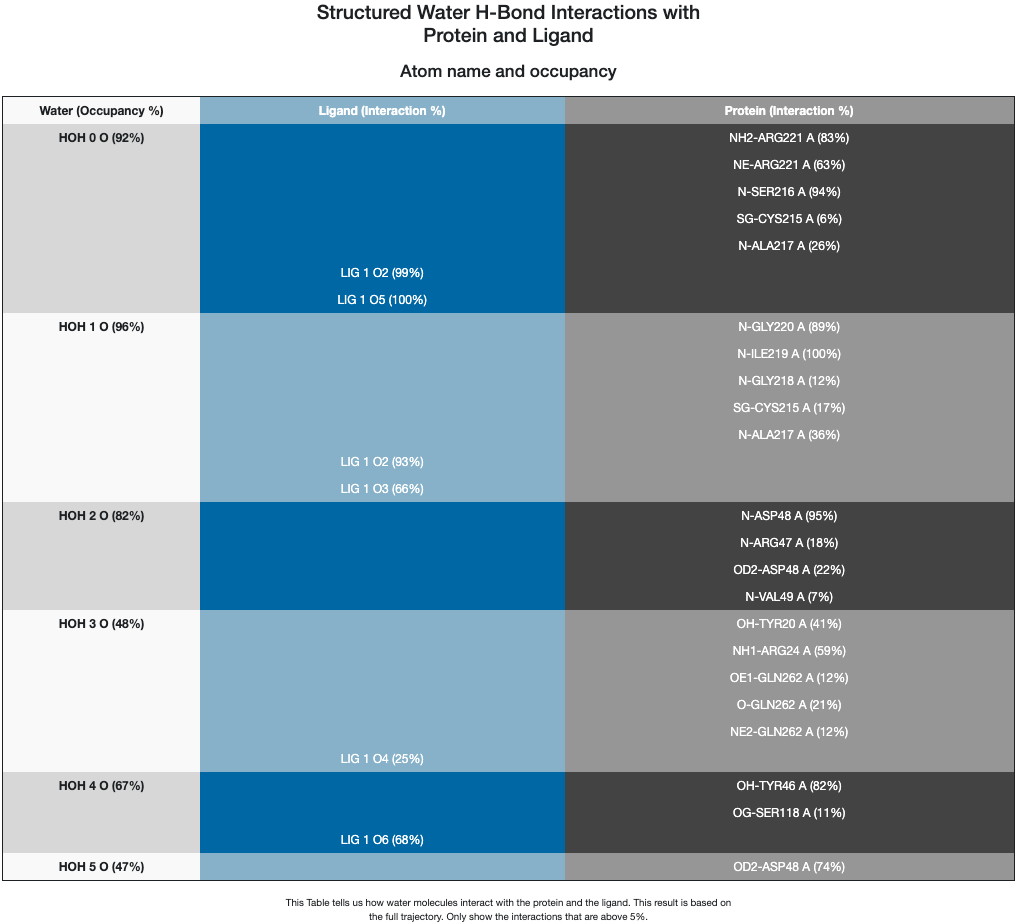
Figure 2. 2D Floe Report interaction table.
3D Viewer: How to Turn on & What It Shows
On the 3D page, water sites are saved in the Average conformer (ligandID_clusID_Avg, e.g. 23469_clus0_Avg) field in the OEDU and tagged as solvent. They can be turned on/off by clicking the “S” button. The default color setting is based on the water site occupancy and labeled according to the water site ID reported in the Floe Report along with its occupancy. This can be modified by clicking the “Pencil” icon to remove. The water site ID numbers are conserved across the 3D Viewer, the 2D interaction image within the Floe Report, and the interaction table in the Floe Report.
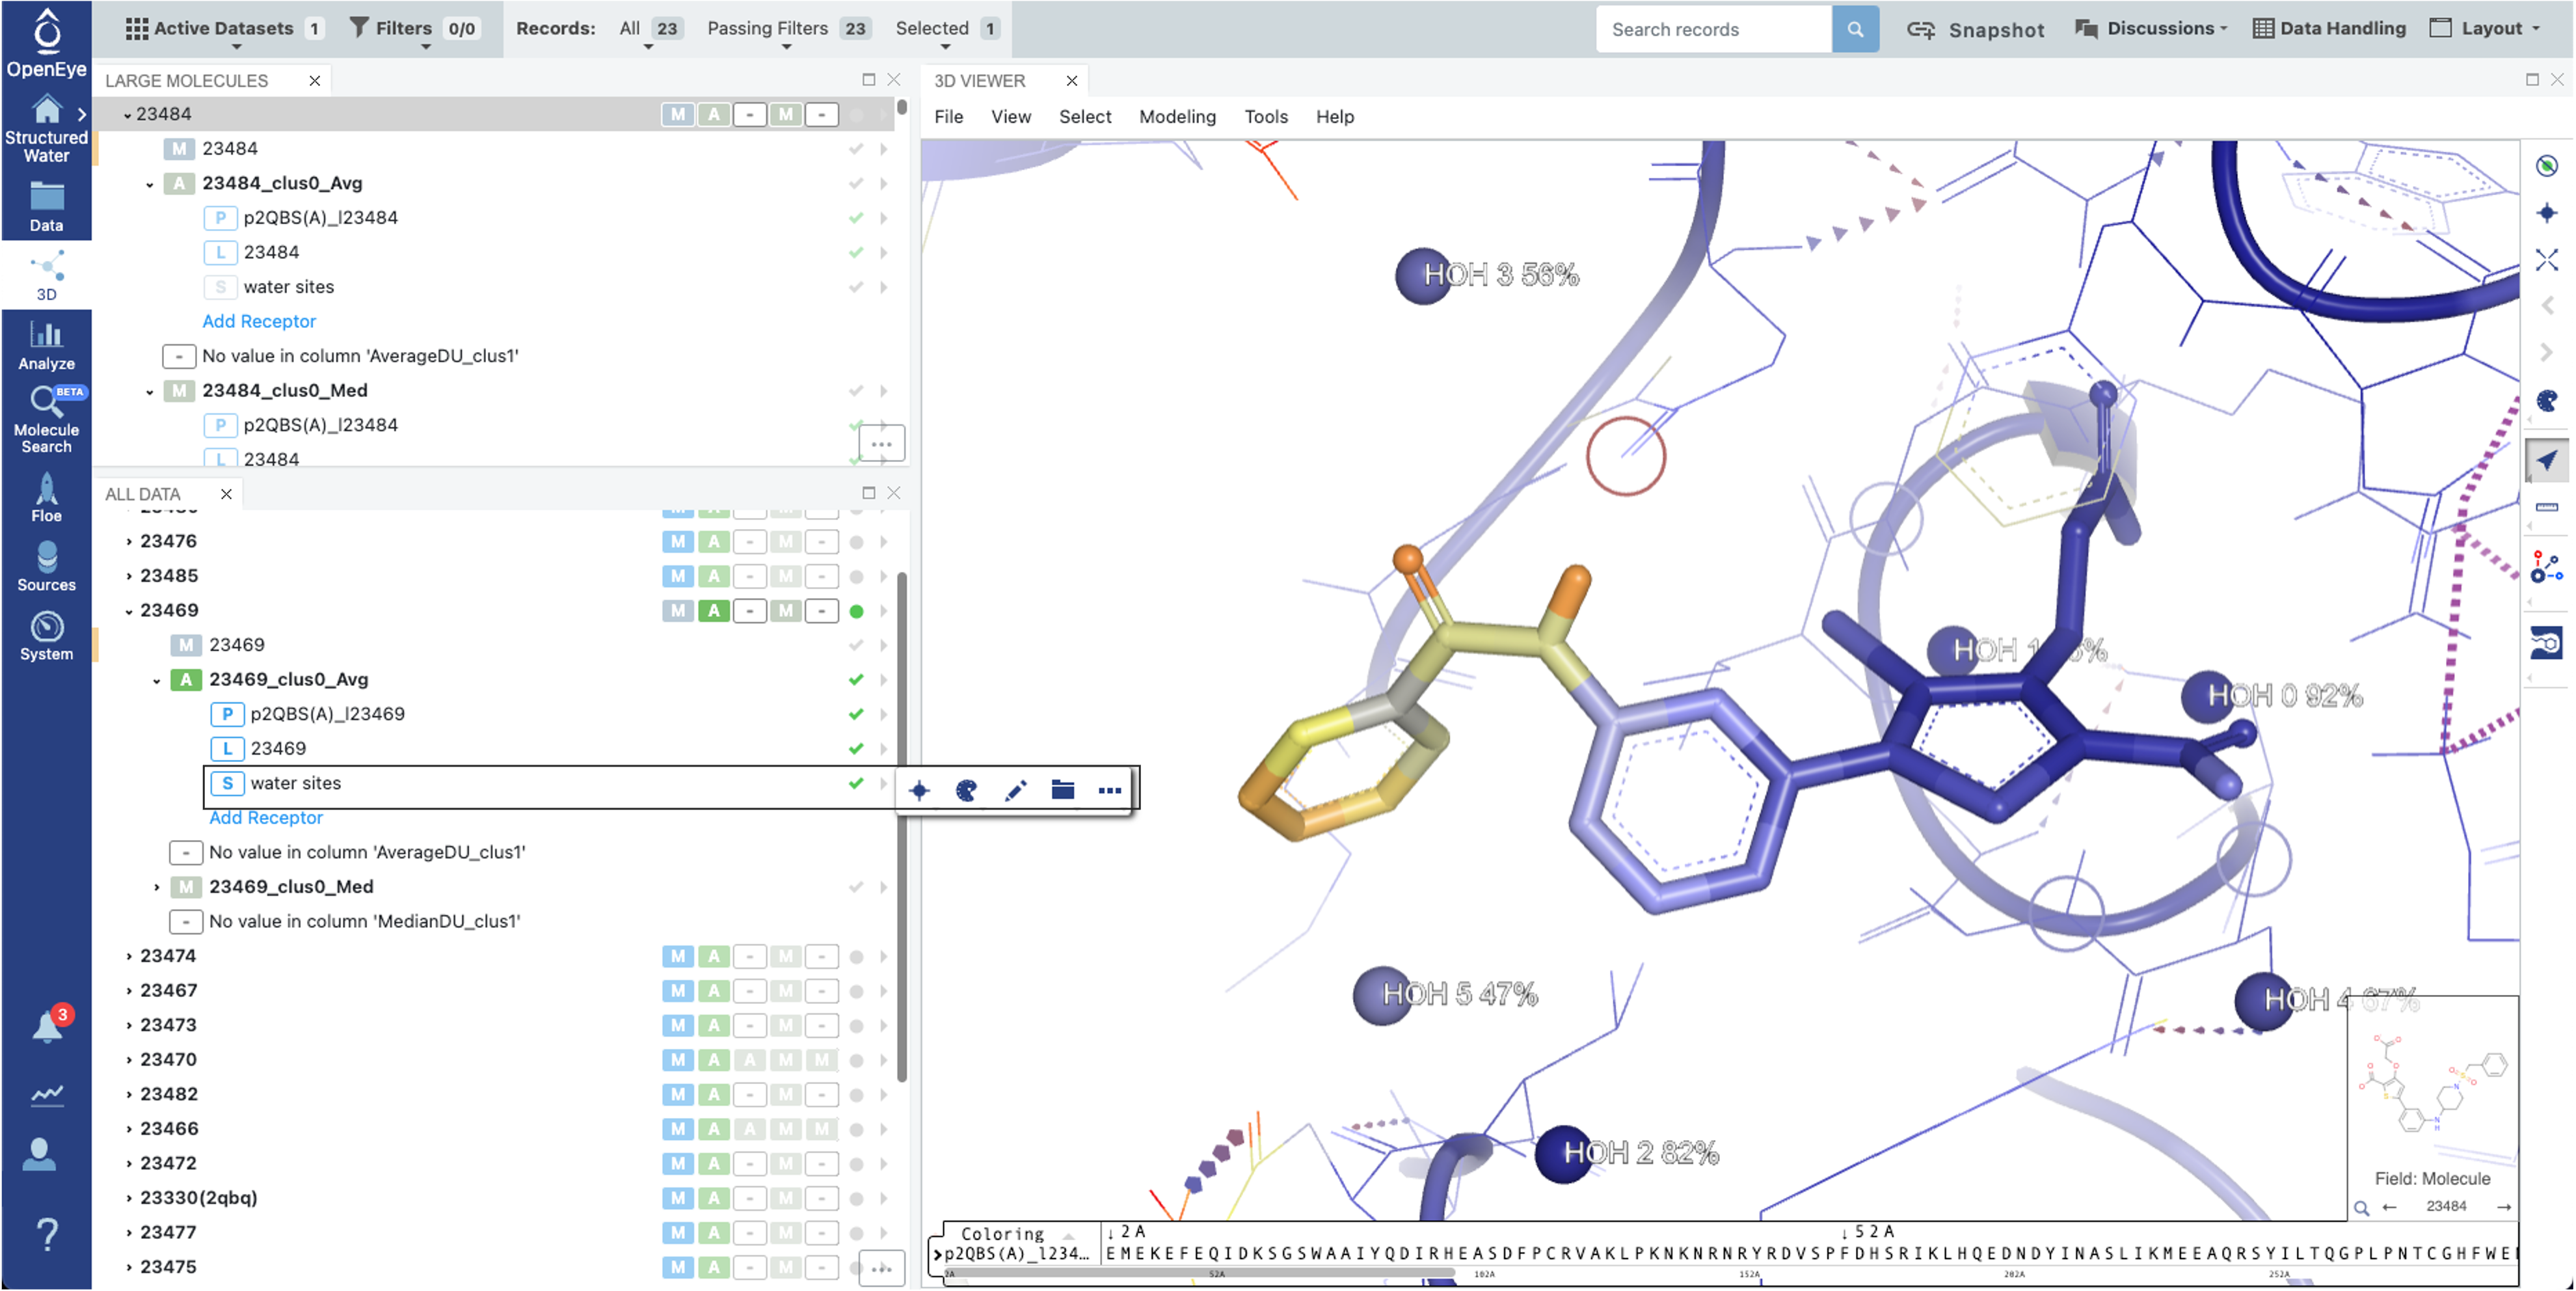
Figure 3. 3D page Viewer.
Running the Analysis: Step-by-Step Guide
The Job Form is the same for both the APLMD and STMD Floes. At the bottom of the form, set the “Show Cube Parameters” toggle to “Yes.” In the Traj to OEMol Cube the Process Water parameter controls whether water analysis is performed. By default, it’s On. When enabled, water analysis will increase the computational cost by approximately 45% for the APLMD Floe compared to running the analysis without it, and by 20% for the STMD Floe under the same condition.
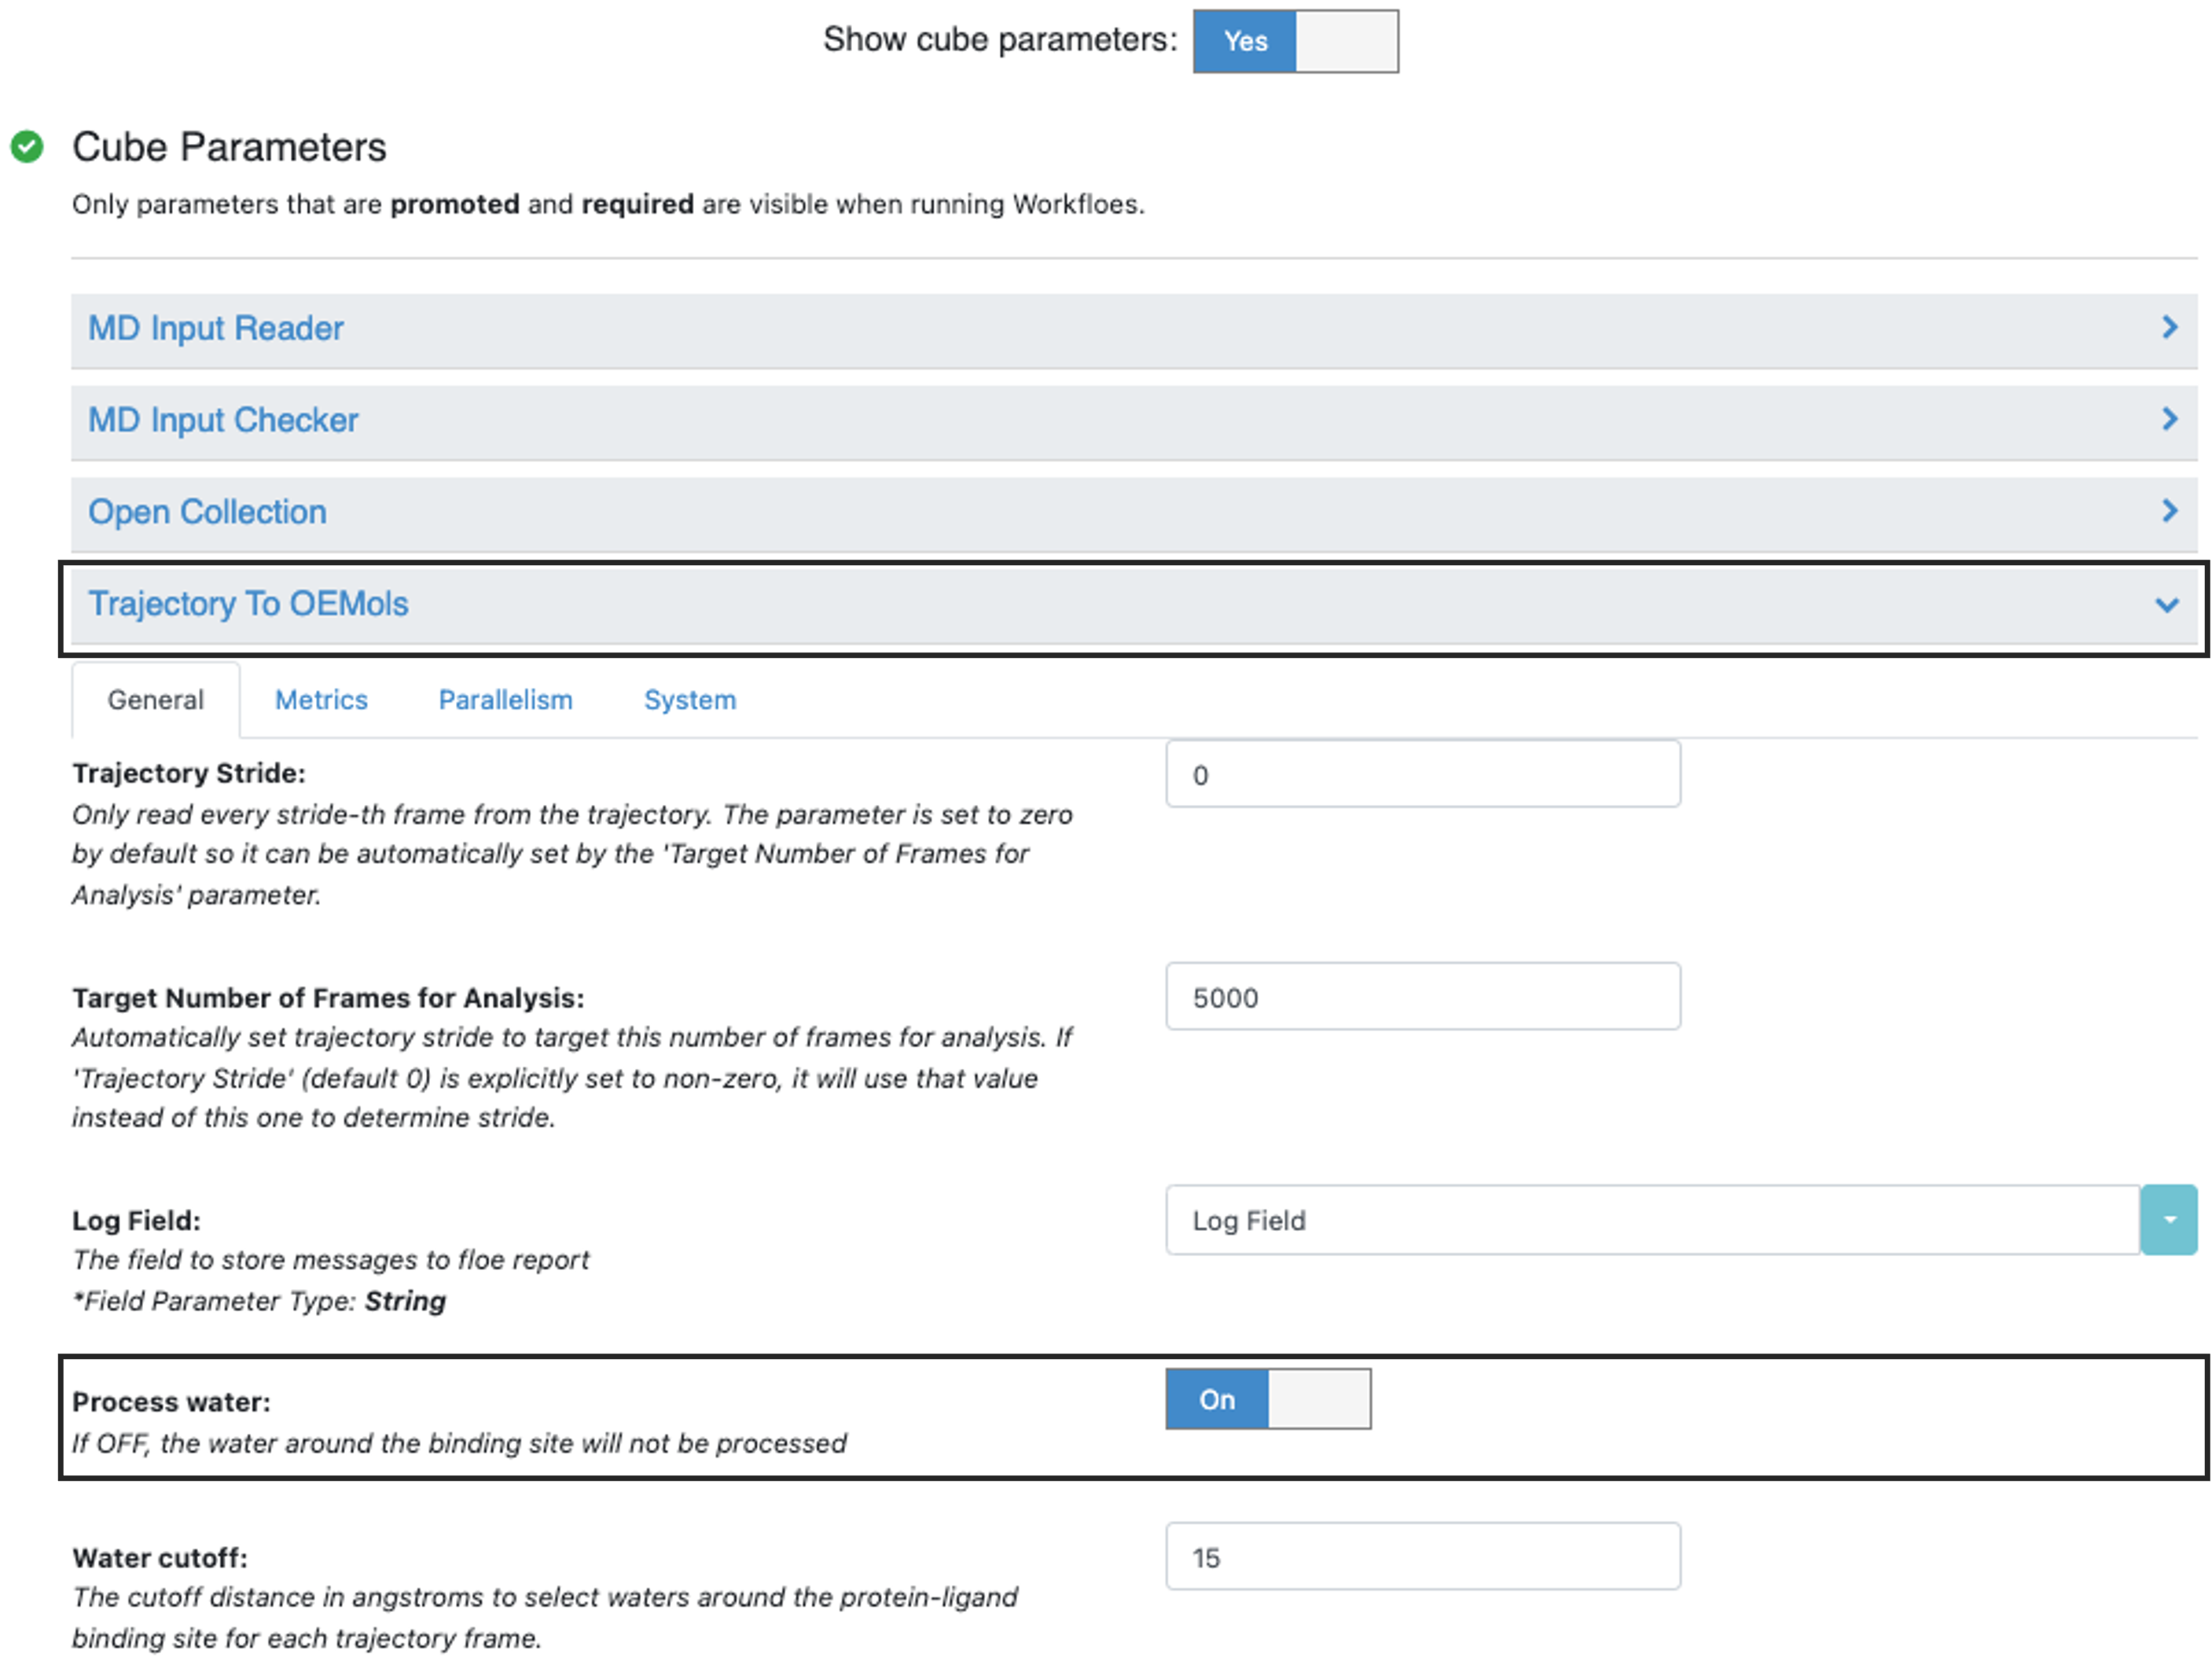
Figure 4. The Process Water parameter controls water analysis.
Major Cube Parameters
In the Traj to OEMol Cube, these are the parameters for the preprocessing of the trajectory: the frequency of frames chosen for downstream analysis and the preselected range for water molecules to be used in the water analysis.
Process water: If this parameter is turned Off, water analysis will not be performed. By default, it’s On.
Trajectory Stride: Only read every nth frame from the trajectory, where n is set by this parameter. By default, the parameter is set to zero, which allows it to be automatically adjusted by the Target Number of Frames for Analysis parameter. This parameter can be overridden by the default setting of the Trajectory Stride Setting Cube. If the total number of atoms (flask size * nframes) is larger than \(200 \times 10^6\), it will set the stride to nframes/( \(200 \times 10^6\) / flask size ) to avoid the memory issue. If you still would like to choose the original stride, this can be done by turning skip_stride_setting On.
Target Number of Frames for Analysis: Automatically set trajectory stride to target this number of frames for analysis. If Trajectory Stride (default 0) is explicitly set to nonzero, it will use that value instead of this one to determine stride.
Water cutoff: The cutoff distance in Angstroms to select waters around the protein-ligand binding site for each trajectory frame.
In the Initialize Water Calculation Cube, the grid size and the spacing are the parameters for determining a grid. The current default setting is 8 Å for grid extent, meaning the grid is constructed based on the ligand’s size with an additional 8 Å padding on each side and 1 Å spacing between voxels. Increasing the extent distance enlarges the grid, potentially involving more water molecules in the analysis, but it will also increase computational time and costs. Decreasing the distance speeds up calculations but may overlook important water molecules for analysis. Similarly, using a smaller voxel spacing will have more refined results but with a higher cost.
grid extent: The buffer distance beyond the ligand size used to determine the grid box size.
grid spacing: Grid spacing.
In the Calculate Grid-Based Water Cube, three of the five parameters are key for identifying water sites.
The distance criterion for identifying water molecules (max_water_distance_from_ligand): the current setting is to consider waters within 5 Å of the ligand.
The level of structuring considered for water sites: based on analysis of a variety of dataset results, we set the cutoff at 45% to indicate structured water. If the occupancy threshold is set lower than the default value, more water sites will be identified; conversely, fewer water sites will be identified.
The exposure of water molecules to the bulk solvent: if the exposure threshold is larger, fewer water sites will be identified; otherwise, more water sites will be found.
max_water_distance_from_ligand: Specify the distance from the ligand within which the water analysis will be conducted.
occupancy_threshold: Only the water sites with occupancies that are above this threshold will be calculated. (unit: percentage of full occupancy).
solvent_exposure_threshold: Only the water sites with a number of neighboring heavy atoms (excluding water molecules) above this threshold will be calculated.
Method
This water analysis tool reproduces part of the GIST [Nguyen-2012] method and works from SSTMap [Haider-2018], reimplemented with OEToolkits. With explicit solvent molecular dynamics data, a grid is created based on the ligand binding site with an extended distance. Using a grid spacing of 1 Å as an example, the grid is divided into voxels. Assign the water molecule from each frame across the simulations to their nearest voxel and accumulate the number of water molecules appearing in each voxel. Rank the voxels based on their density, group them into water sites, and calculate the water site’s occupancy.
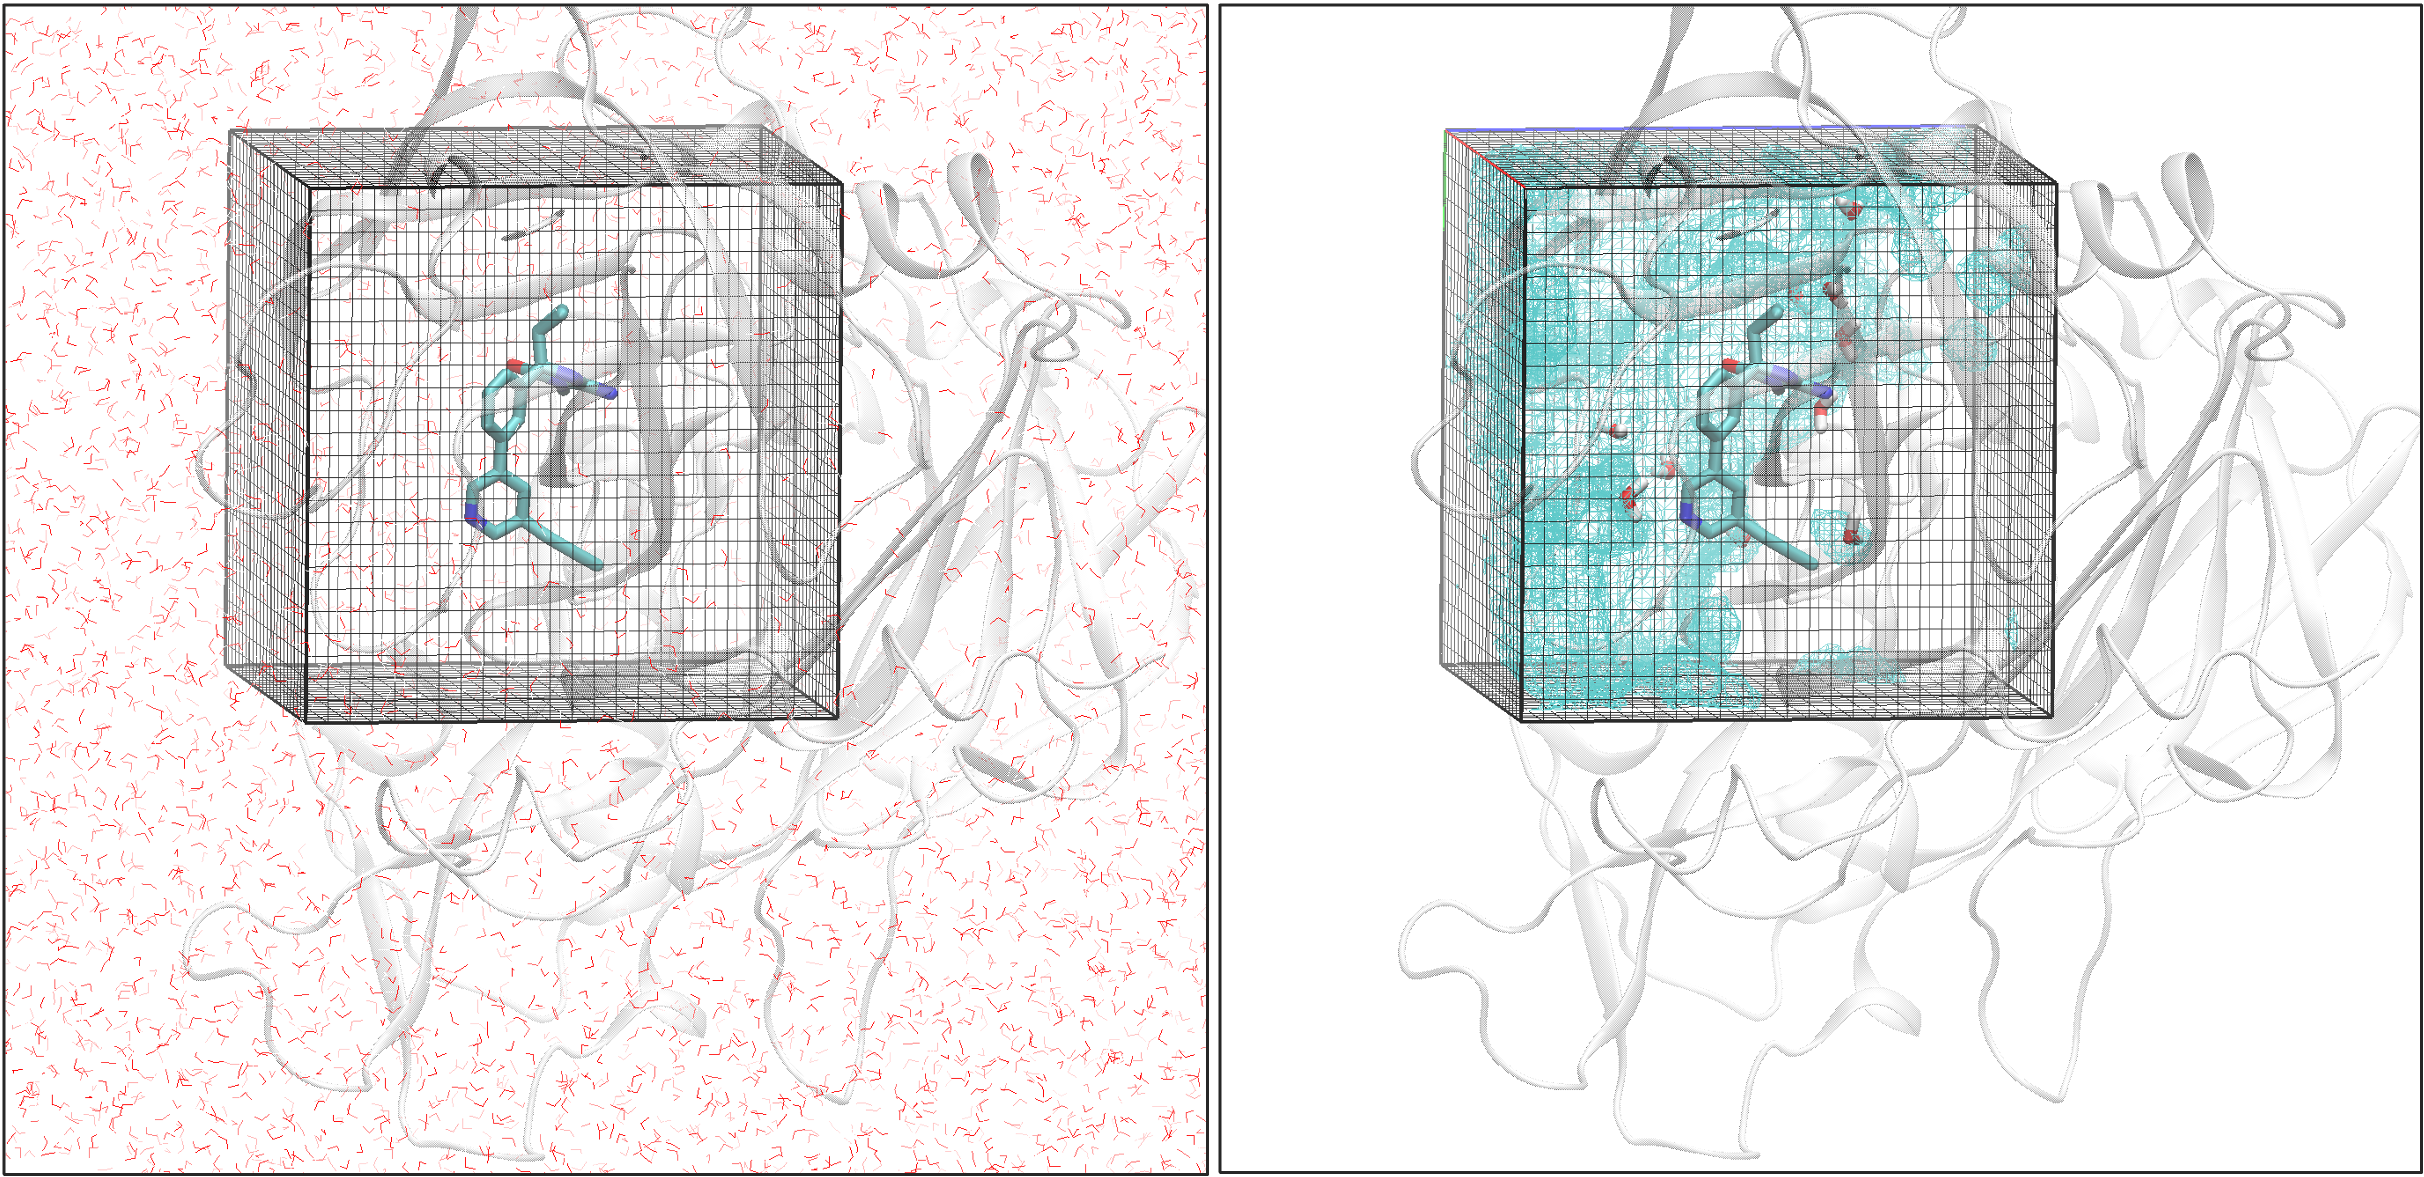
Figure 5. An illustration of structured water analysis.