Sequence-to-Structure with Ligand Affinity Ranking Tutorial
The sequence-to-structure prediction floes use the Boltz model for macromolecular structure prediction. These floes can also predict ligand binding affinity. This latter feature can be used to compare the binding affinities for a large number of ligands to a single protein sequence. This is done by running many structure predictions with ligand co-folding and then predicting the binding affinity. These affinities are gathered and ranked based on highest affinity.
A single multiple sequence alignment (MSA) search is necessary for this process, though the details of an MSA search will not be covered in this tutorial because this content has been addressed in other tutorials (see Sequence to Structure Tutorial). This tutorial will assume the MSA has already been performed and an a3m file will be used as input.
Floes Used in This Tutorial
The floe used in this tutorial is:
Ligand Affinity Prediction and Ranking
The Protein Sequence to AI Folded Structure Ligand Affinities Floe uses many of the same inputs as the Protein Sequence to AI Folded Structure Prediction Floe to define the protein folding system. Importantly, defining pocket constraints is possible in the Boltz Constraints section of the Job Form.
One important aspect of this floe is the ability to make many affinity predictions against a single target. This means that this floe takes many ligand inputs and only one protein target system will be defined. For best results, an MSA from a diverse sequence set is highly recommended. See the MSA Search How To Guide for more information.
Provide Input Files and Parameters to Run the Floe
On the Floe page, locate the Protein Sequence to AI Folded Structure Ligand Affinities Floe, then click the blue “Launch Floe” button to launch the Job Form.
Sequences can be input using either string inputs or a FASTA file input. This tutorial covers the manual sequence input strategy. In the Input Sequence parameters of the Job Form, indicate the chain(s) of the protein with unique chain identifiers that match the chain identifiers in the input MSA files.
In several sections of the Job Form (multimers, constraints, MSA, etc.), this sequence title is used to properly apply a feature. This title is defined to be the text between the FASTA title (‘>’) and the first pipe delineator (‘|’). For example, a FASTA title ‘>2MG4_1|Drosophila melanogaster’ will be automatically assigned the 2MG4_1 sequence title.
Chain identifiers are used to explicitly identify a sequence’s chain or to indicate whether multiple instances of the same chain (e.g., monomeric dimer) are to be co-folded. You can use the sequence title to identify the chain and unique strings to identify the chain ID. It is acceptable to leave this Chain Identifiers field blank: only one instance of the input chain will be used during structure prediction. In this example, only a single chain is used and this field is populated with 3TPP_1:A.
Because this floe will compare the affinity of many ligand co-folders, a set of ligands is used as input. This is a dataset of of ligands in the case of this tutorial, but file input is also supported. These ligands will be given the LIG chain ID for the protein–ligand system.
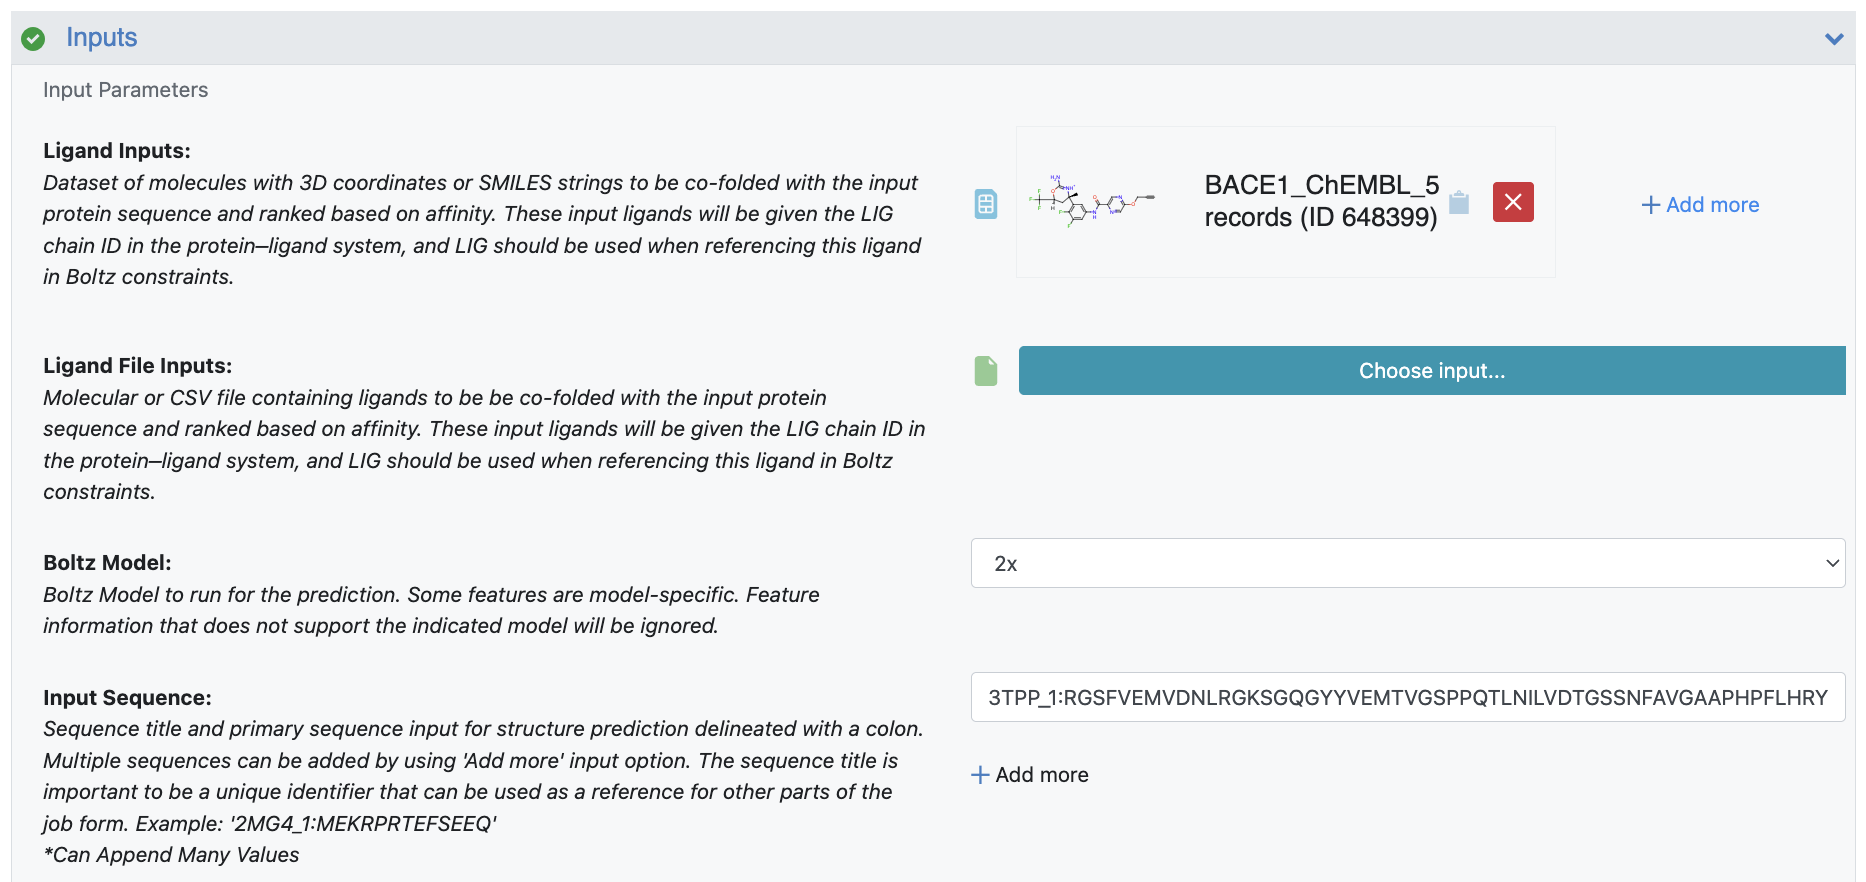
Figure 1. Input parameters for the Protein Sequence to AI Folded Structure Ligand Affinities Floe ranking.
Constraints Can Enforce Pocket Location
When making structure predictions with ligand co-folding, the pockets are learned and predicted by the folding engine. This has the potential for the engine to fold the ligand into an incorrect binding pocket and lead to a misleading affinity prediction. To prevent this, you can provide pocket constraints that better define the location where you want the ligand to fold into. Boltz provides three types of constraints: pocket, bond, and contact. This tutorial focuses on the pocket constraint as it most directly defines a bonding pocket, but the others could be used to enrich the folding environment.
To define the bonding pocket, first use the ligand chain ID that will always be set to LIG per the input parameters. This is then followed by the pocket residues that are defined by their chain ID and residue sequence. In this tutorial, you can define the pocket with: LIG:[A,238][A,37][A,78]. Chain A is the protein chain as identified by the Chain Identifiers parameter. The subsequent residue numbers are the sequential locations of the residue in the Input Sequence with the first residue in that sequence always defined as 1.
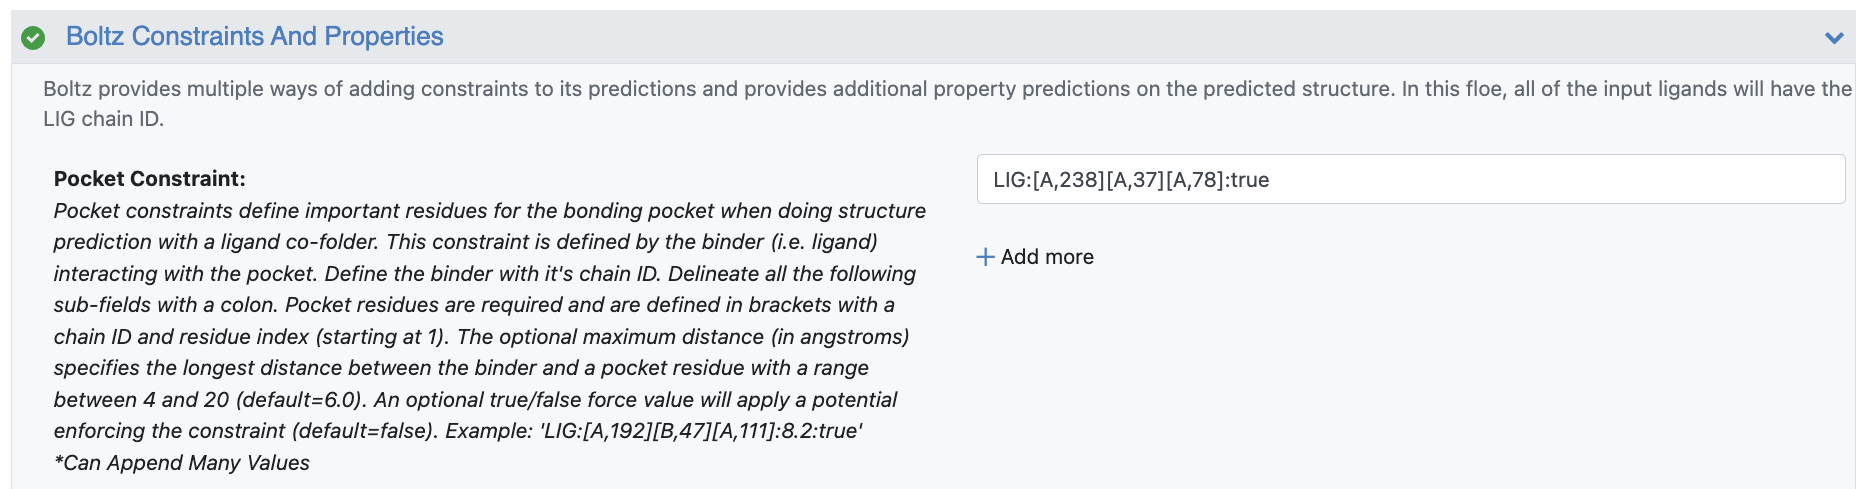
Figure 2. Constraint parameters defining the bonding pocket.
Additional contact length and force flags can also be applied. In this tutorial, you want to enforce this pocket with a potential and force the constraint in the model. This is indicated by appending with “true” to get the final constraint: LIG:[A,238][A,37][A,78]:true.
Input Multiple Sequence Alignment
Your MSA file for protein folding predictions can be input in the MSA Search Options parameters. The MSA Align and Search Floe can be used to generate a unique .a3m file for each unique input sequence, all of which need to be provided to the structure prediction floe. The precomputed MSA file only contains one unique sequence. This file will be added to the Precomputed MSA File parameter field.
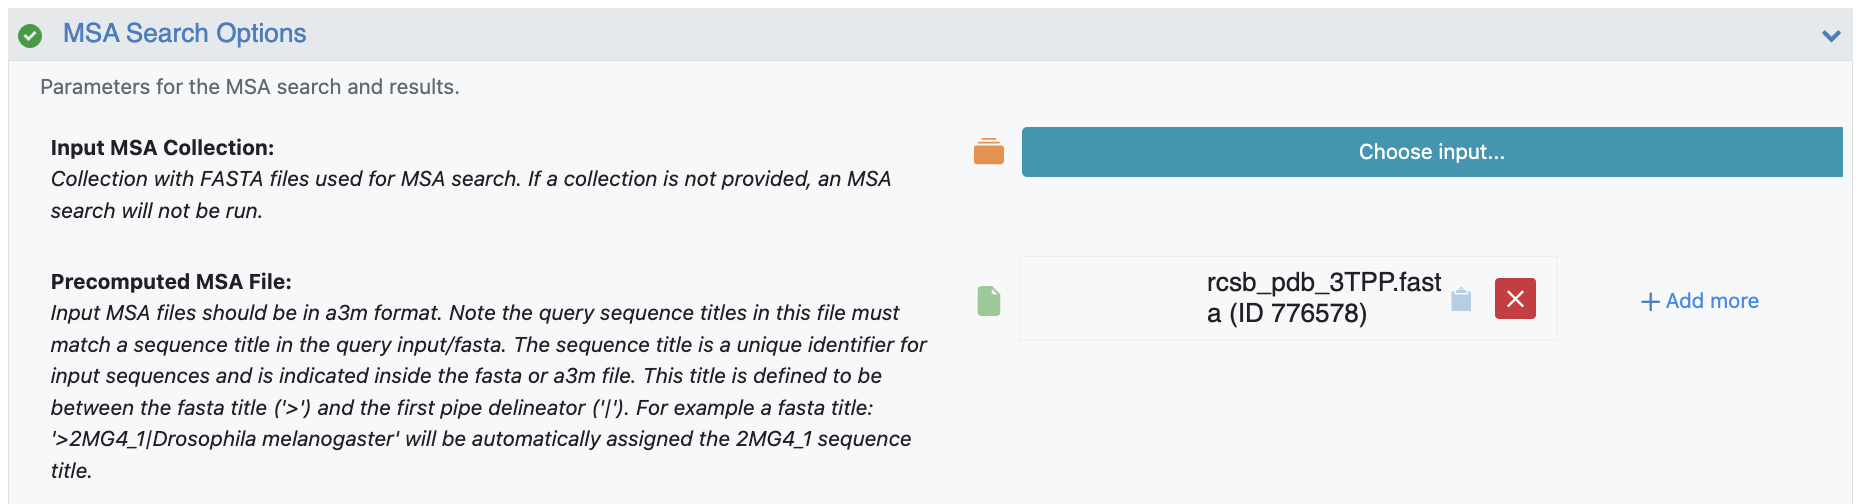
Figure 3. MSA Search Option parameters.
After providing the input sequences and inputs, click the green “Start Job” button to start the floe.
Visualize AI Folded Structures
Once the Protein Sequence to AI Folded Structure Ligand Affinities job has finished, one dataset will have been generated. The records in this dataset are sorted by affinity prediction (more negative values have stronger affinity), and it holds biological design units of the predicted structures. The co-folded ligand will be saved as an Other Ligand design unit component.
To visualize the prepared dataset:
On the Data page, clear the current active datasets by clicking on the Active Datasets drop-down and then “Clear All.”
Activate the output datasets by clicking on the + icon (“Dataset Activation” button).
The 3D results can be visualized on the 3D & Analyze page, and the spreadsheet shows the prediction and confidence metrics provided by Boltz.
To display the co-folded ligand in the 3D viewer, click the green check mark next to other_ligands
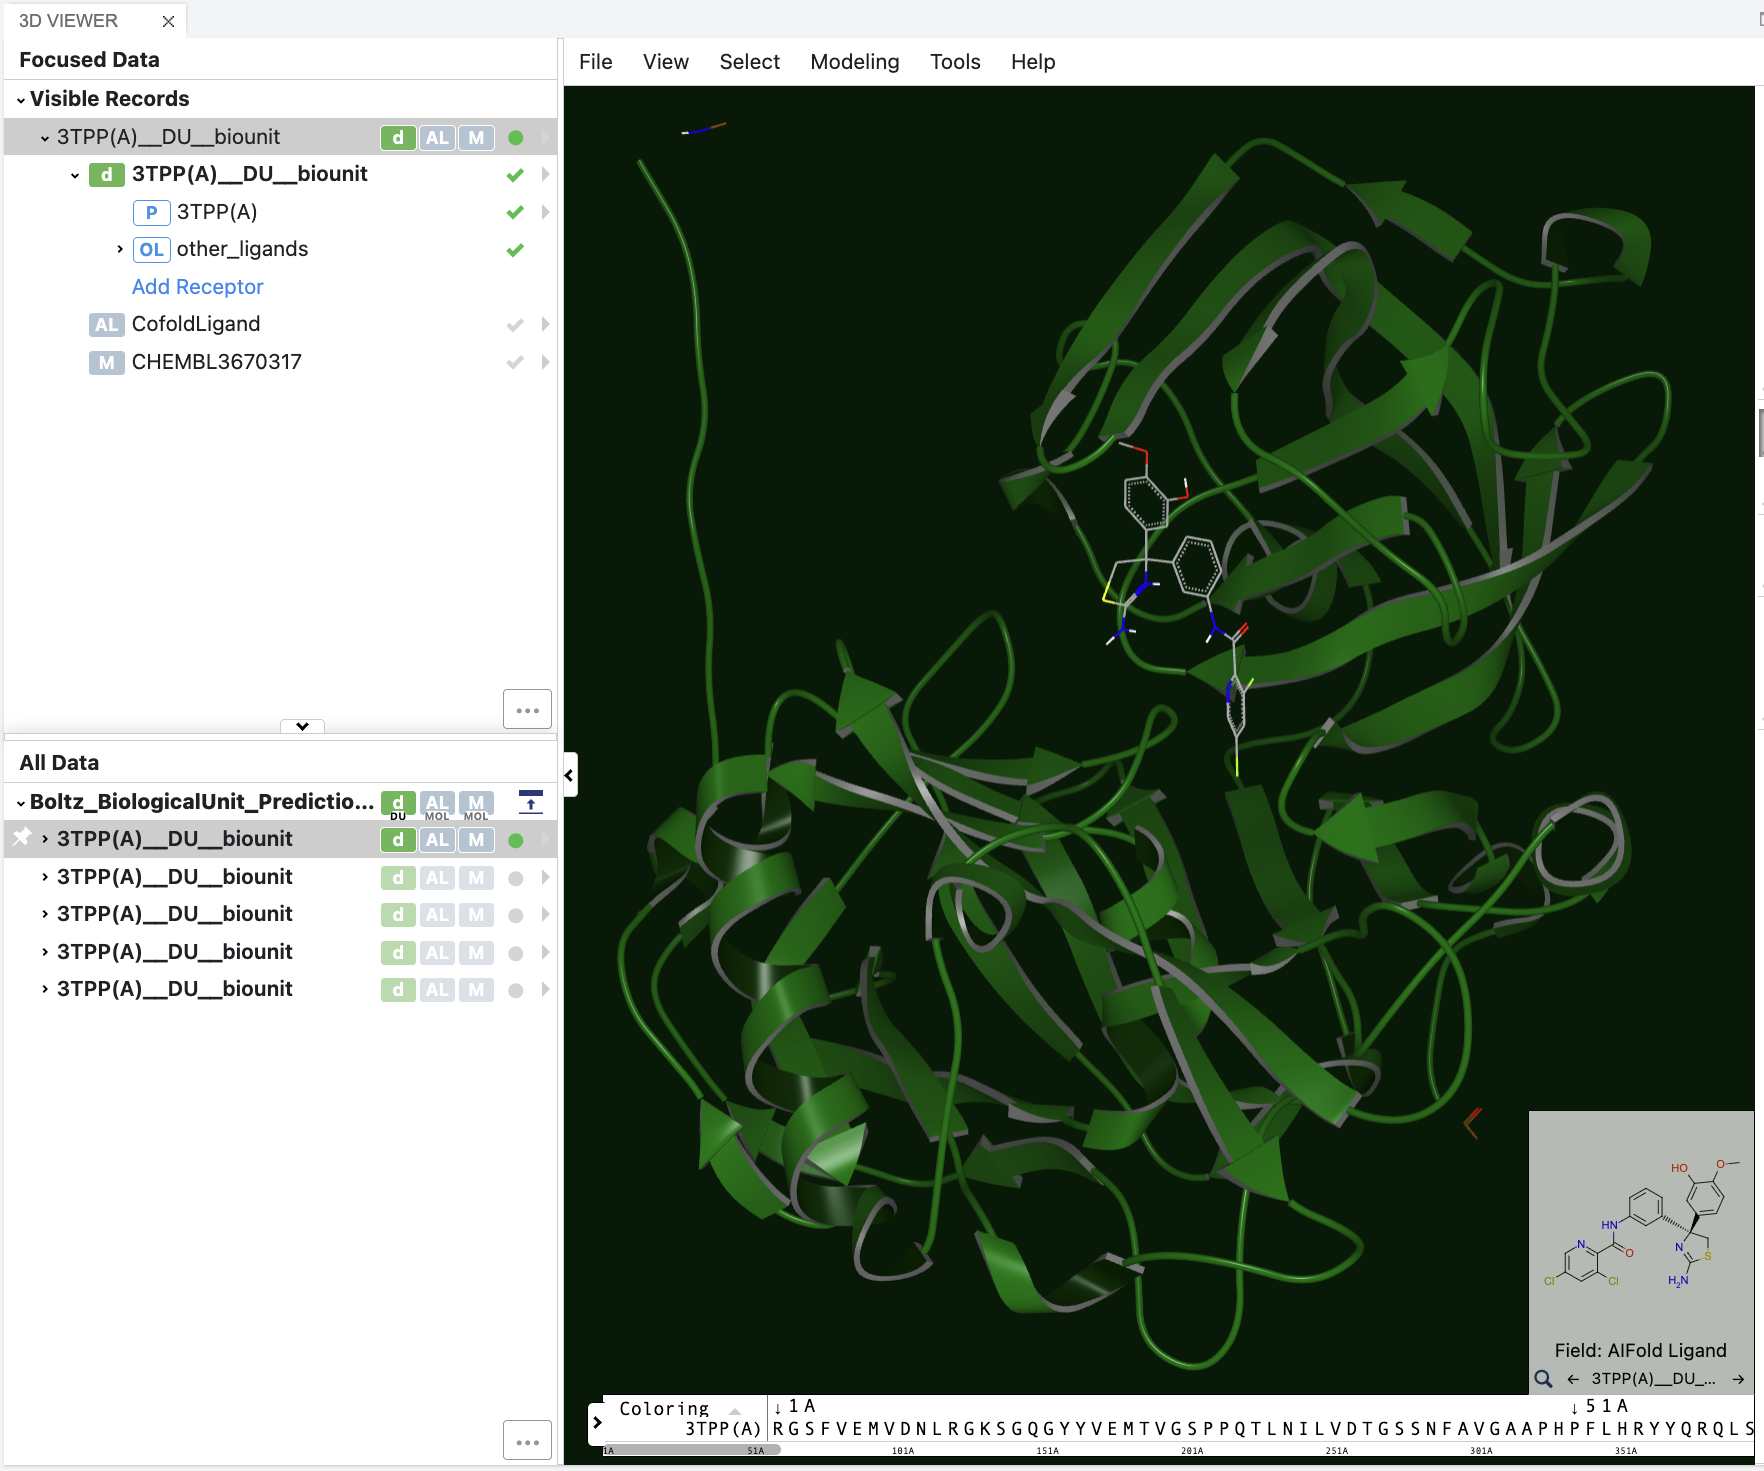
Figure 4. The 3D visualization of the sequence-to-structure results.
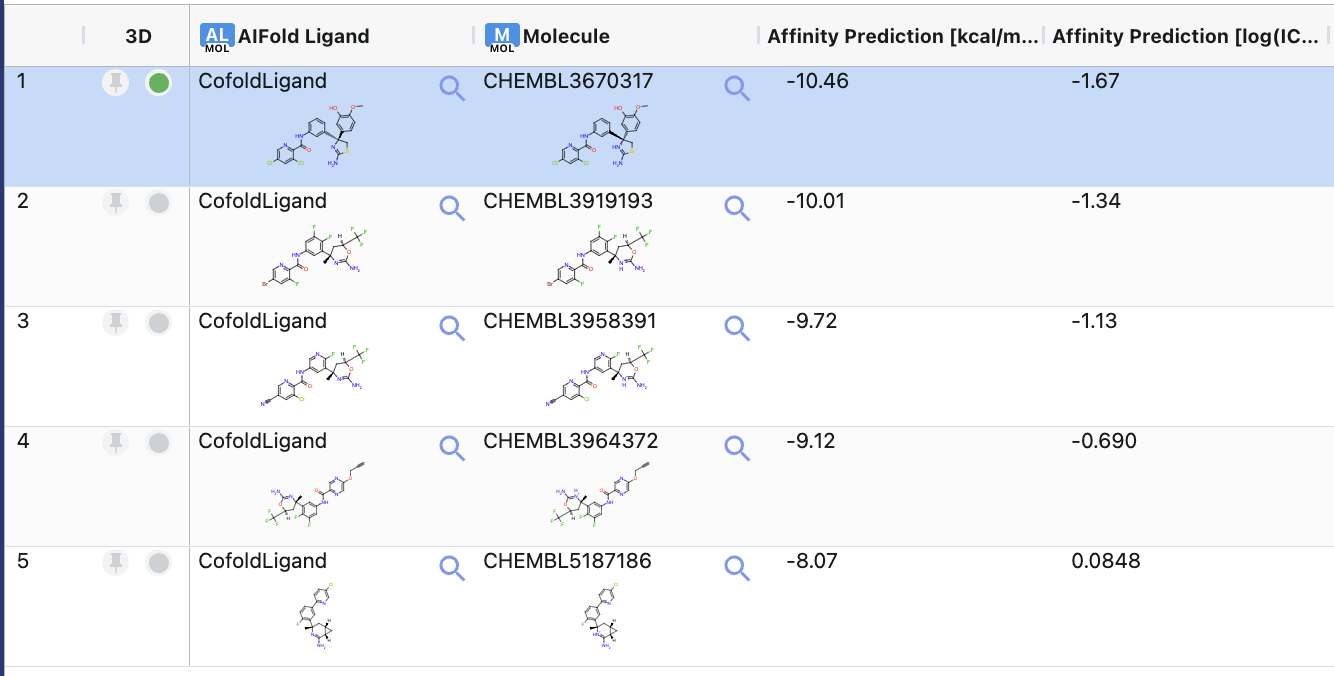
Figure 5. The spreadsheet showing the sequence-to-structure results.