Nonequilibrium Switching
The Nonequilibrium Switching (NES) method is a relatively novel method in the binding free energy context to calculate relative binding affinities (RBFE) of a given target and its ligands. The theory was developed during the 1990s ([Jarzynski-1997a]; [Jarzynski-1997b]). However, due to its high computational demand, the approach has not been fully explored, and few pioneering works have been published so far [Gapsys-2020].
In general, the relative binding affinity \(\Delta\Delta G\) is defined as the free energy difference between the binding affinities of ligand A \(\Delta G_{A}\) and ligand B \(\Delta G_{B}\) related to their target: \(\Delta\Delta G=\Delta G_{B}-\Delta G_{A}\). Nevertheless, the direct computation of these affinities could be quite challenging because a direct binding process has to be simulated in-silico, and often, other thermodynamic paths are used. During the last 30 years, alchemical methods have been proven to be very effective to calculate the RBFE between two ligands; in this context, the ligand pair involved in the RBFE calculations are named as an Edge. In this approach, a starting ligand A is “mutated” into a final one B in different environments. For example, \(\Delta\Delta G\) can also be computed following the alternative thermodynamic paths shown in Figure 1, where \(\Delta G_{Bound}\) and \(\Delta G_{Unbound}\) are estimated by using alchemical methods: \(\Delta\Delta G=\Delta G_{Bound}-\Delta G_{Unbound}\).
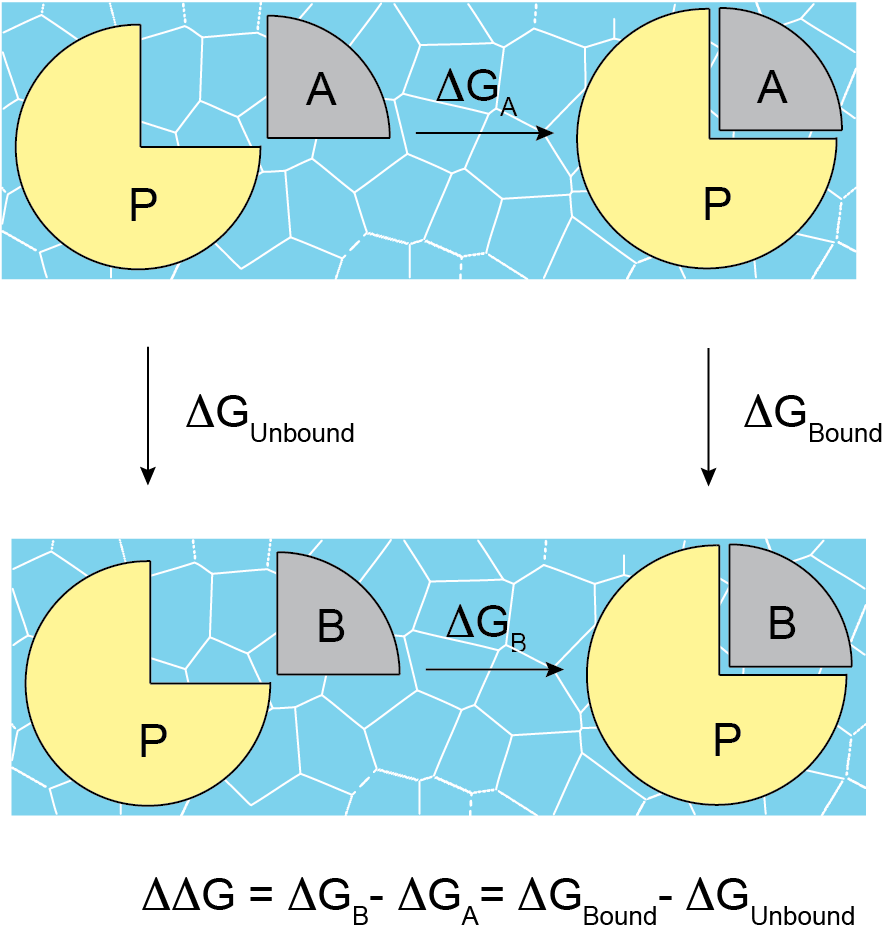
Figure 1. RBFE and alternative thermodynamic paths.
In the unbound path, the starting ligand is mutated into the final one only in solution, while in the bound path, the mutation happens in the complex binding site. In the NES approach, these mutations are done in a nonequilibrium regime many times, starting from equilibrium snapshots and building the forward and reverse work probability distribution functions that can be used to estimate \(\Delta G_{Bound}\) and \(\Delta G_{Unbound}\). For this reason, before running, the NES methodology requires having the equilibrium ensembles for the bound and the unbound systems.
In addition, the implemented NES floe protocol tries to estimate the binding affinities from the computed RBFEs by using the maximum likelihood estimator method [Xu-2019] and making it possible to compare the predicted affinity values with experimental results derived, such as activity measurements, IC50, and so on.
Caution
RBFE calculations via alchemical methods must be carefully used. In particular, mutations should be carried out between similar ligands, that is, where a common ligand scaffold can be identified and small different functional groups are mutated.
The Equilibration and Nonequilibrium Switching Floe
The Equilibration and Nonequilibrium Switching Floe can be divided into four main sections, as shown in Figure 2.
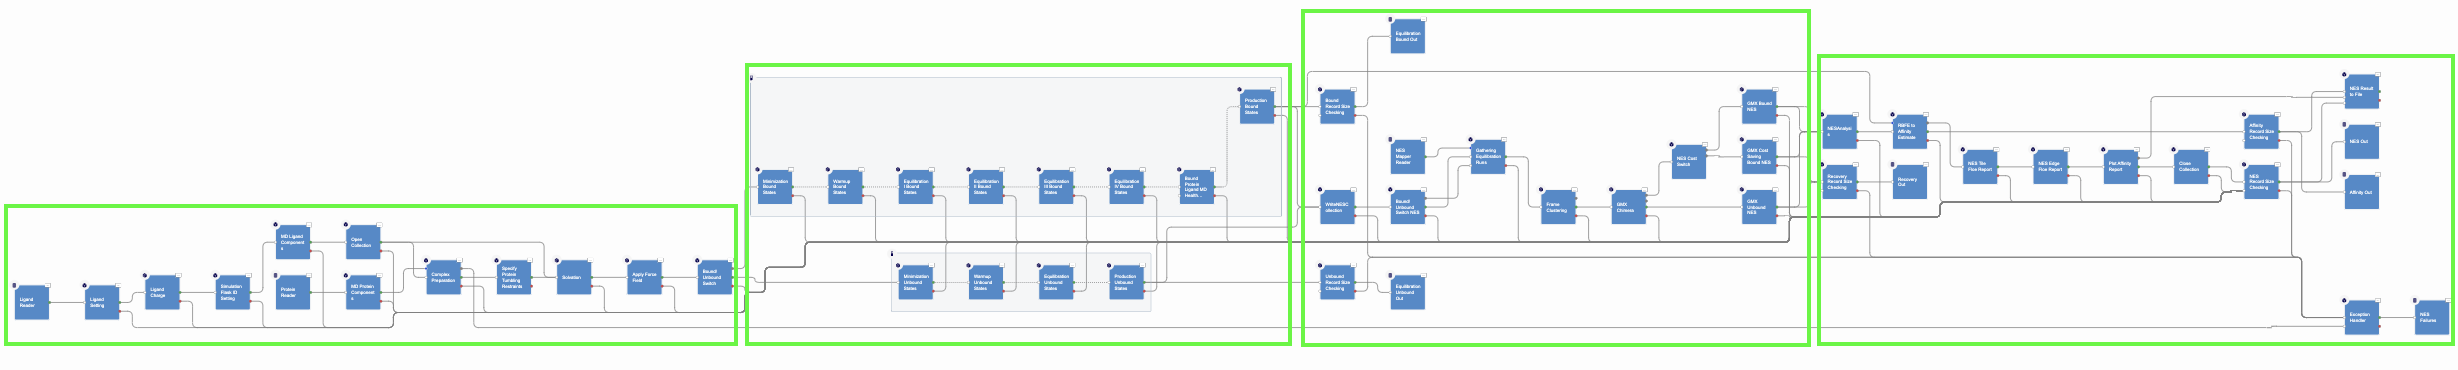
Figure 2. The four main sections of the Equilibration and Nonequilibrium Switching Floe.
The first and second floe sections are designed to assemble and run the bound and unbound simulations. The protocol for the bound simulations is similar to the tutorial on the Short Trajectory MD with Analysis Floe and is not repeated here. In the unbound simulations, each ligand is charged, solvated in a box of solvent, and parametrized accordingly to the selected force field. Next, it is equilibrated in three different steps performing restrained minimization, NVT MD runs, and NPT MD runs. At the end of the equilibration stages, both the bound and unbound prepared flasks are set into an equilibrium production stage where they run for a total of a default 6 ns.
The third section of the floe carries out the NES calculations, as shown in Figure 3.
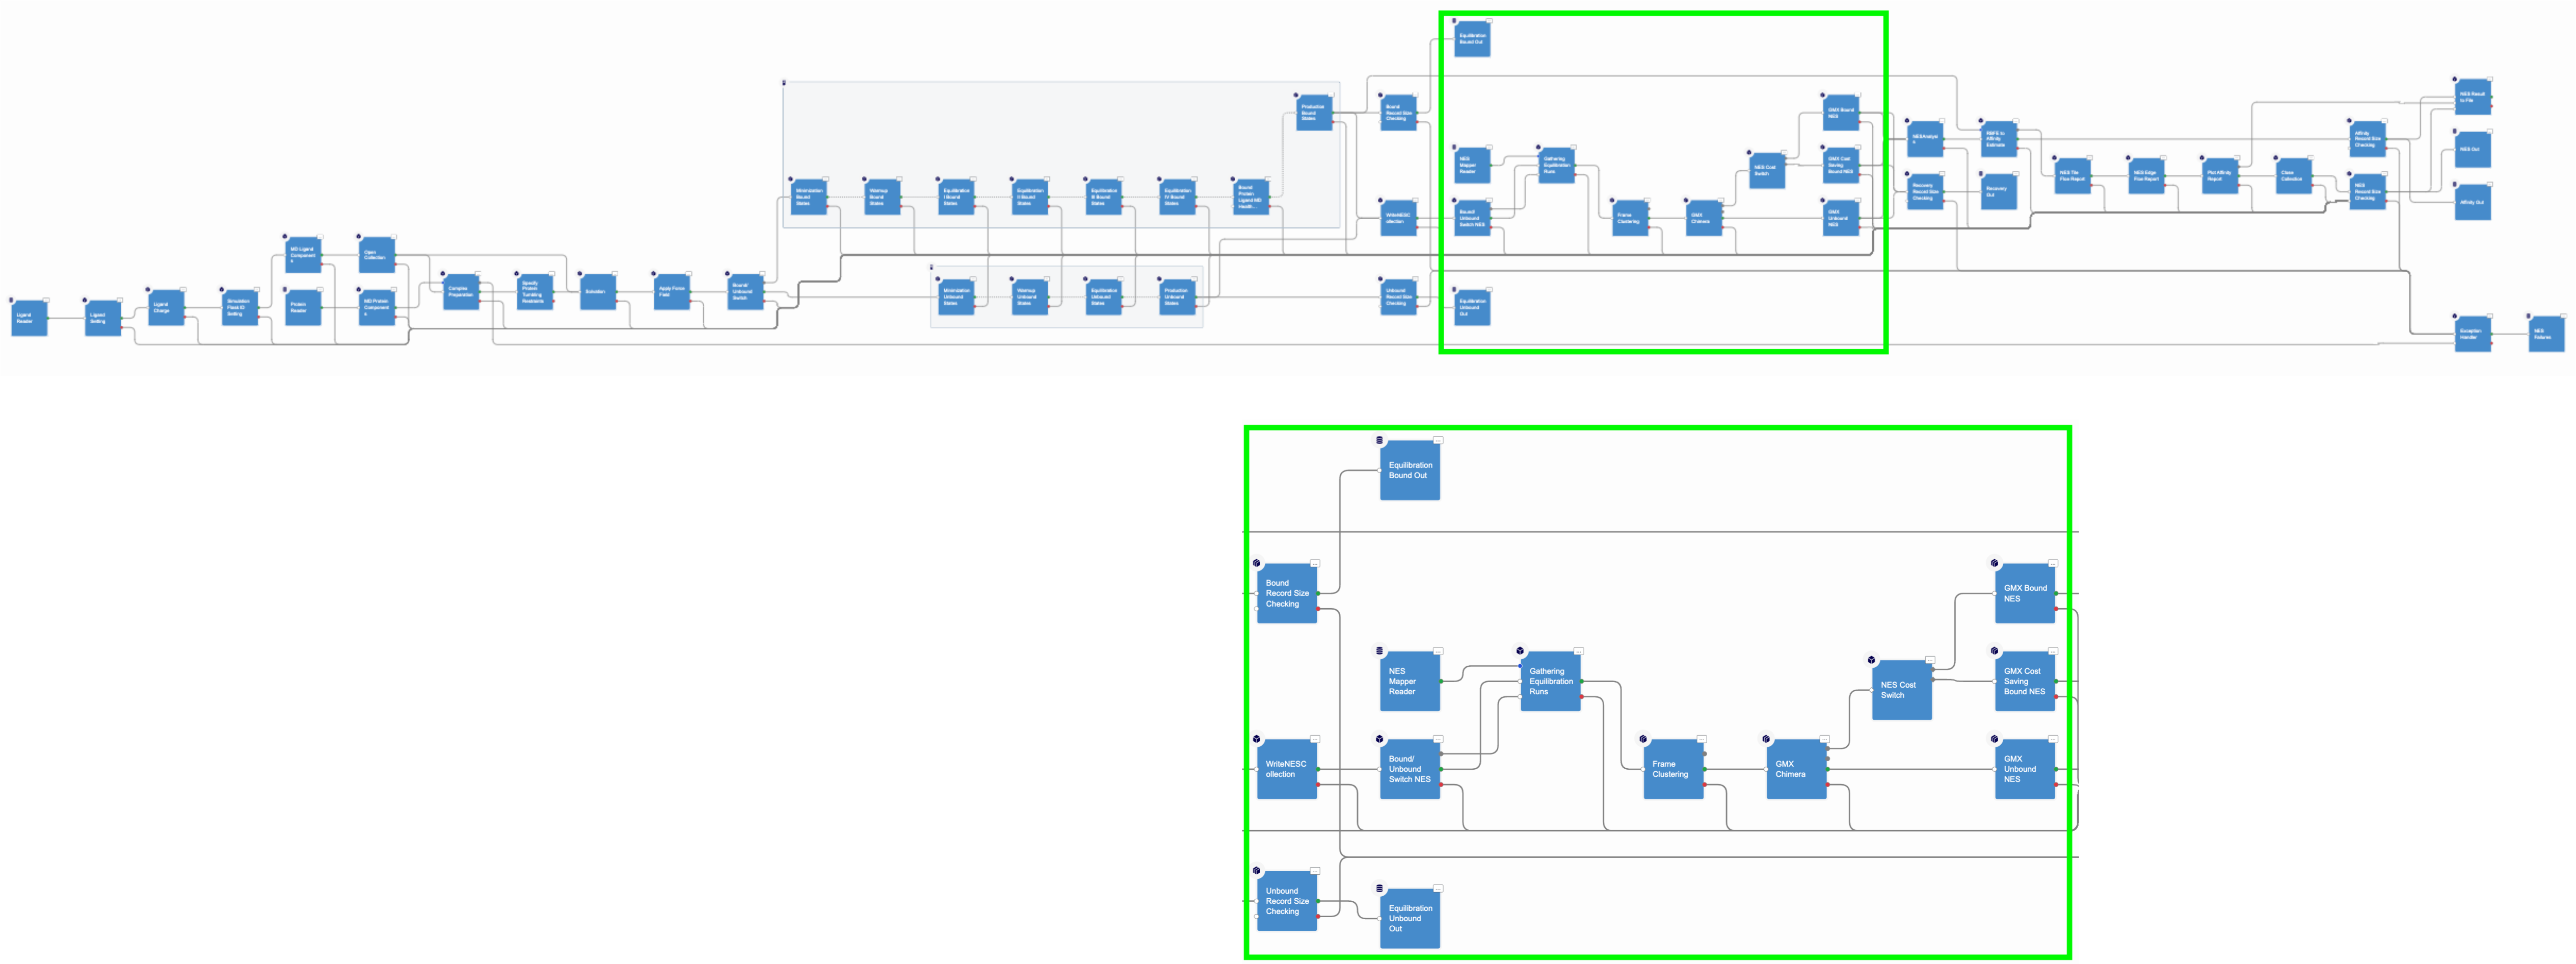
Figure 3. The nonequilibrium switching section of the floe.
In this section, the Gathering Equilibrium Runs Cube selects the equilibrium runs involved in a RBFE calculation and hands them to the GMX Chimera Cube. In this cube, a chimeric molecule between the ligands participating in an edge is created; in other words, the ligands are topologically merged together with their force field parameters. They are then injected into selected equilibrium trajectory frames collected during the equilibrium runs. In the NES method, for each chimeric molecule (or edge), the following switching simulations are performed for each selected equilibrium frame:
Bound forward (ligA is mutated to ligB in the complex binding site)
Bound reverse (ligB is mutated to ligA in the complex binding site)
Unbound forward (ligA is mutated to ligB only in solution)
Unbound reverse (ligB is mutated to ligA only in solution)
By default, 80 equilibrium frames are selected for the bound and unbound runs. Therefore, for each edge, a total of 320 switching mutations are completed.
80 (Bound forward) + 80 (Bound reverse) + 80 (Unbound forward) + 80 (Unbound reverse) = 320
Each run is effectively made with a short NPT equilibration of 5 ps to adapt the equilibrium frame system to the new chimeric molecule, followed by a default 50 ps NPT ensemble simulation, where the chimeric molecule is switched between the starting and final ligand thermodynamic states. All runs use Gromacs as the MD engine at this stage.
The final NES floe section analyzes the NES data to produce binding affinities and relative binding affinity results.
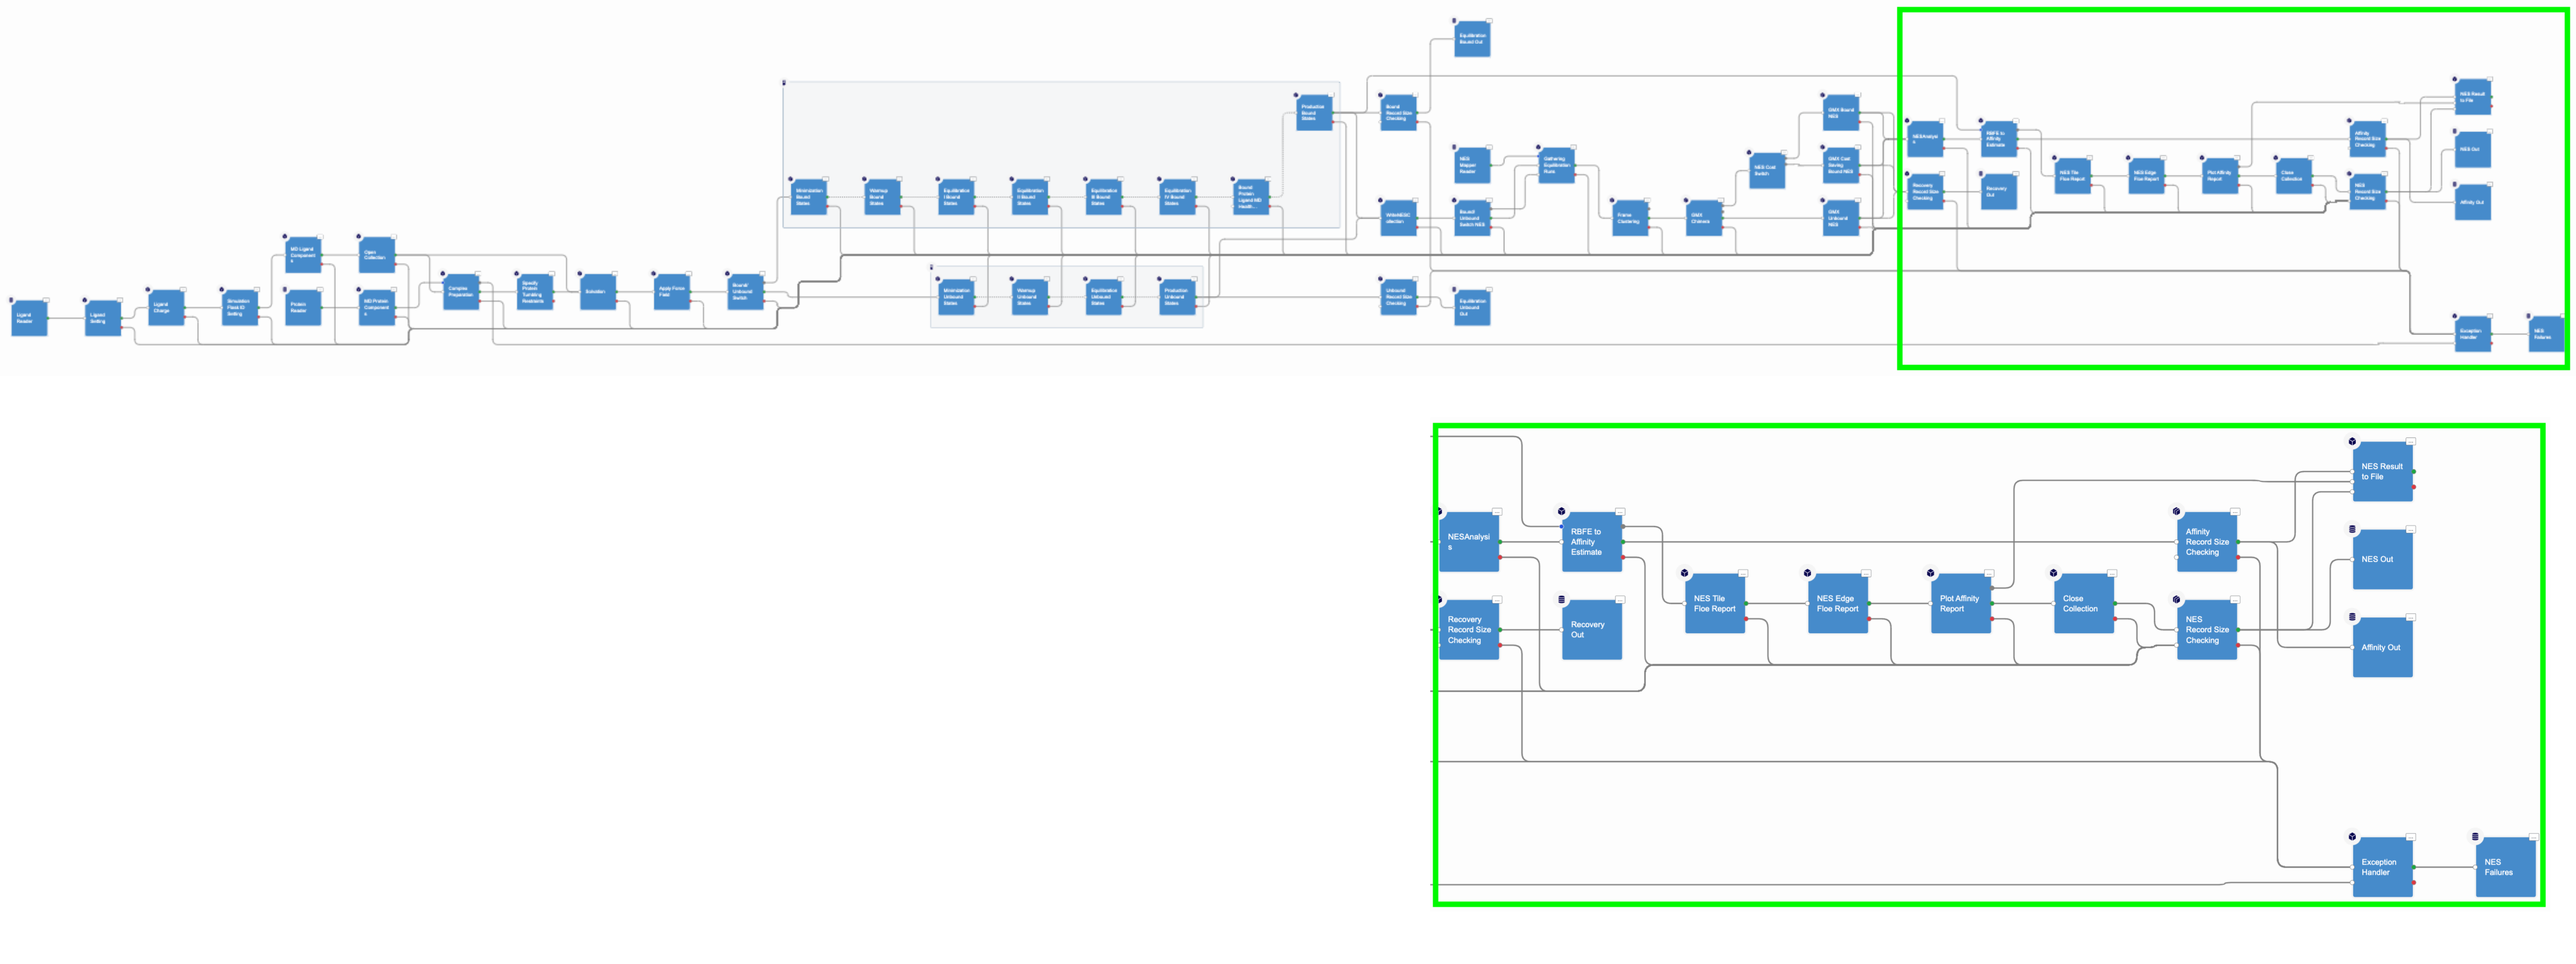
Figure 4. The NES analysis floe section.
For each edge, the forward and reverse works for the bound and unbound switching are evaluated by using the Bennet Acceptance ratio for nonequilibrium and these values are used to compute the \(\Delta G_{Bound}\) and \(\Delta G_{Unbound}\) free energies that are related to \(\Delta\Delta G\). The RBFE values for an edge are used to estimate the affinity values by using the maximum likelihood estimator. However, this approach succeeds only if the provided ligand edge map is connected, that is, any two map vertices are connected by a path; otherwise, no estimates will be calculated.
Caution
\(\Delta Gs\) are estimated from \(\Delta \Delta Gs\) by using a maximum likelihood estimator; however, the estimate will fail if the edge mapper provided has disconnected parts. This failure could also happen due to edge failures along the chimera molecule assembly or along the NES switching.
Protein, Ligand, and Edge Mapping File Inputs
As for the Short Trajectory MD with Analysis Floe, the Equilibration and Nonequilibrium Switching Floe requires ligands to have reasonable 3D coordinates, all atoms, and correct chemistry. In particular, bond orders and formal charges should be correctly assigned. The floe can be directly input from docking programs like Posit, but bad clashes should have been relaxed prior to starting the floe to resolve high gradients with the protein or other components like cofactors. In general, bad poses will be evaluated and eventually rejected during the floe.
The Equilibration and Nonequilibrium Switching Floe requires correctly prepared proteins up to “MD ready” standards, which require chain capping, all atoms in protein residues (including hydrogens), and missing protein loops resolved or capped. Protein side chain formal charges and protonation at this point determine their tautomeric states. Additionally, cofactors and structured internal waters are also important to be included. We strongly recommend using Spruce for protein preparation.
In addition to the protein target and its ligands, the Equilibration and Nonequilibrium Switching Floe requires the ligand mapper dataset produced by the Edge Mapper for RBFE Calculations Floe. This dataset contains the edge information for the relative binding affinity calculations to be carried out.
For this tutorial, the Tyk2 receptor and six ligands have been selected. The files can be downloaded below with the ligand dataset file as well.
How to Use the Floe
When you select the Equilibration and Nonequilibrium Switching Floe in the Orion UI, a Job Form with inputs, outputs, and parameters will come up. The following figures show the parameters for the Tyk2 receptor case.
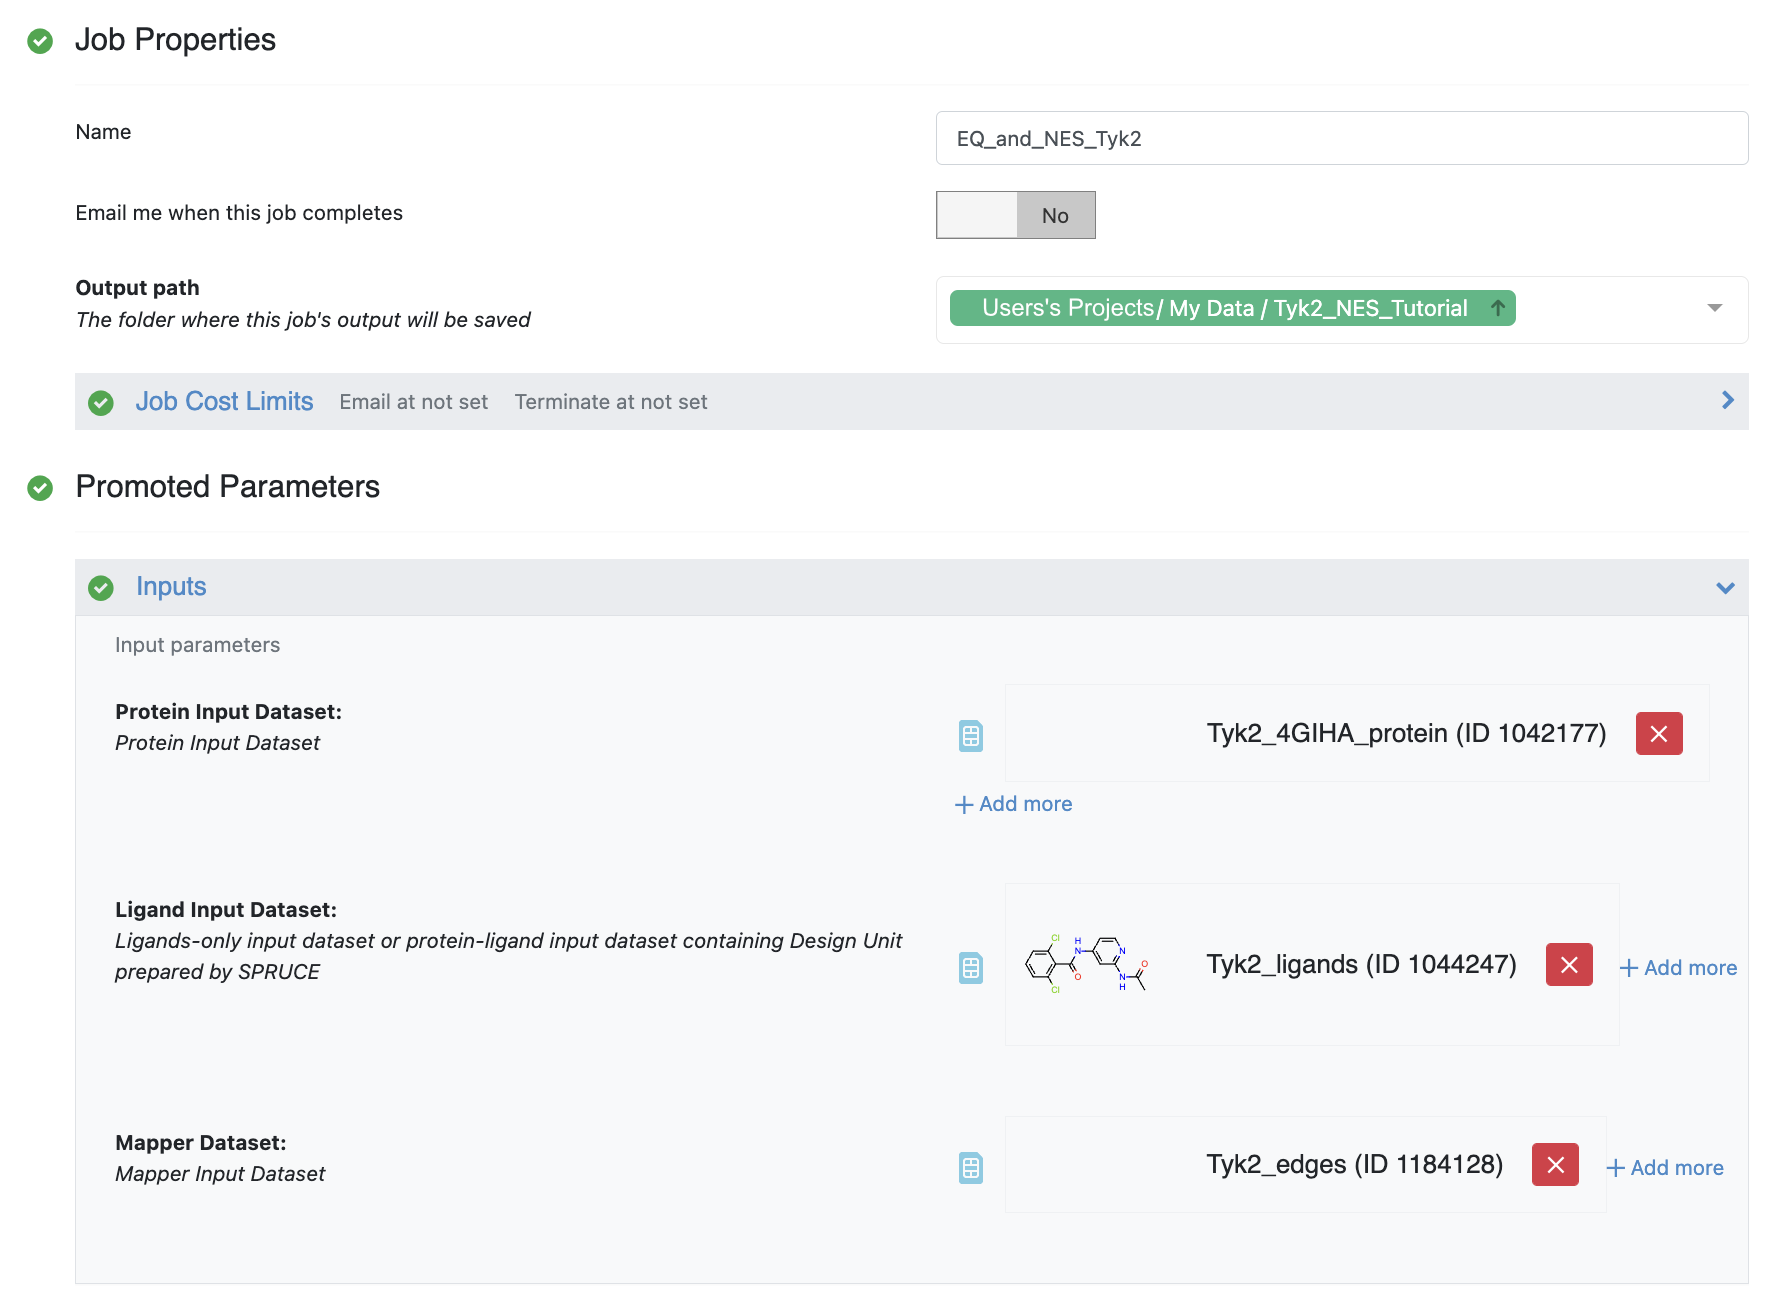
Figure 5. Inputs for the Equilibration and Nonequilibrium Switching Floe.
First, you should select the folder where results will be saved, in this case,
Tyk2_NES_Tutorial. Then proceed to providing inputs to run the floe.
The Equilibration and Nonequilibrium Switching Floe requires two mandatory inputs and two optional inputs.
The mandatory inputs are the ligand and the ligand edge mapping datasets.
The first optional input is the protein input file.
The second optional input is the experimental binding affinity of ligands provided via a dataset or a text file. It is used to generate comparison plots and tables between experimental and predicted results for \(\Delta\Delta Gs\) and \(\Delta Gs\) in the Floe Reports. See Experimental affinity provided via a dataset to find out how to provide experimental affinity values in either formats.
Protein input
The protein input is optional, but if it is not provided, the protein must be present on the ligand input datasets as a Spruce design unit. If protein cannot be found, an error is raised and the floe fails. If the protein is provided as input, and the protein is also present on the ligand input datasets, the protein input will supersede.
The POSIT - Ligand Guided Small Molecule Posing Floe is able to produce ligand datasets with protein included in them.
It is important to specify meaningful names for the Orion output datasets.
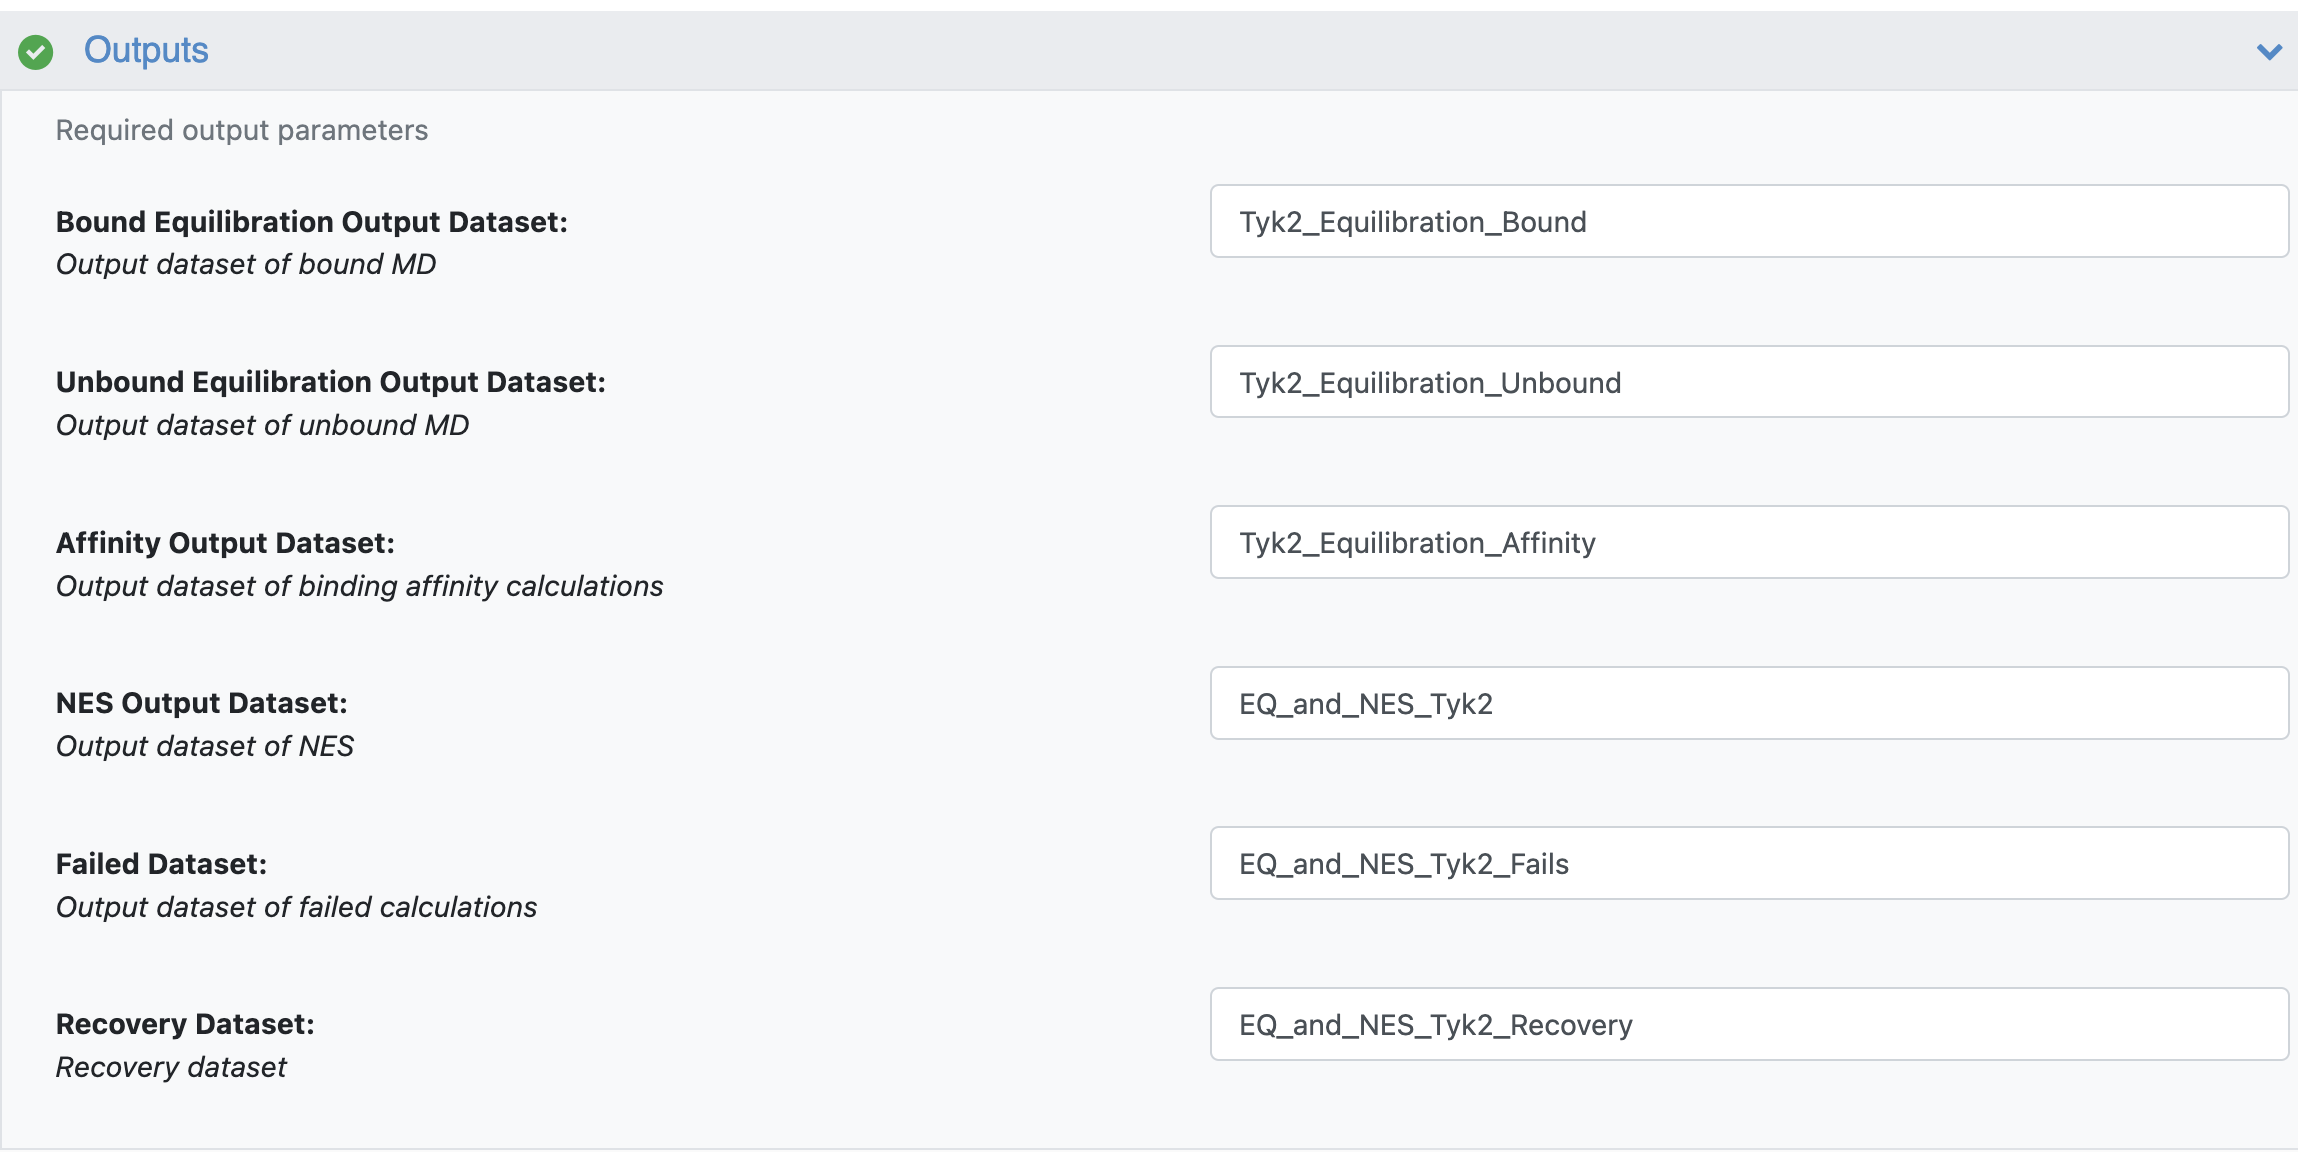
Figure 6. Outputs for the Equilibration and Nonequilibrium Switching Floe.
The Bound Equilibrium Output Dataset and Unbound Equilibrium Output Dataset are produced at the end of the equilibrium or analysis runs. If the provided edge mapping file is well connected (i.e., map vertices are connected by a path), the floe can predict affinities, and these results are saved in the Affinity Output Dataset. The NES Output Dataset and Failed Dataset are also produced as outputs. The first contains all the information produced along the NES runs at the edge and ligand level, while the latter gathers all failures produced along the whole floe for debugging purposes. Finally, you must provide a dataset name for the Recovery File. This file can be used to recover and generate partial results from the NES runs by using the designed recovery Nonequilibrium Switching Recovery Floe.
Promoted parameters must also be selected to run the floe.
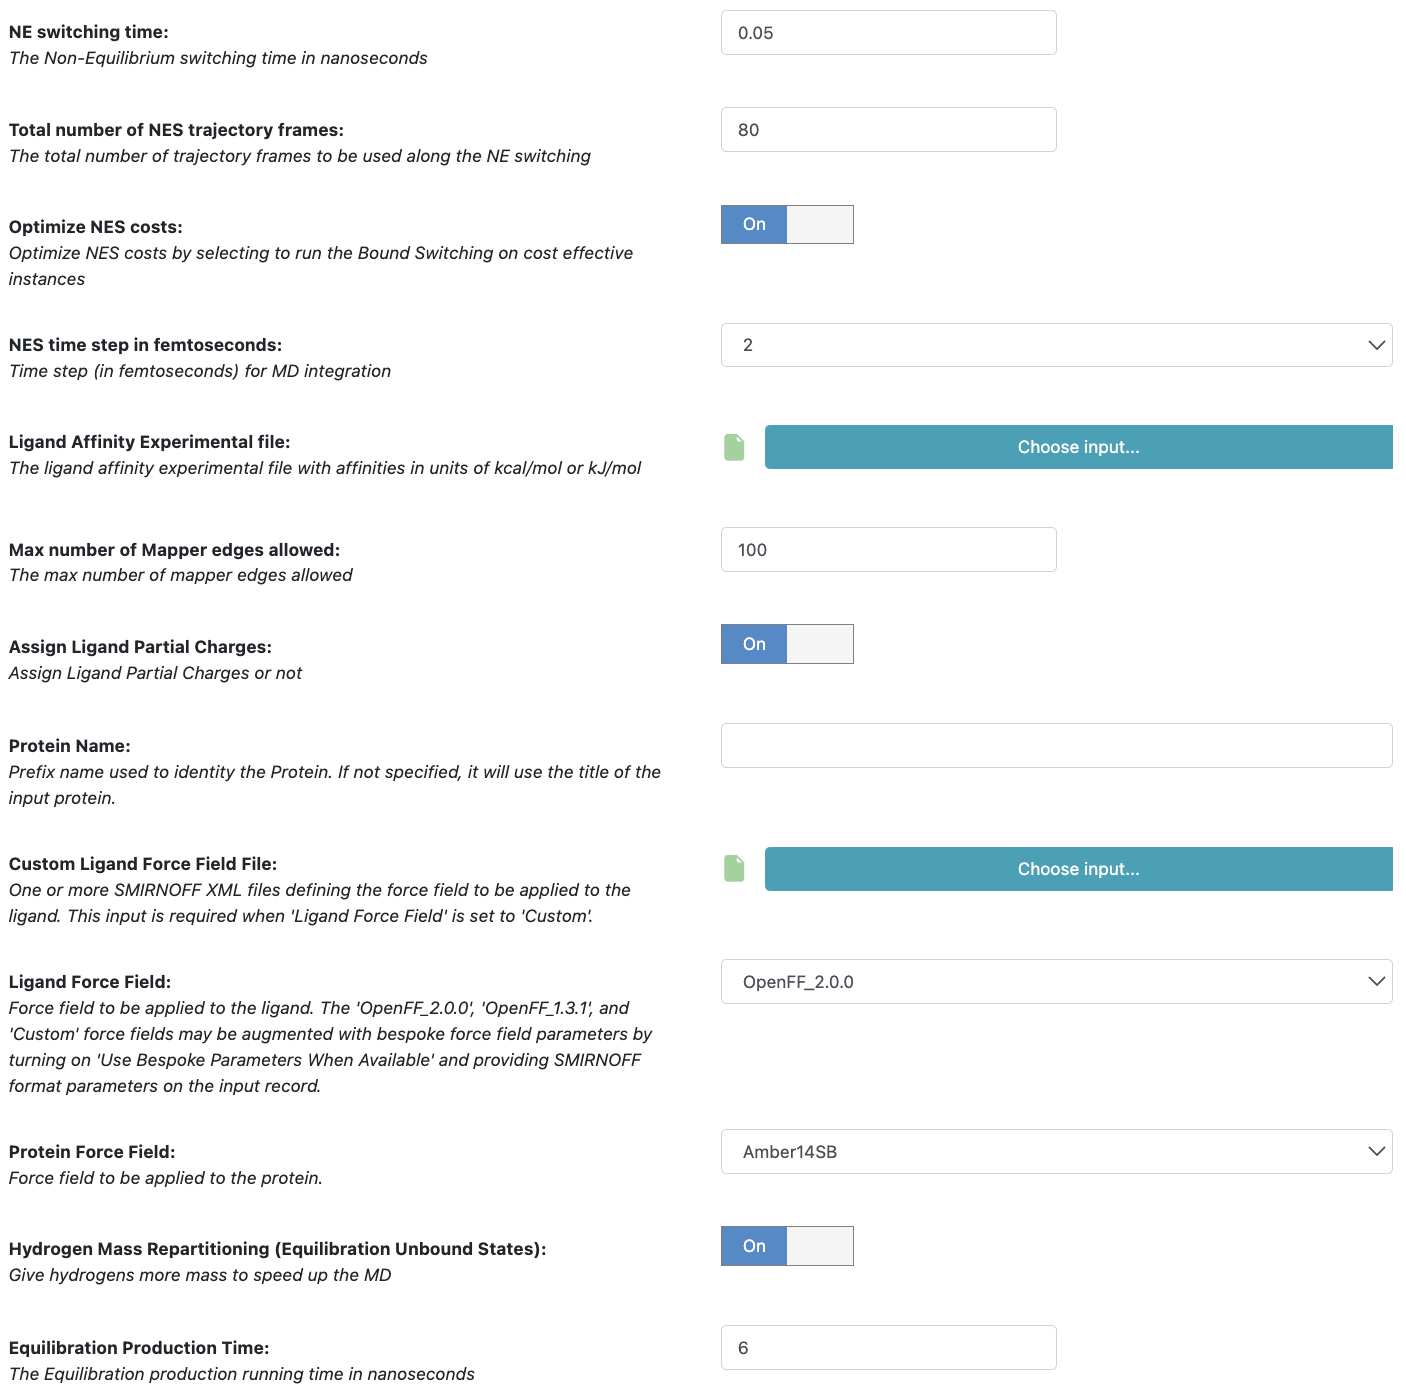
Figure 7. Floe parameters.
The parameters are defined below.
NE Switching Time. This parameter (default 0.05 ns) controls the time length of the NE switching. For difficult and large mutations, this parameter could be used to improve bound/unbound work convergence.
Total Number of NES Trajectory Frames. This parameter (default 80) controls how many snapshots are taken from the bound and unbound equilibrium trajectories to run the NE switching. For example, suppose that the bound equilibrium runs for 6 ns production time and collects a total of 1000 frames. From these frames, 80 equally distanced frames are selected (~12 frames each). The chimeric molecule is injected into these frames to run the forward and reverse bound and unbound runs.
Optimize NES costs. This flag (default On) controls whether to use optimized AWS instances to reduce the switching costs. On average, if the flag is On and the switching time step is set to 2 fs, it should result in a >50% savings cost when compared to 1 fs switching time step and flag Off. The drawback is that the running floe time could be longer overall if the optimized AWS instances cannot be easily found.
NES time step in femtoseconds. This parameter (default 2 fs) controls the MD switching time step. Two values are available: 1 fs and 2 fs. Larger time steps could increase the instability along the switching and produce more failures, but they should remain negligible overall and not produce significant effects on the free energy calculations.
Max Number Of Mapper Edges Allowed. This parameter (default 1000) controls how many edges are allowed to run. It is a safeguard parameter to avoid unexpectedly large costs.
Assign Ligand Partial Charges. If True (default True), the ligand will be charged by using the ELF10 methods; otherwise, the ligand partial charges will be used (if any).
Protein Name. The protein name (default blank) used to identify your flask. This will be used for the output file names and other information.
Custom Ligand Force Field File: One or more SMIRNOFF XML files define the force field to be applied to the ligand. This input is required when ligand force field is set to Custom.
Ligand Force Field. This is the ligand force field to be used (default OpenFF 2.0.0).
Protein Force Field. This is the protein force field to be used (default Amber14SB).
Hydrogen Mass Repartitioning (Equilibrium Unbound States). If true, the MD time step used along the equilibrium runs will be set to 4 fs, but otherwise to 2 fs (default True).
Equilibrium Running Time. This is the total equilibrium time (default 6 ns) for the bound and unbound simulations.
Protein tumbling restraints in NES simulations
Tumbling restraints, aka gentle restraints, is a new feature in NES simulations, first introduced in v6.4.0. They are relatively weak restraints that keep the protein from tumbling inside the flask. See the Protein Tumbling Restraints in Short Trajectory MD with Analysis Floe for advantages related to its usage. In principle, the RBFE should not be affected as long as the restraints are applied on the same set of protein atoms across the bound path of the thermodynamic cycle shown in Figure 1.
The user does not have direct control over turning these restraints On or Off for NES. They get applied automatically if they were used in an upstream floe for equilibrium MD simulations on bound ligand(s), for example, in the Short Trajectory MD with Analysis (STMD) or Ligand Bound and Unbound Equilibration for NES Floes. When outputs from these floes are provided as inputs to the Nonequilibrium Switching Floe, tumbling restraint information is checked and applied if they are present. Therefore, if you want protein tumbling restraints for free energy calculations, they must be turned On when these upstream floes are started. If not, these restraints must be turned Off (the default behavior). In the case of the Equilibration and Nonequilibrium Switching Floe, where NES is embedded with equilibrium MD, tumbling restraints can also be turned On or Off when the floe is started. See Protein Tumbling Restraints in STMD for details on th Job Form to manipulate these restraints.
If tumbling restraint information is present, restraints are applied exactly as they were in the upstream floe. This includes the use of the same restraint weight as well as the atoms on which they are applied.
Note
The application of tumbling restraints, though cost-efficient, will affect the dynamics and thus also may affect NES accuracy. In the testing we have done in a variety of retrospective datasets we find that, in general, there is no statistically significant impact on NES accuracy with respect to rank ordering (Kendall’s tau). Users may want to test the use of tumbling restraints on their specific target as part of their overall validation of NES for that target
Caution
If outputs from floes that ran equilibrium MD are combined and used as input to the Nonequilibrium Switching Floe, it must be ensured that:
The tumbling restraint was either On or Off for all floes.
The restraint weights, if tumbling restraint was On, were identical in all floes.
Output datasets from the Short Trajectory MD with Analysis and Ligand Bound and Unbound Equilibration for NES Floes are not mixed.
If any of these conditions are not met, the Nonequilibrium Switching Floe will fail with an explanatory error message.
Caution
Currently, only protein tumbling restraints are forwarded from equilibrium MD to the Nonequilibrium Switching Floe for use in free energy calculations. Any other restraints placed during equilibrium MD runs, such as restraints on protein \(C_{\alpha}\) atoms, are not propagated into NES.
Understanding the Results from NES
The results from the floe are accessed via three main Floe Reports at the end of the running NES job and selectable in the Jobs tab in the Orion Floe page. For this tutorial, we will focus on the results produced by running the Tyk2 receptor and ten selected relative binding affinity calculations.
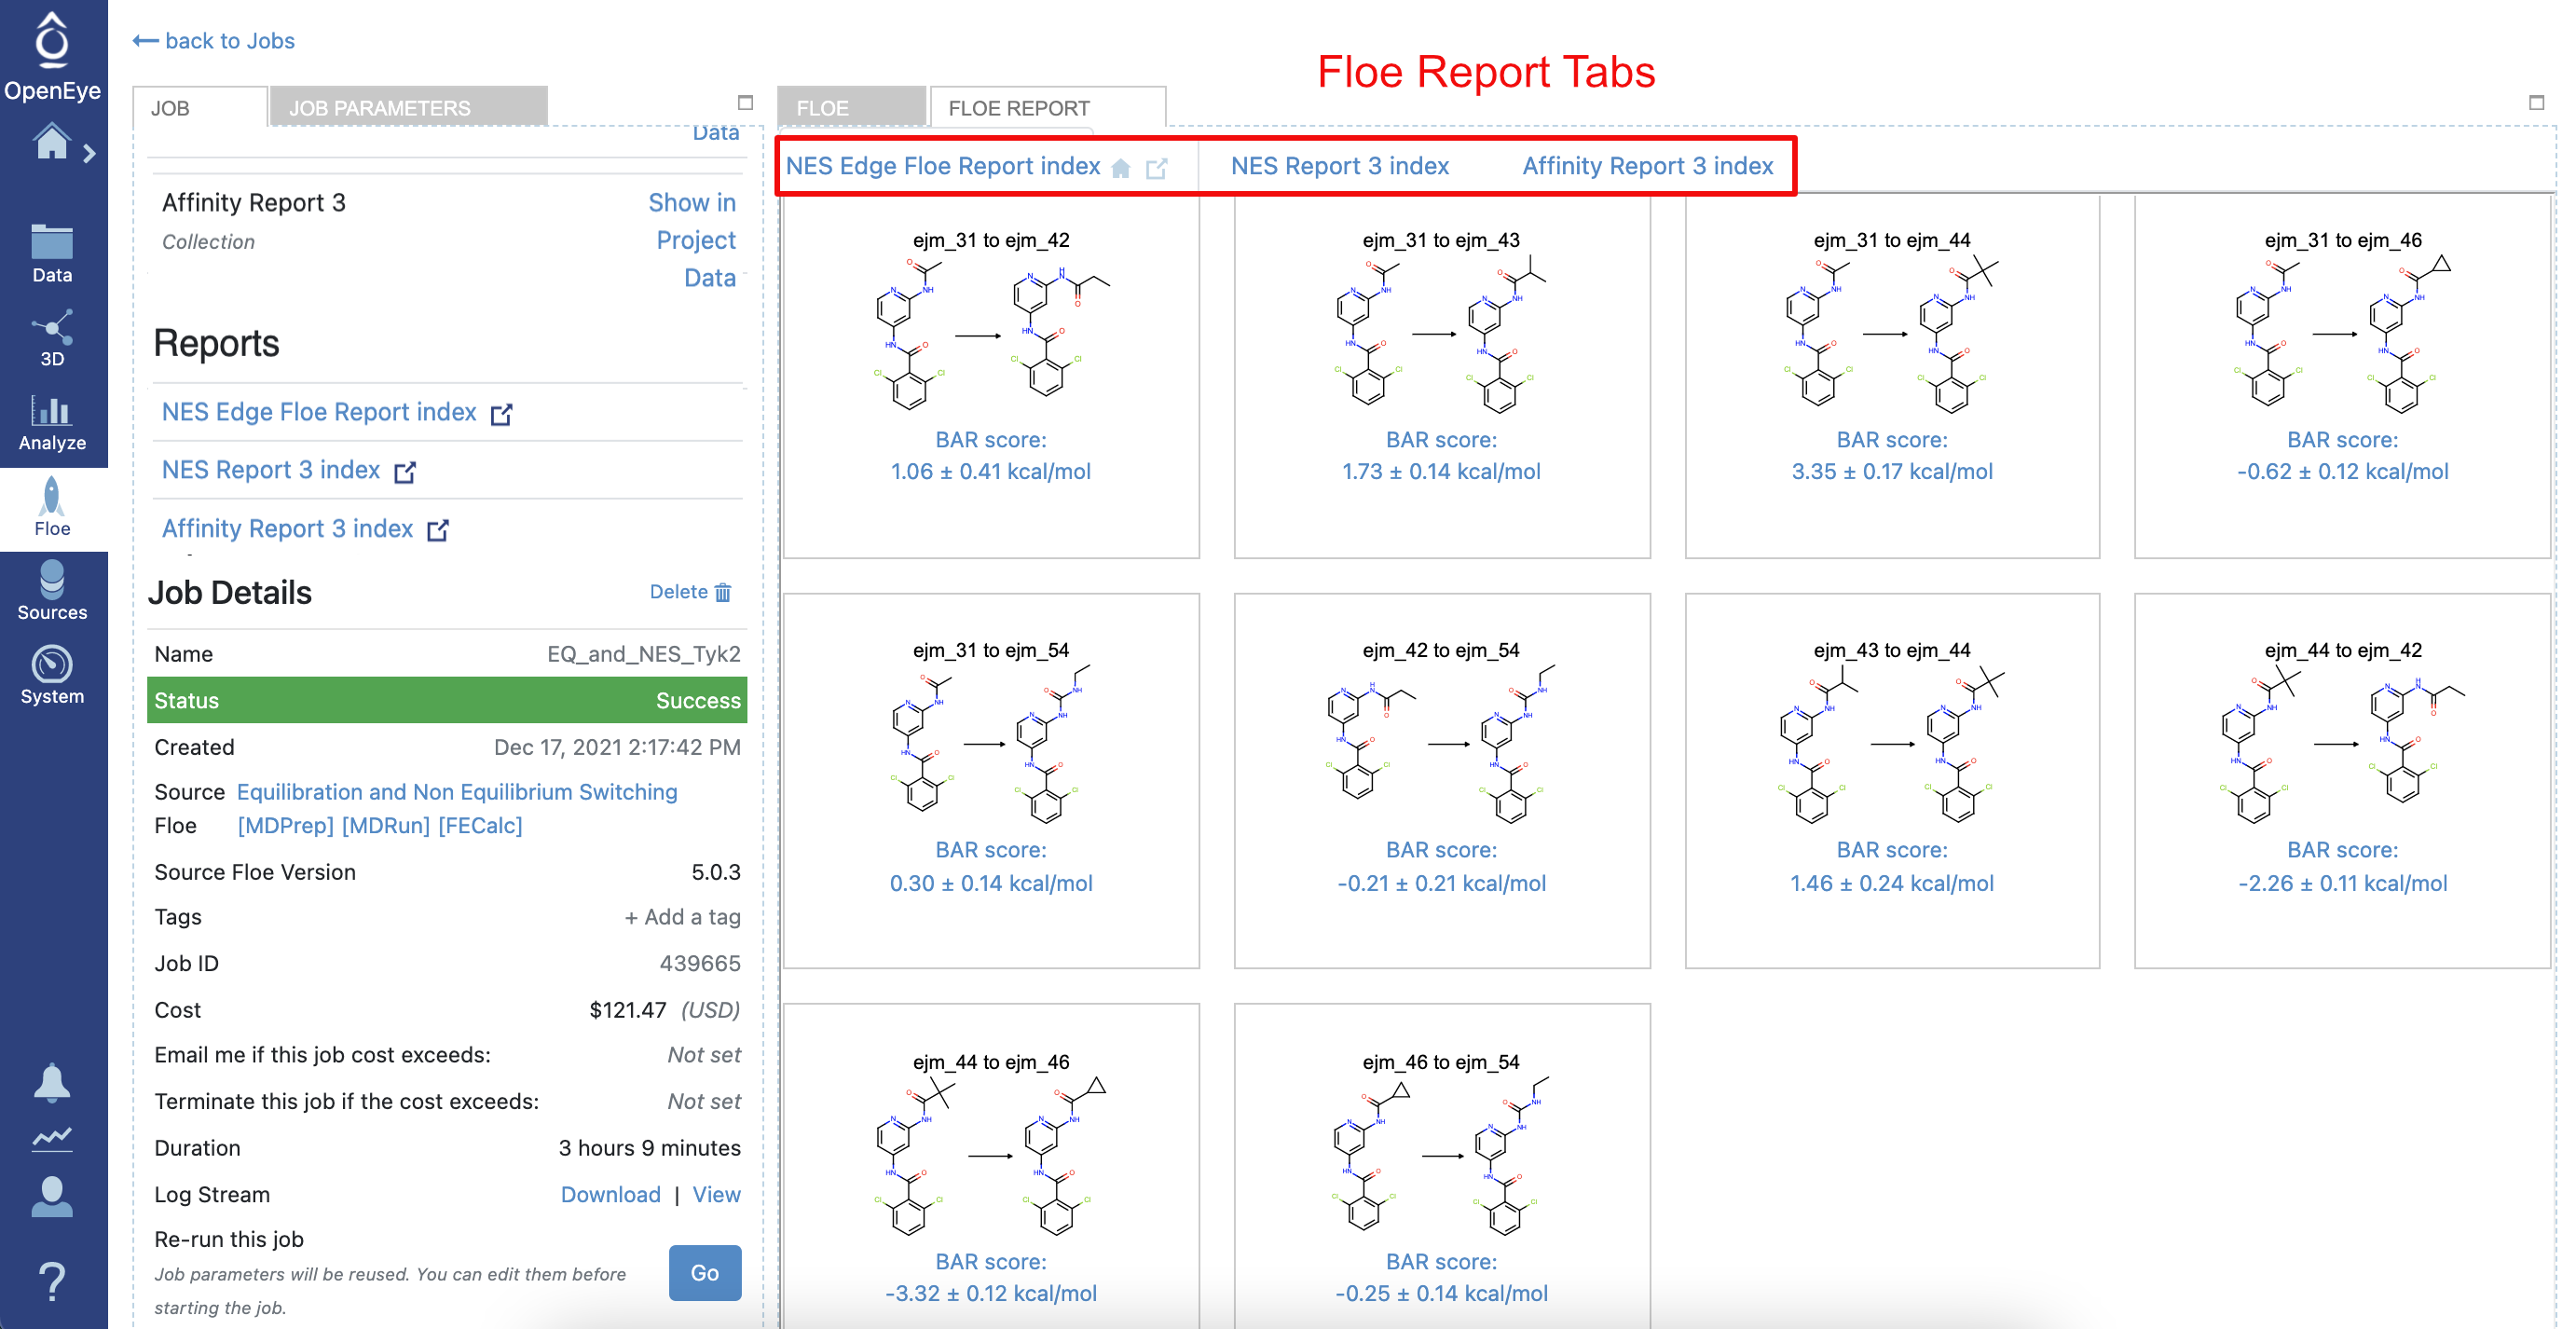
Figure 8. The NES job details and Floe Report.
From the NES job page, the Floe Report is accessible by clicking on the Floe Report tab or from the Reports section on the Job Panel. Here, the most relevant pieces of information are the edges related to the RBFE calculations, each on its own tile. Each tile shows the edge and the predicted RBFE by using the Bennett acceptance ratio (BAR) method for nonequilibrium. In addition, other relevant pieces of information are shown, like the total floe running time and its cost. Clicking on each tile will show important information related to the RBFE calculation. For example, Figure 9 shows the detailed calculation information for the edge involving the ligand ejm_46 to ejm_54.
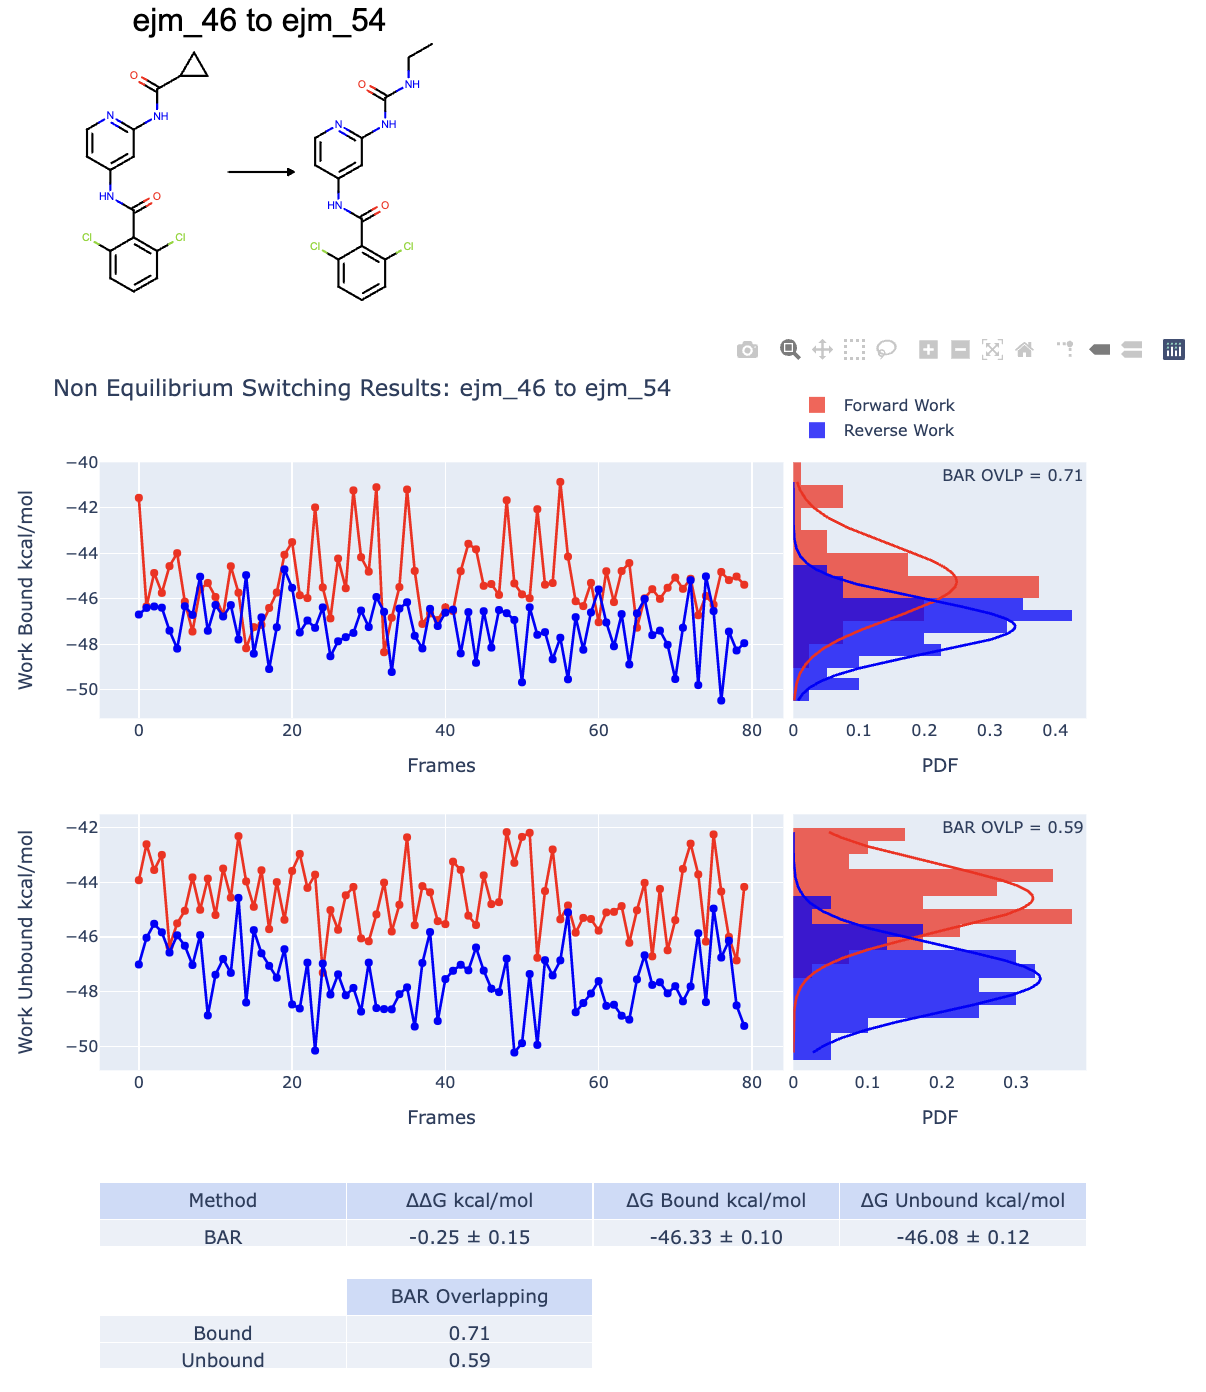
Figure 9. An example of good RBFE calculation data for the ligand ejm_46 to ejm_54.
We have two main plots and tables. The upper and lower plots are respectively related to the bound and unbound NES simulations. We will focus on the bound NES simulations, but the same considerations are true for the unbound simulations. The blue and red graphs plot the calculated forward and reverse NES switching works for each selected starting equilibrium frame. The important message is that if the graphs overlap well, there is a good indication that the computed free energy change is trustworthy and accurate compared to experimental results. The probability distribution plots are made by binning the work values for the forward and reverse works. Again, if the two probability distributions overlap, it is a good sign that the calculation was successful. The work distribution overlap is also estimated by using BAR and is reported in the work plot distribution and in a table. Usually, an overlap value greater than the 0.2 threshold is considered to be a good overlap. Analog considerations are valid for the unbound graph. By using the work values recorded along the switching, it is possible to estimate the free energy changes \(\Delta G_{Bound}\) and \(\Delta G_{Unbound}\) shown in Figure 1. RBFE and alternative thermodynamic paths. and indirectly estimates \(\Delta\Delta G = \Delta G_{Bound} - \Delta G_{UnBound}\). These computed values are reported in a table as well.
Figure 10 reports the RBFE calculations involving the ligand ejm_43 to ejm_54.
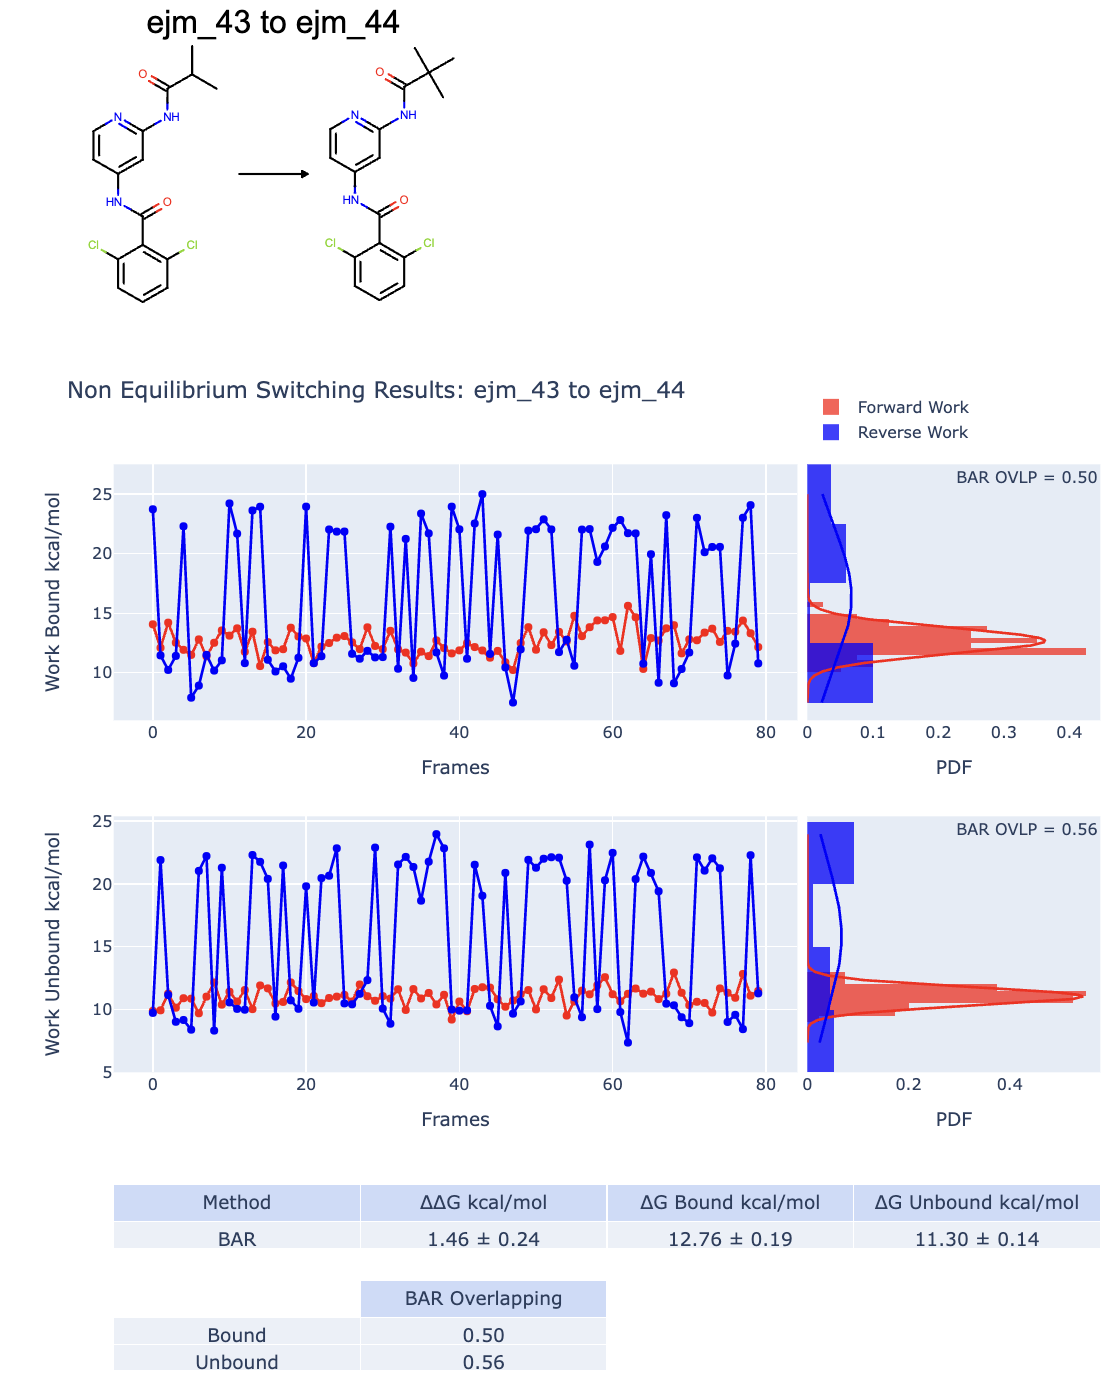
Figure 10. An example of bad RBFE calculation data for the ligand ejm_43 to ejm_54.
In this case, both the bound and unbound graphs and work probability distributions do not overlap well and the results could be unreliable. In this case, the overlap estimate also does not help. Indeed, it seems to be good (>0.2), but the distributions for the bound and unbound cases are bimodal, suggesting that something is wrong along the switching.
Returning to the Job Panel under the Jobs Tab, the edge Floe Report shows the edge graphs for all compounds involved in the edges.
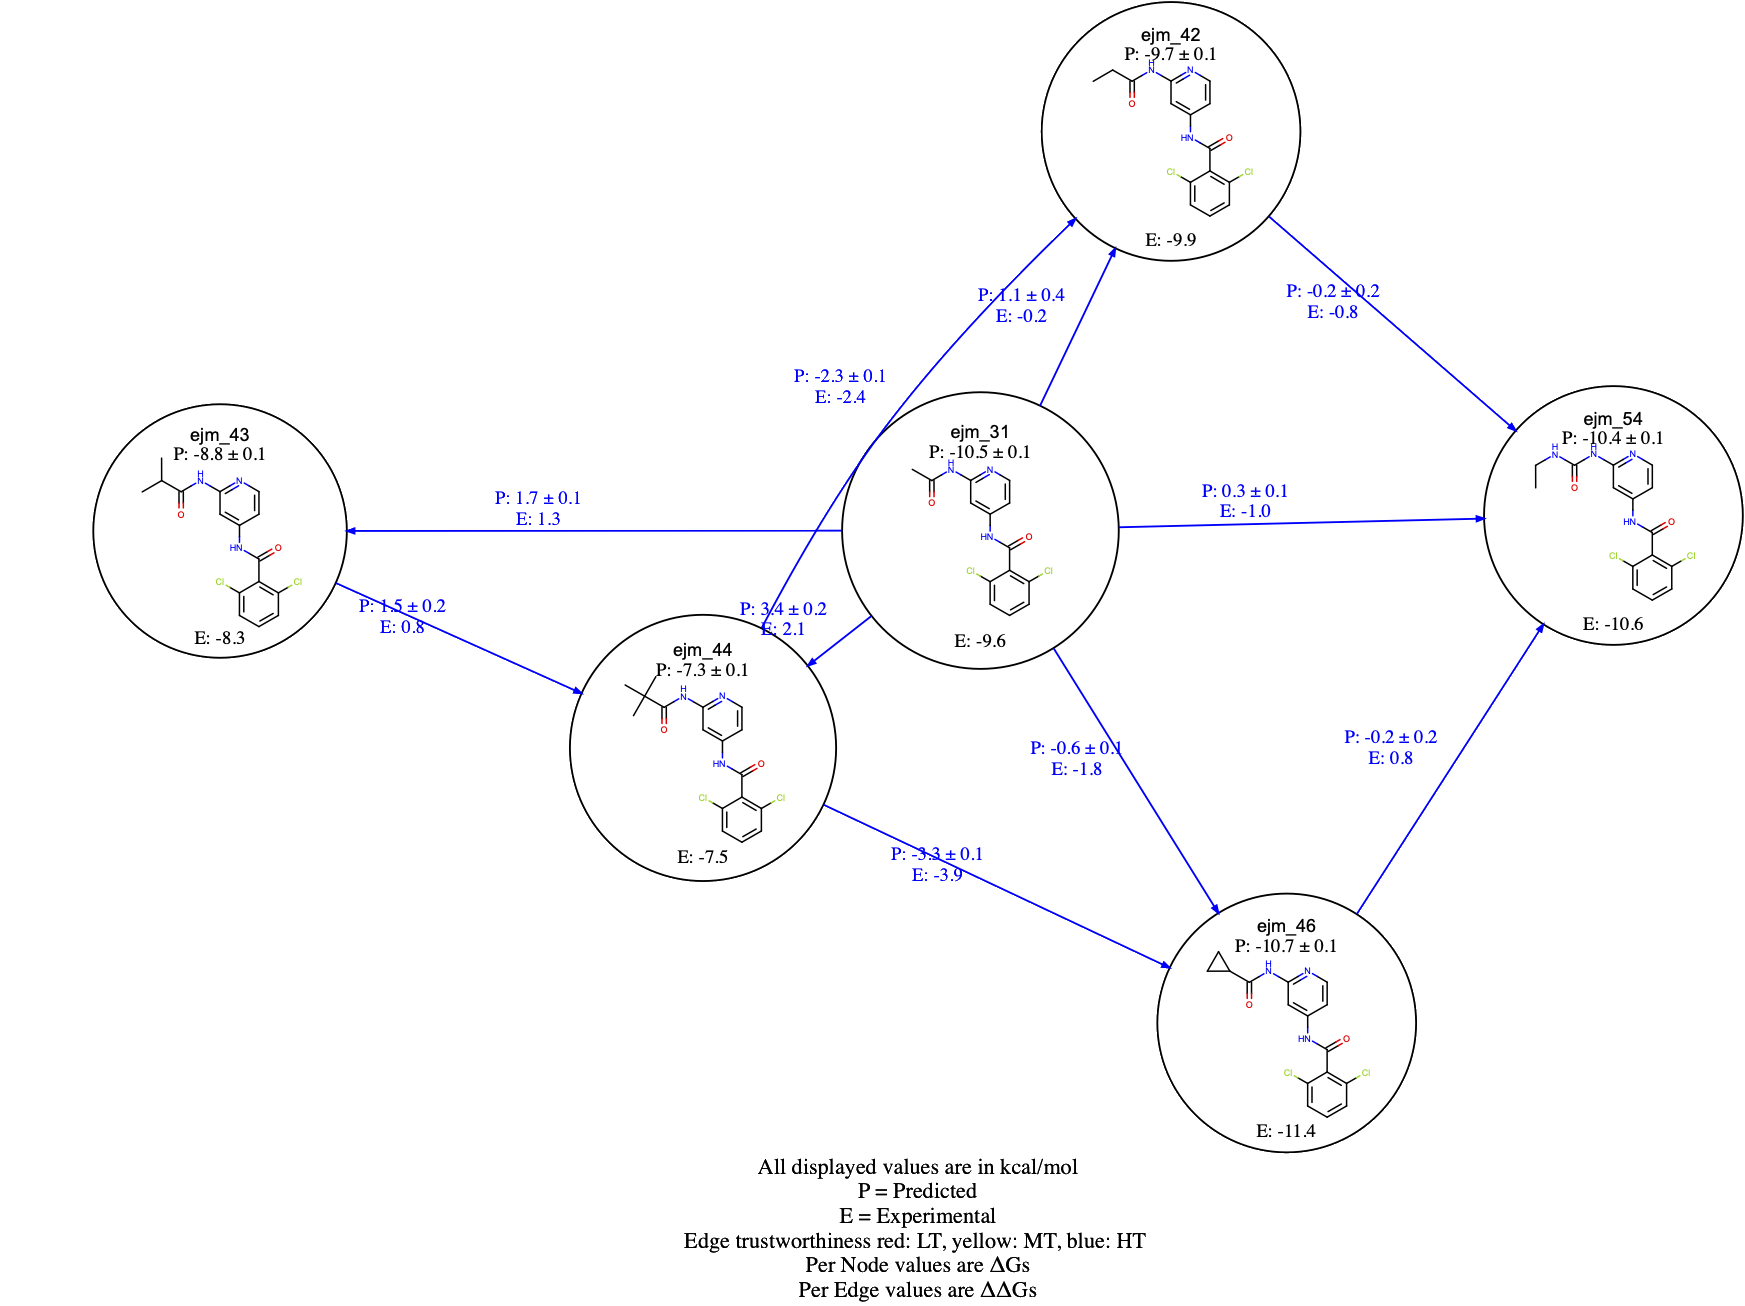
Figure 11. The NES edge Floe Report.
For each edge, the predicted (P) and, if provided, the experimental (E) \(\Delta \Delta Gs\) are shown. For each compound, the predicted (P) and, if provided, the experimental (E) \(\Delta Gs\) are also reported. You should also be able to click on the graph edges and visualize the work distributions. Edges are colored based on the BAR work overlap estimate. In particular, if both bound and unbound work overlap scores are greater than 0.2, then the edges are displayed in blue; if at least one of the bound or unbound work overlap scores is less than 0.2, and the other is greater than 0.2, the edges are displayed in yellow. Finally, if both work overlap scores are less than 0.2, then the edges are colored in red. An example of edge coloring is shown in Figure 12 for the CDK2 dataset edges.
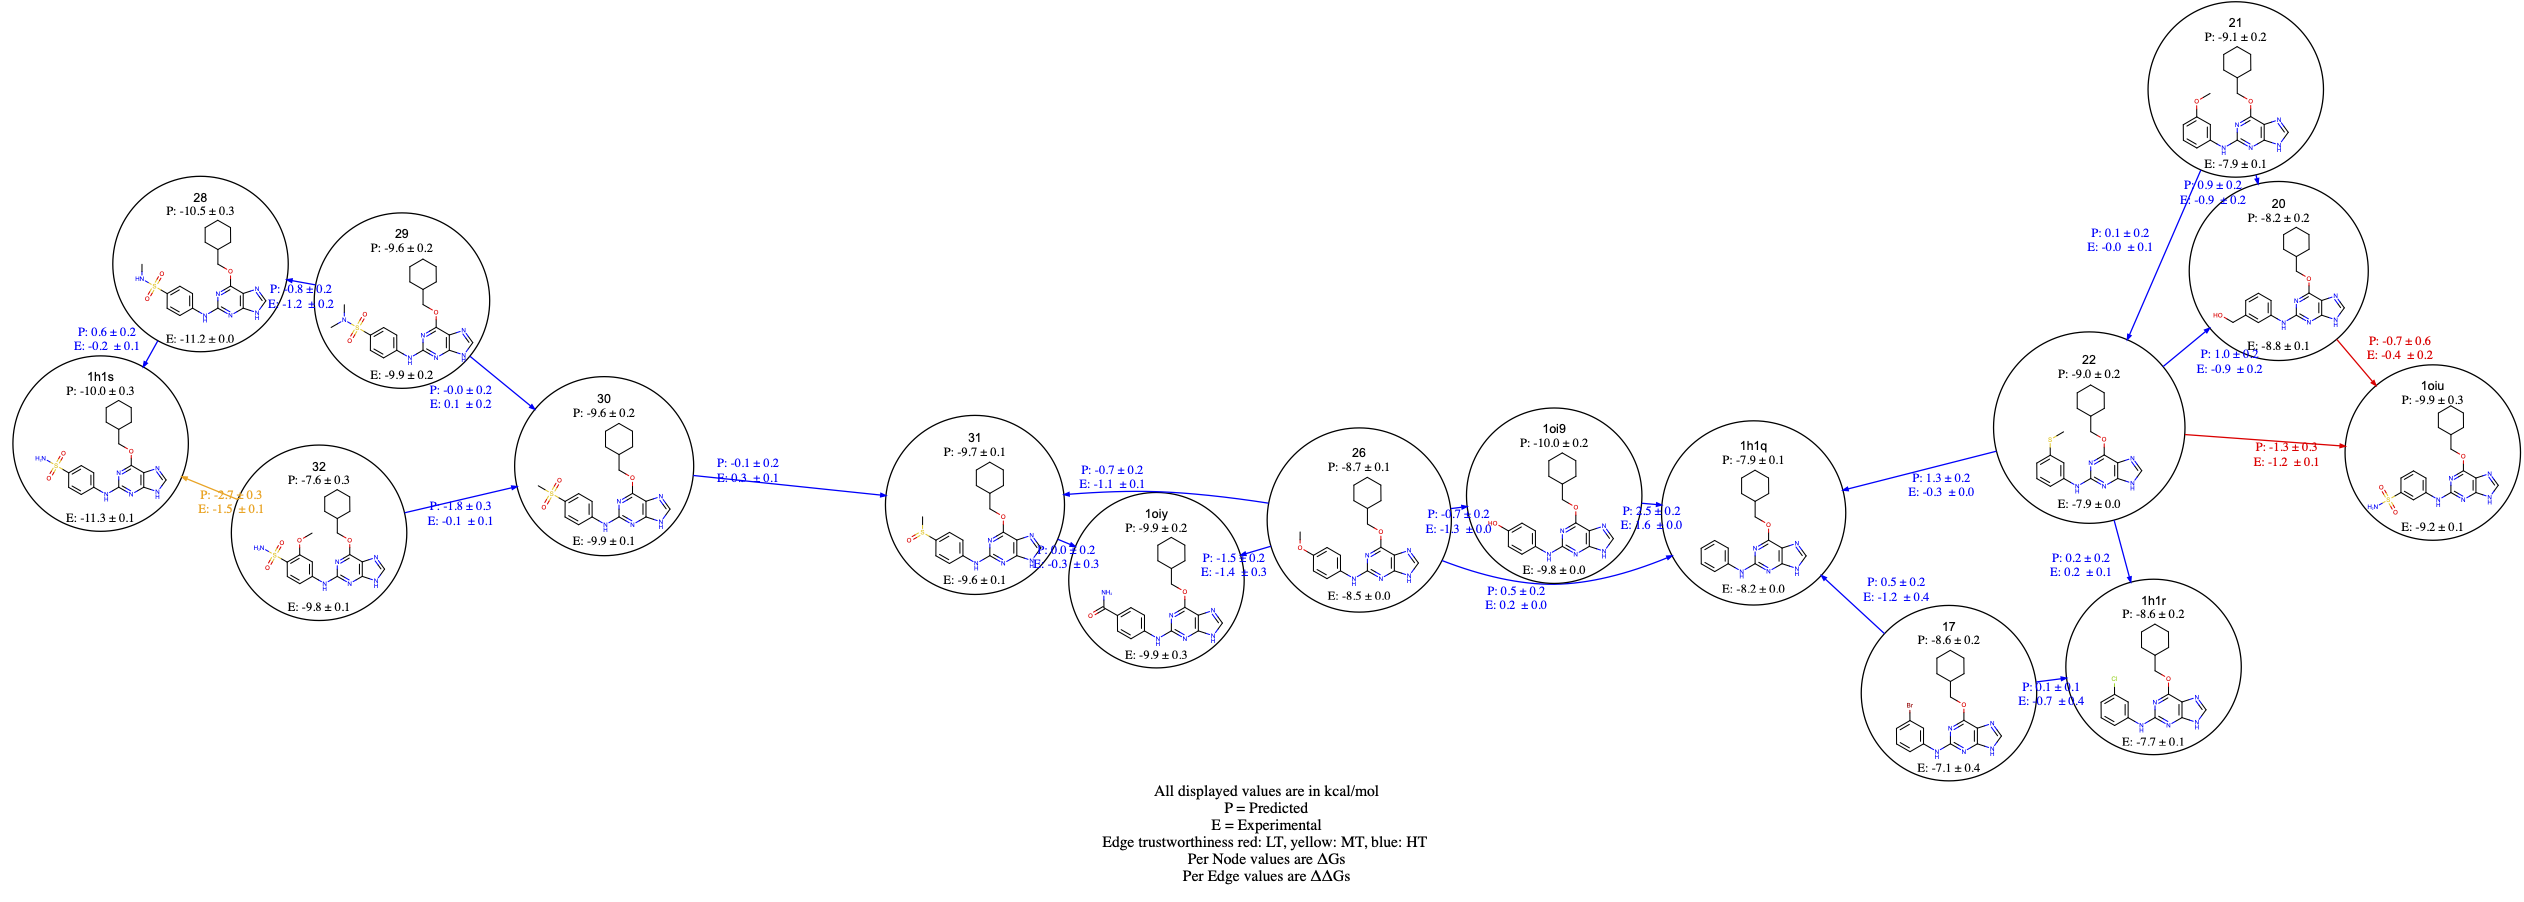
Figure 12. NES edge coloring.
The final Floe Report is the affinity report, which shows two main sections. In the first section, experimental and predicted affinities are compared. Here, a graph between \(\Delta G_{Experimental}\) vs \(\Delta G_{Predicted}\) is shown. This graph is available if the experimental affinity file has been provided and the ligand edge map is connected enough to make affinity predictions.
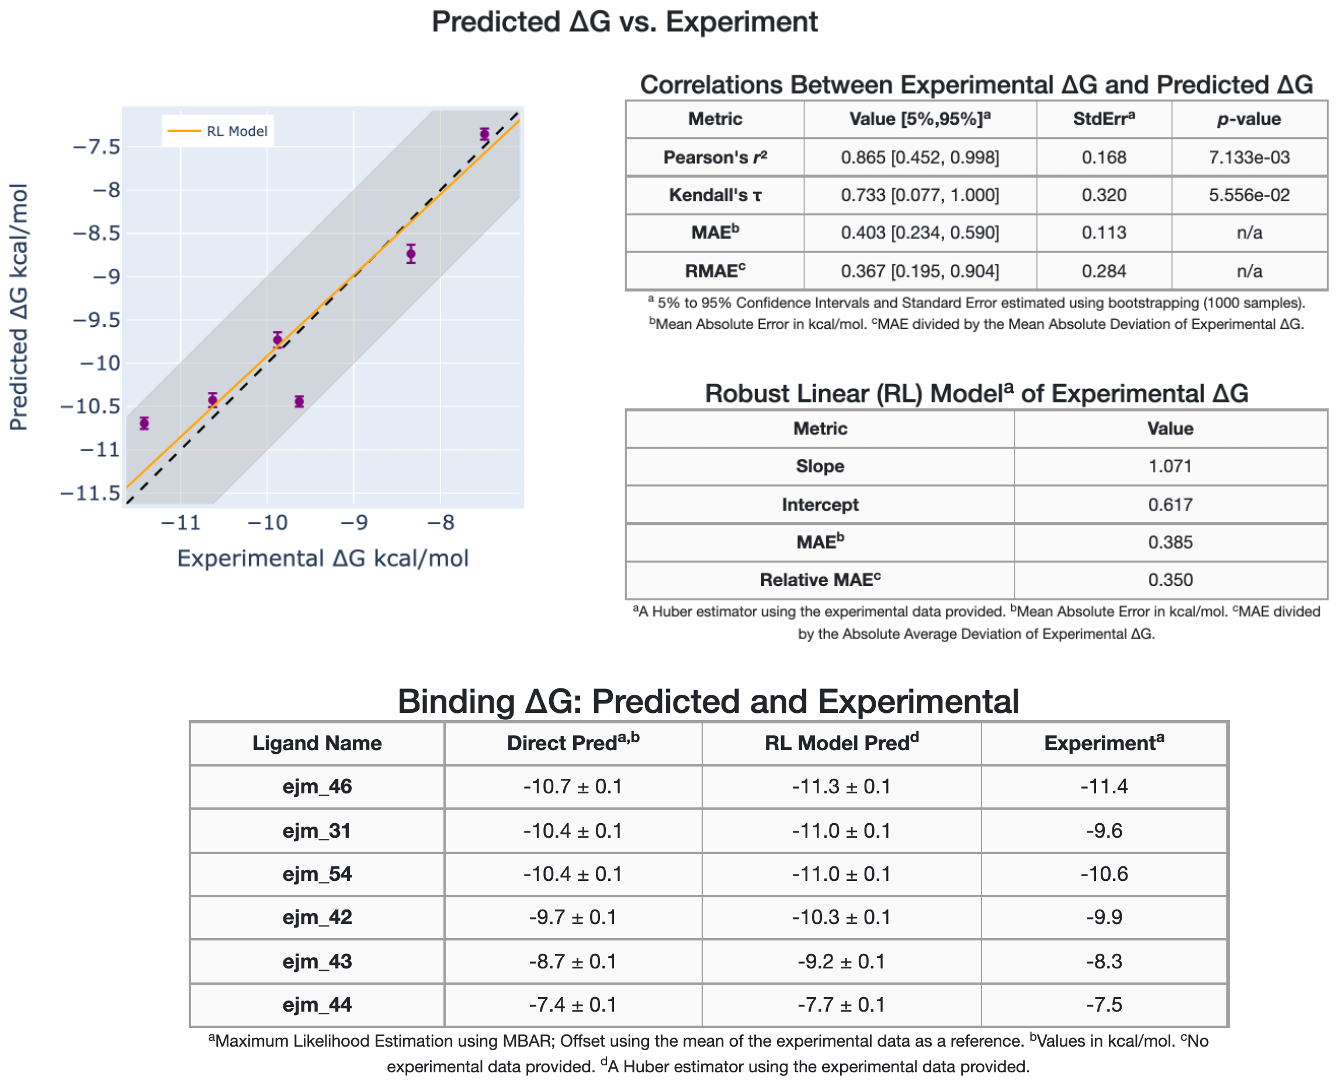
Figure 13. Experimental versus predicted affinities.
In addition, the graph data are tabulated and different statistical metrics are shown, such as correlation metrics and linear models. The second section of the affinity report shows a comparison between the experimental and predicted relative binding affinities, \(\Delta\Delta G_{Experimental}\) versus \(\Delta\Delta G_{Predicted}\), in addition to statistical metrics.
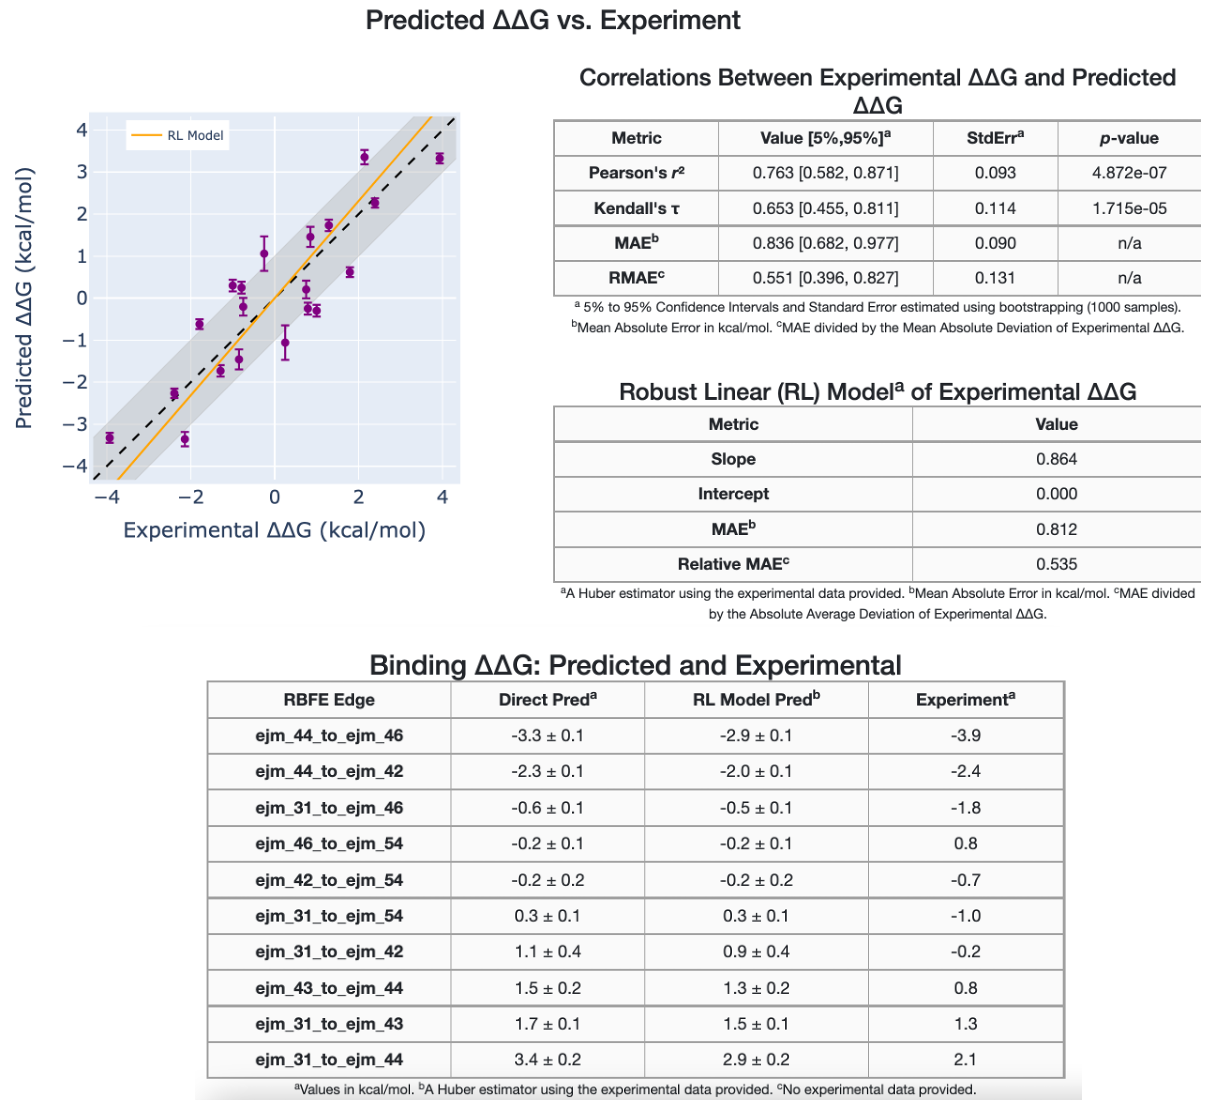
Figure 14. Experimental versus predicted relative binding affinities.
In addition to the NES and the affinity Floe Reports, the results themselves are uploaded to Orion S3 in .tar.gz file format, ready to be locally downloaded. These files contain all the NES and affinity data provided in .csv file formats that can be used for a more detailed analysis, as well as the .html reports. The result files generated for the Tyk2 receptor NES run can be downloaded here:
Providing Experimental Affinity Inputs
Experimental affinity values of ligands are used to generate comparison plots and tables between experimental and predicted results for \(\Delta\Delta Gs\) and \(\Delta Gs\) in the Floe Reports. A number of other performance statistics are also reported in a table accompanying these plots, which can be used to evaluate the quality of predictions made by NES.
Experimental affinities of ligands can be provided via a dataset or via a syntax-bound text file.
Experimental affinity provided via a dataset
Affinity data can be read directly from the Ligand Input Dataset. Users must, however, specify the column of the dataset, which contain affinity data and optionally, the error in the affinity data. The units of the affinity data must also be specified.
In the Experimental Affinities (From Ligand Input Dataset) parameter group (right below Inputs) the aforementioned columns and units can be selected.
Use Column in the dataset with experimental affinity values: to select the column that contains experimental affinity values. It only displays the columns from the datasets that have been input into the job form thus far.
Units for affinities in the dataset: displays a drop down menu of units. Select the one in which the affinity values are to be read. If affinities are in \(IC_{50}\), \(K_{I}\), etc. then select
'pM', 'nM', 'uM', 'mM'or'M'. If affinities are in \(pIC_{50}\), \(pK_{I}\), etc. then selectlog. If, however, affinities are in free energies, select kcal/mol or kJ/mol.Use Column in the dataset with experimental affinity error values: to select the column that contains the error associated with the experimental affinity values. If not present, error is assumed to be 0.0.
Experimental affinity provided via a text file
Affinity data can also be provided via a text file using parameters in the Experimental Affinities (From Text File) group (right below the Experimental Affinities (From Ligand Input Dataset)).
Provide the file to the parameter called Ligand Affinity Experimental file
If the file is in CSV format, chose
,(comma) as the delimiter from the drop down menu. The default is whitespace(s).(Optional) Select the appropriate Units if the text file doesn’t have any. This selection is applied to all the entries (i.e. lines) of the file.
All lines in this file can have one of the two syntaxes.
Whitespace delimited format:
[ligand] [affinity] [{optional} error] [{optional} units]CSV format:
[ligand], [affinity], [{optional} error], [{optional} units]
ligand is the molecule name,affinity the experimental affinity,error the error in the experimental affinity. When absent, it is assumed to be 0.0.units in 'kcal/mol', 'kJ/mol', 'pM', 'nM', 'uM', 'mM', 'M', 'log'. When log is chosen, it is understood to mean \(pIC_{50}\), \(pK_{I}\), etc.The fields can be separated by contiguous whitespaces (includes tabs) or by a single comma (,). This allows for the use of CSV files. Default delimiter is whitespace(s). If comma is to be used (i.e. CSV files), it must be selected as the delimiter.
Mixing syntaxes
Mixing of the two kinds of syntaxes in a single file is not allowed. It will result in error and the floe will fail.
As mentioned above, in the absence of units a choice can be made from a drop-down menu. This choice is imposed on all the affinity values.
Mixing units
It is also possible to mix affinity values with different units. This is useful when values from multiple rounds of rational design, or different sources are combined and the experimental affinities are in different units. If some ligands don’t have units while others do, the Units selected from the drop-down menu is imposed on the values with missing units.
Affinity conversion table
Conversion of experimental affinity to kcal/mol is printed in the Affinity Floe Report. The following formulae are used:
Input Affinity |
Conversion to kcal/mol |
|---|---|
\(x~\pm~\epsilon~kcal/mol\) |
No conversion |
\(x~\pm~\epsilon~kJ/mol\) |
\(x/4.184~\pm~\epsilon/4.184\) |
\(x~\pm~\epsilon~(M|mM|uM|nM|pM)\)
e.g. \(K_I\), \(K_D\), \(IC_{50}\).
Can be generalised to quantities for which a smaller
concentration value implies a higher affinity.
|
\(RT~ln~x~\pm~|RT\epsilon/x|\)
Input affinity \(x\) is converted to Molar (M) before applying the conversion formula.
T is temperature. Default 300 K.
|
\(x~\pm~\epsilon~(log)\)
e.g. \(pK_I\), \(pK_D\), \(pIC_{50}\).
|
\(-RT~x/log_{10}e~\pm~|RT\epsilon/log_{10}e|\)
\(x\) is assumed to have been derived from concentration in Molar (M),
i.e. \(x=-log_{10}(conc~in~M)\)
|