Tutorial: Generate Ionization States and Calculate LogD
The Generate Ionization States and Calculate LogD Floe allows you to find the dominant ionization state(s) at a specified pH for each molecule in a dataset.
This floe predicts the micro-pKas for all possible microtransitions and then calculates the macro-pKa values. Using micro- and macro-pKas, it calculates the fraction of each microstate (ionization state) at a chosen environmental pH and generates an output dataset of significant ionization states. By default, the floe calculates that at pH 7.4 (physiological pH). It also calculates logD at the chosen environmental pH.
By default, this floe identifies only one most dominant ionization state. You can choose to save multiple ionization states (if they are available). In that case, it will create multiple records, one for each high probability ionization state identified at the chosen environmental pH.
By default, this floe replaces the primary molecule field of the input dataset. You can choose not to overwrite the original primary molecule field of the input dataset by providing a name for the newly created field to save the significant states.
The estimated cost of the Generate Ionization States and Calculate LogD Floe run is approximately $0.01/molecule.
Running the Floe
Find the Floe
Click the “Floe” button on the navigation bar to reach the Floe page.
Click on the Floes tab.
From the Categories Floe Filters, click on the ‘Packages’ drop-down to expand the list of packages, then select the OpenEye pKa Prediction Floes package.
A list of the pKa Prediction floes will now be visible to the right. Select the Generate Ionization States and Calculate LogD Floe.
Alternatively, you can enter the name of the floe in the search bar.
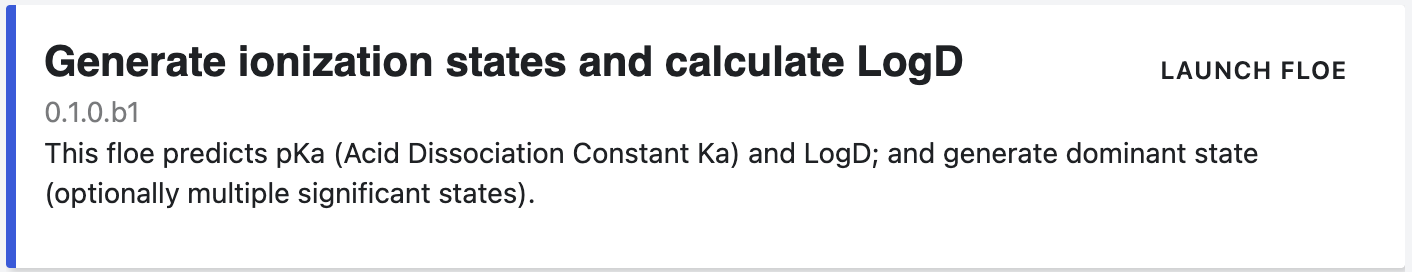
Figure 1. The brief description of the Generate Ionization States and Calculate LogD Floe.
Click the “Launch Floe” button to open the Job Form.
Floe Parameters
Specify the parameter settings as indicated below.
Output Path: Select the path where you want to save output of this floe.
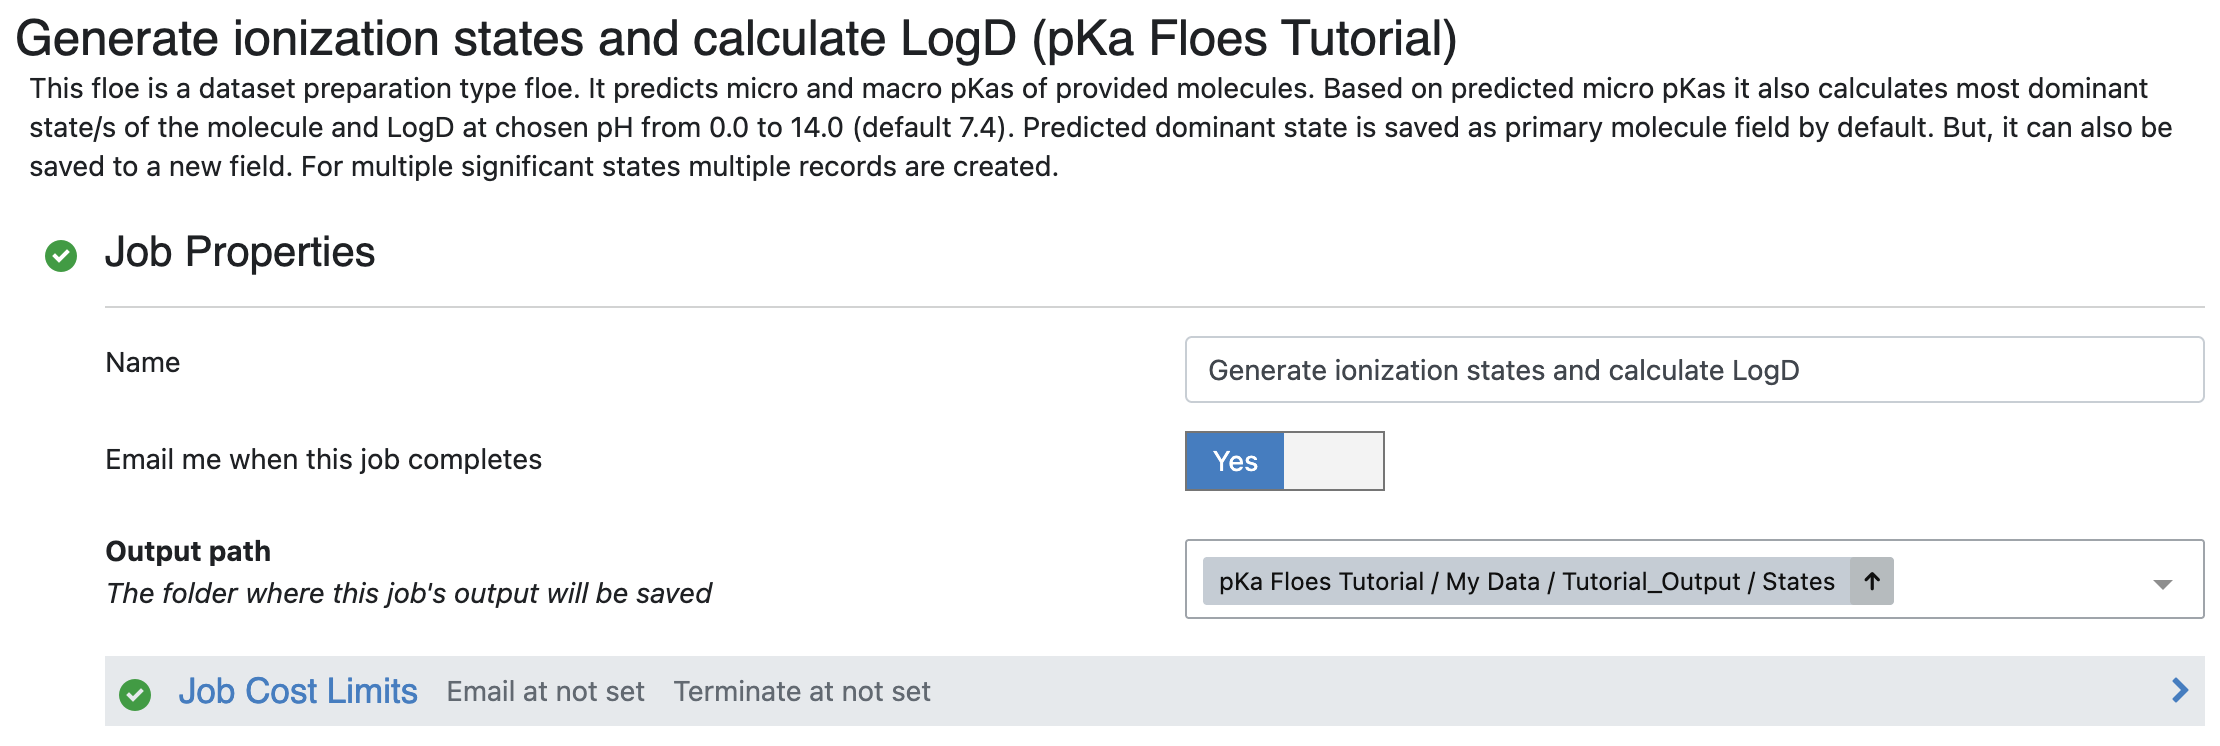
Figure 2. The output path for the floe.
Inputs
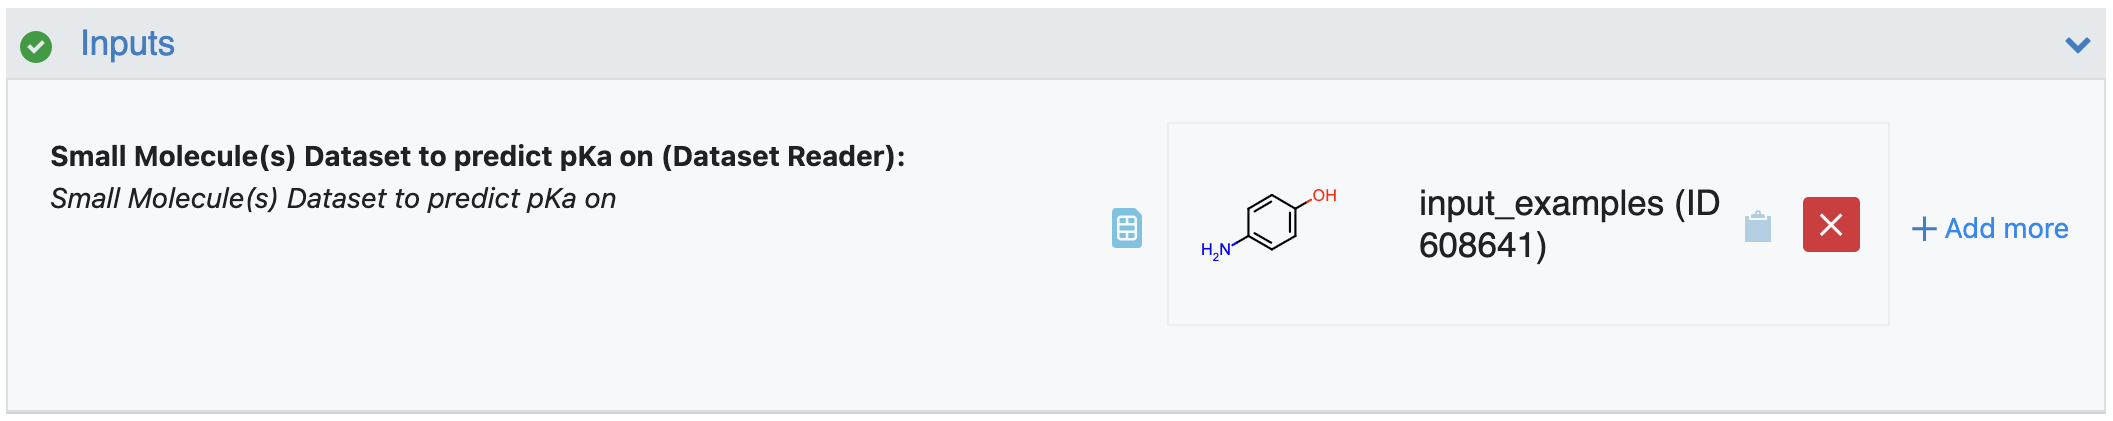
Figure 3. The tutorial input dataset.
Small Molecule(s) Dataset to Predict pKa On: This is the input dataset for the floe. Ionization states will be generated for the primary molecule on each record. For this tutorial, select ‘input_examples’ as the input dataset. This example input dataset contains five molecules. Figure 4 shows the molecules in this dataset.
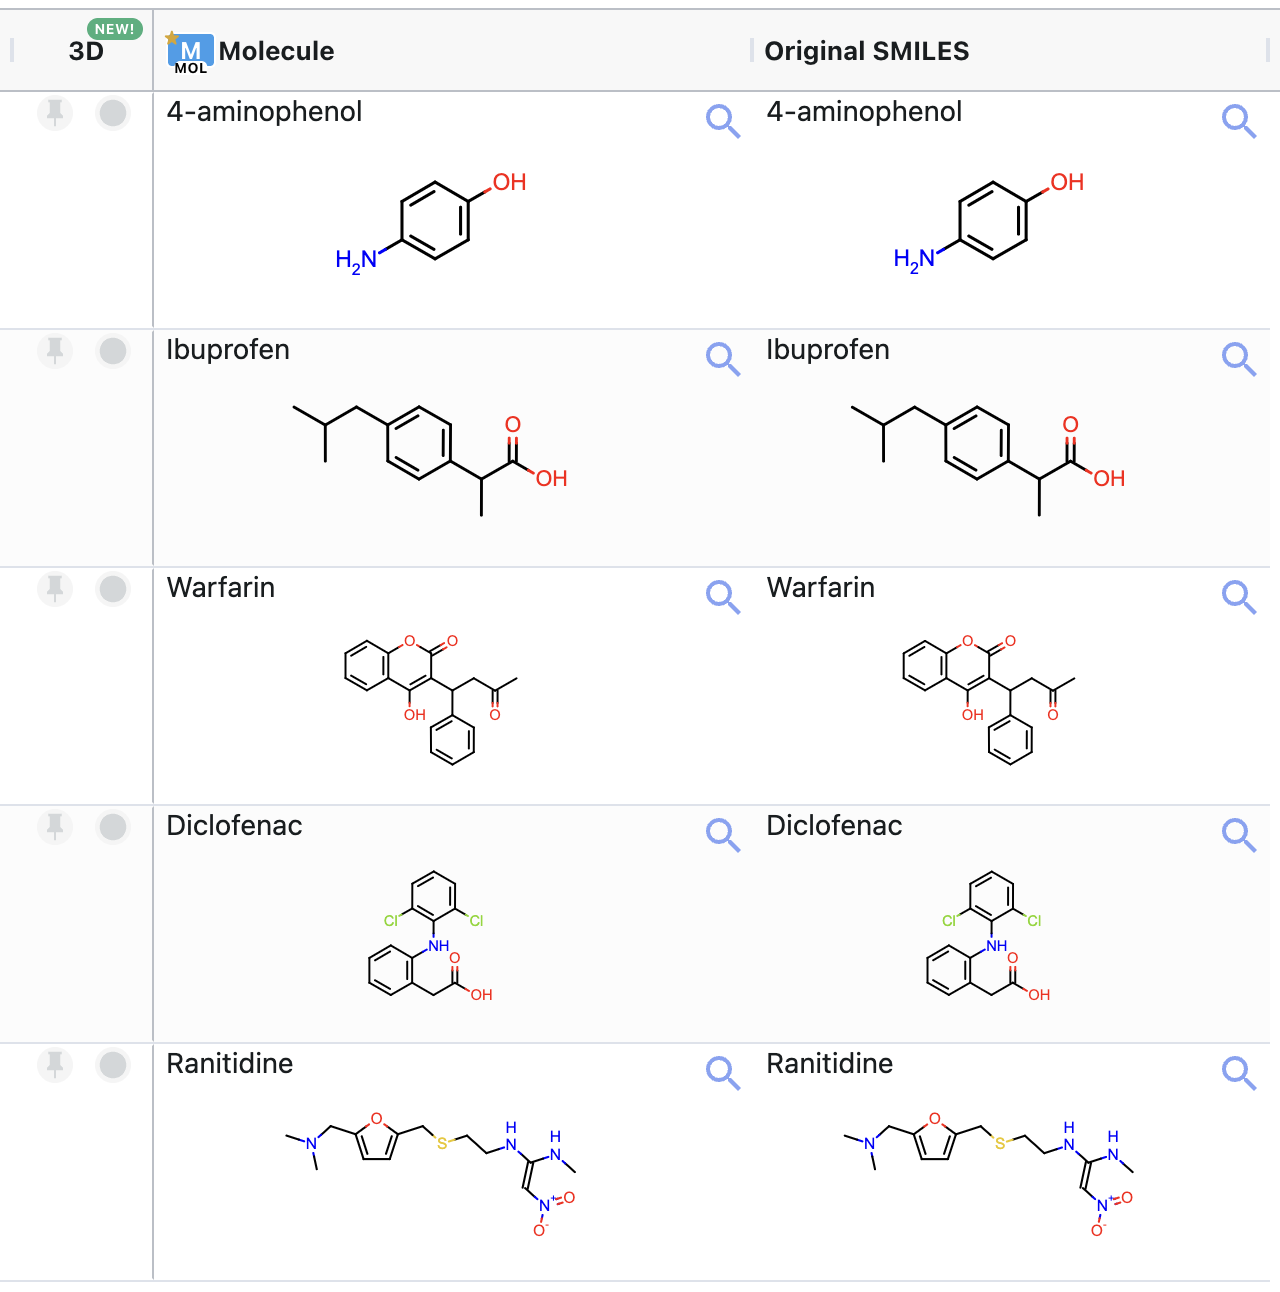
Figure 4. Structures of the molecules in the sample input dataset.
The sample pKa dataset for this tutorial can be downloaded here.
Input Example Dataset
Outputs
Significant Microstates: This parameter specifies the name of the output dataset which will contain significant microstates. For this tutorial, use ‘tutorial_examples_significant_states’.
Significant Ionization State Molecule Field: By default, the floe will replace the PrimaryMolField and use the name specified here to store the significant state of the molecule. If you do not want to modify the original PrimaryMolField, you can provide a new field name here and the floe will create an additional significant state field with this name. For this tutorial, a new field has been specified (see Figure 5).
Failed Descriptors Calculation: This parameter allows you to specify the output dataset of records where the floe failed to calculate descriptors. Here it is listed as ‘tutorial_examples_descriptors_failed’.
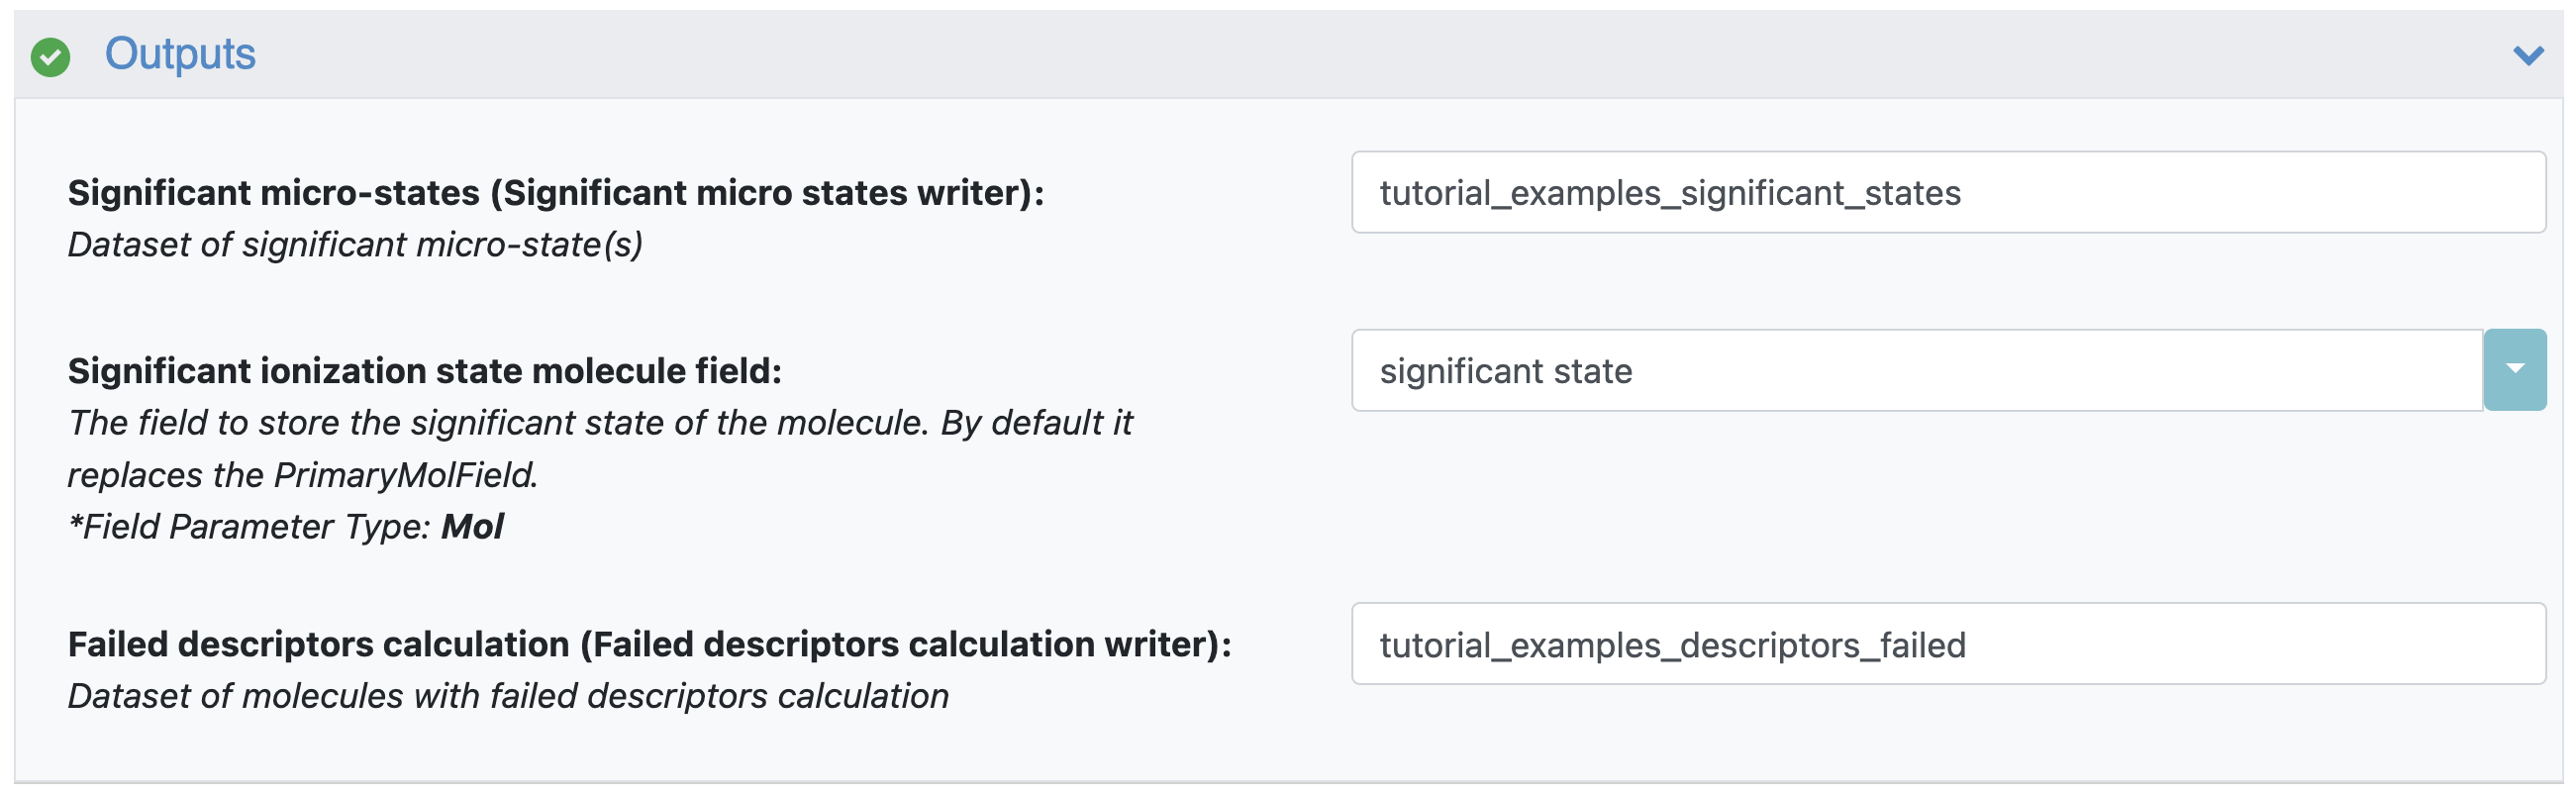
Figure 5. The floe output parameters.
Options
Get Multiple Significant States: By default, the floe will find only one most dominant ionization state. You can choose to save multiple significant states (if available). Turn this option On.
Calculate LogD: Use this parameter to select whether to calculate this value. By default, it is On.
Environment pH: By default, the floe has the environment pH set to 7.4, at which the floe will calculate the fraction of all ionization states and LogD. You can choose the environment pH to be anywhere from 0.0 to 14.0.
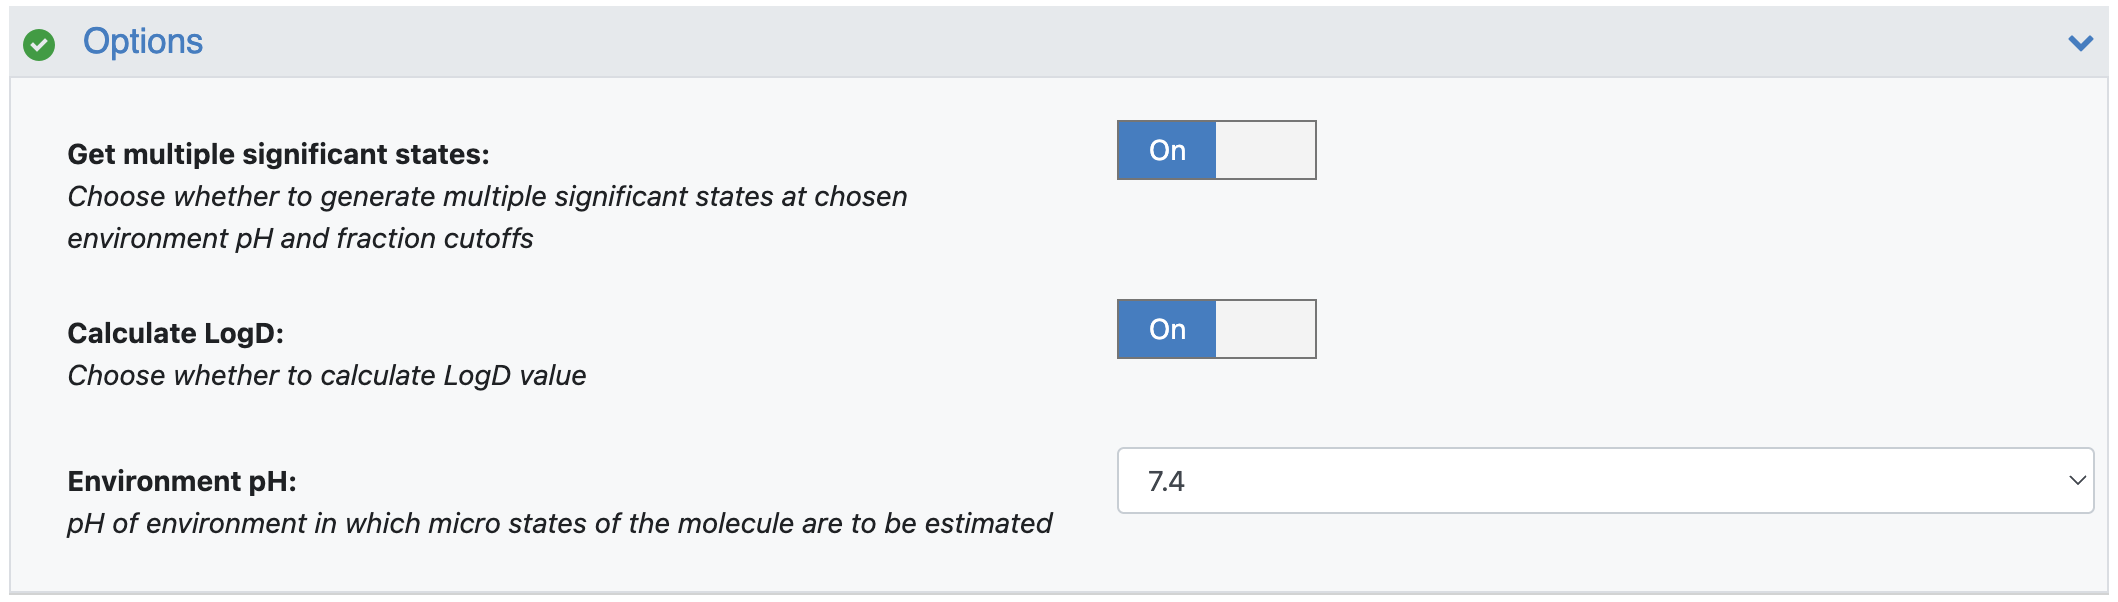
Figure 6. Filled parameters under the Options floe parameters.
Advanced Options
Cutoff for Ionizable Groups Count: This parameter is explained in the FAQs. It can be modified if you would like a smaller or larger number of groups to be processed in detail. Please note that an increase in the ionizable groups count may result in an exponential increase in the number of microstates and microtransitions.
Percentage Cutoff for Macrostate: This parameter value is required to decide which macrostates are significant at given pH. The default value is 20. Thus all macrostates with a percentage fraction higher than 20% at a selected environment pH are considered significant.
Percentage Cutoff for Microstates within the Macrostate: A macrostate might consist of more than one microstate. Their respective pKa values decide their fraction within the macrostate. If a microstate contributes only 5% to its overall macrostate, that microstate will not be considered significant. Thus this parameter (default 35%) decides which microstates are significant within a macrostate. The overall fraction of a microstate at chosen environment pH is calculated based on the fractions of the macrostate and each microstate within that macrostate.
Supporting Experimental pKa Data File: This parameter is not required in general usage. But if you have experimental data that you would like to use to affect or improve the prediction of the model employed in this package, you can prepare a supporting data file to use in the Prepare Supporting Experimental pKa Data File Floe. Specify the name of the output file of that floe here. The tutorial explains this parameter in detail.
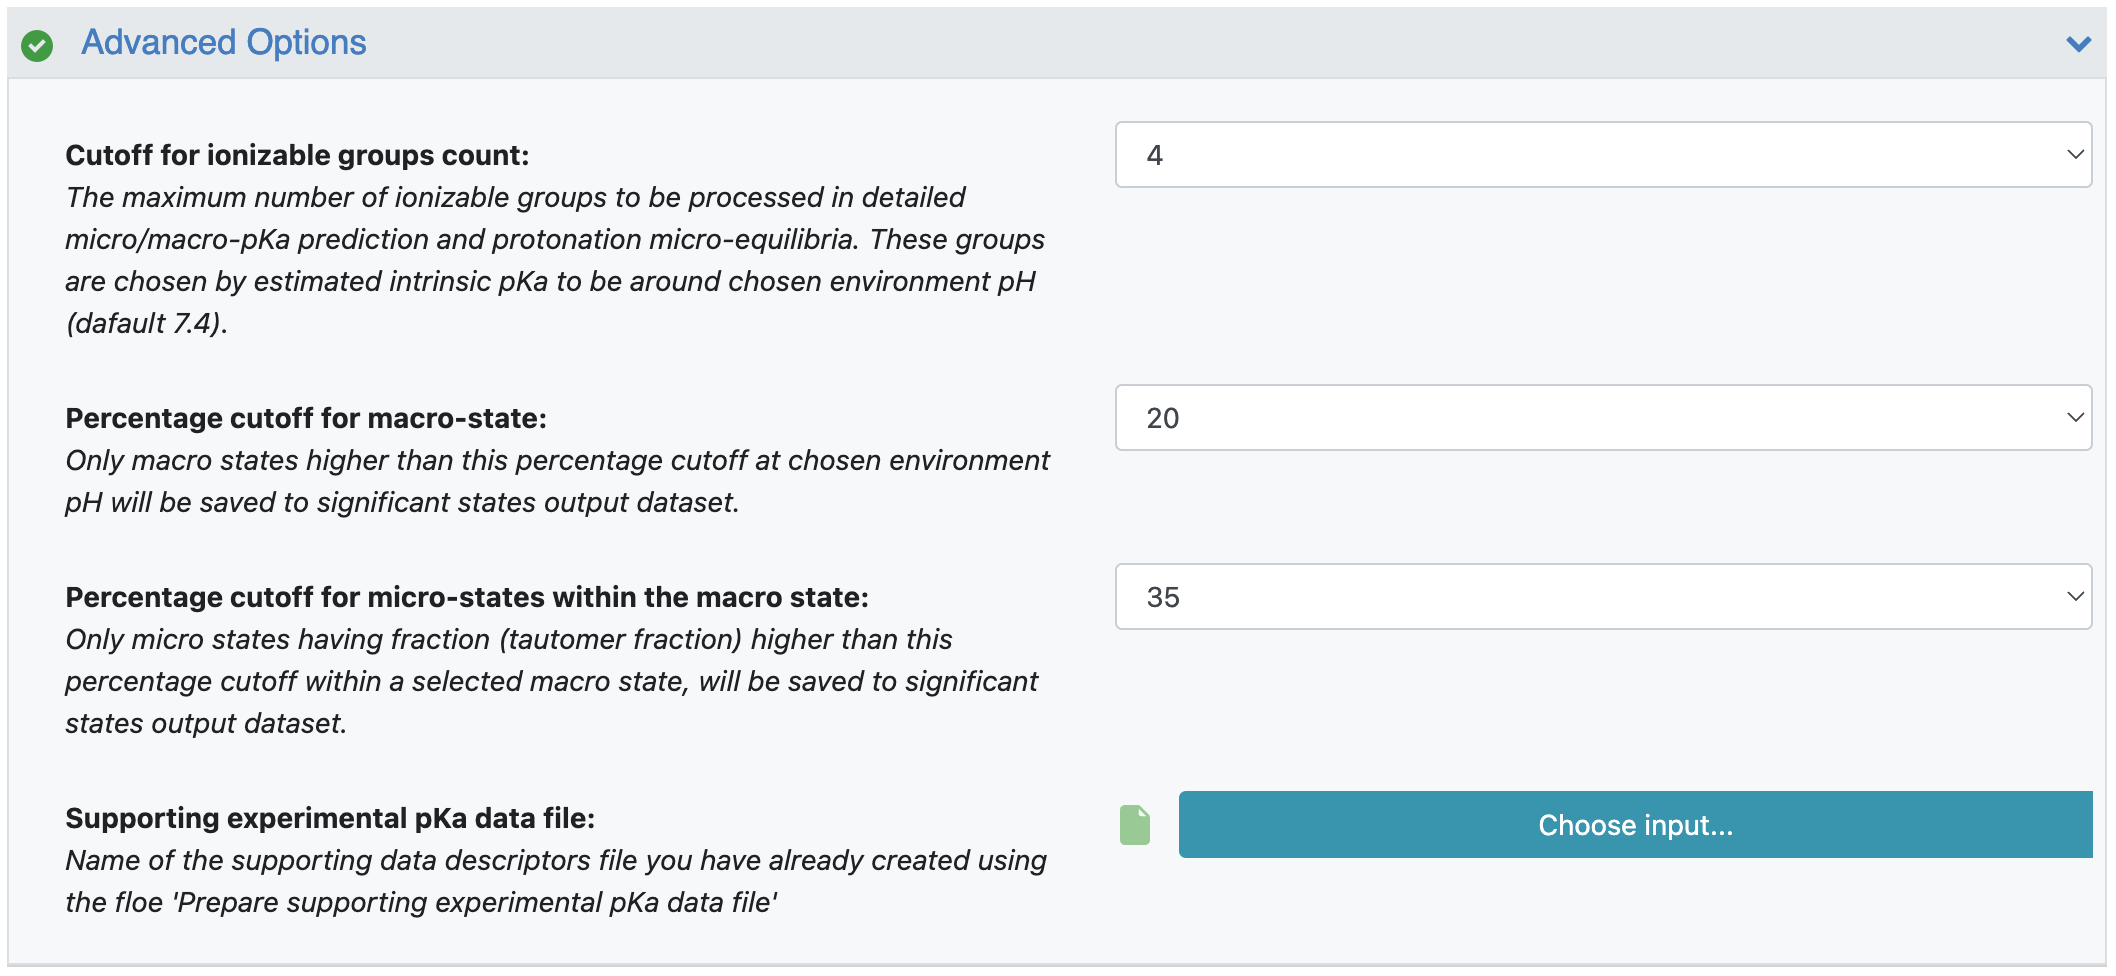
Figure 7. Filled parameters under the Advanced Options floe parameters.
When all parameters have been set, click the “Start Job” button to run the floe.
Floe Results
The job should finish in a few minutes. Figure 8 shows that the floe generated six significant states. In addition, the molecule descriptor calculation did not fail for any molecules.
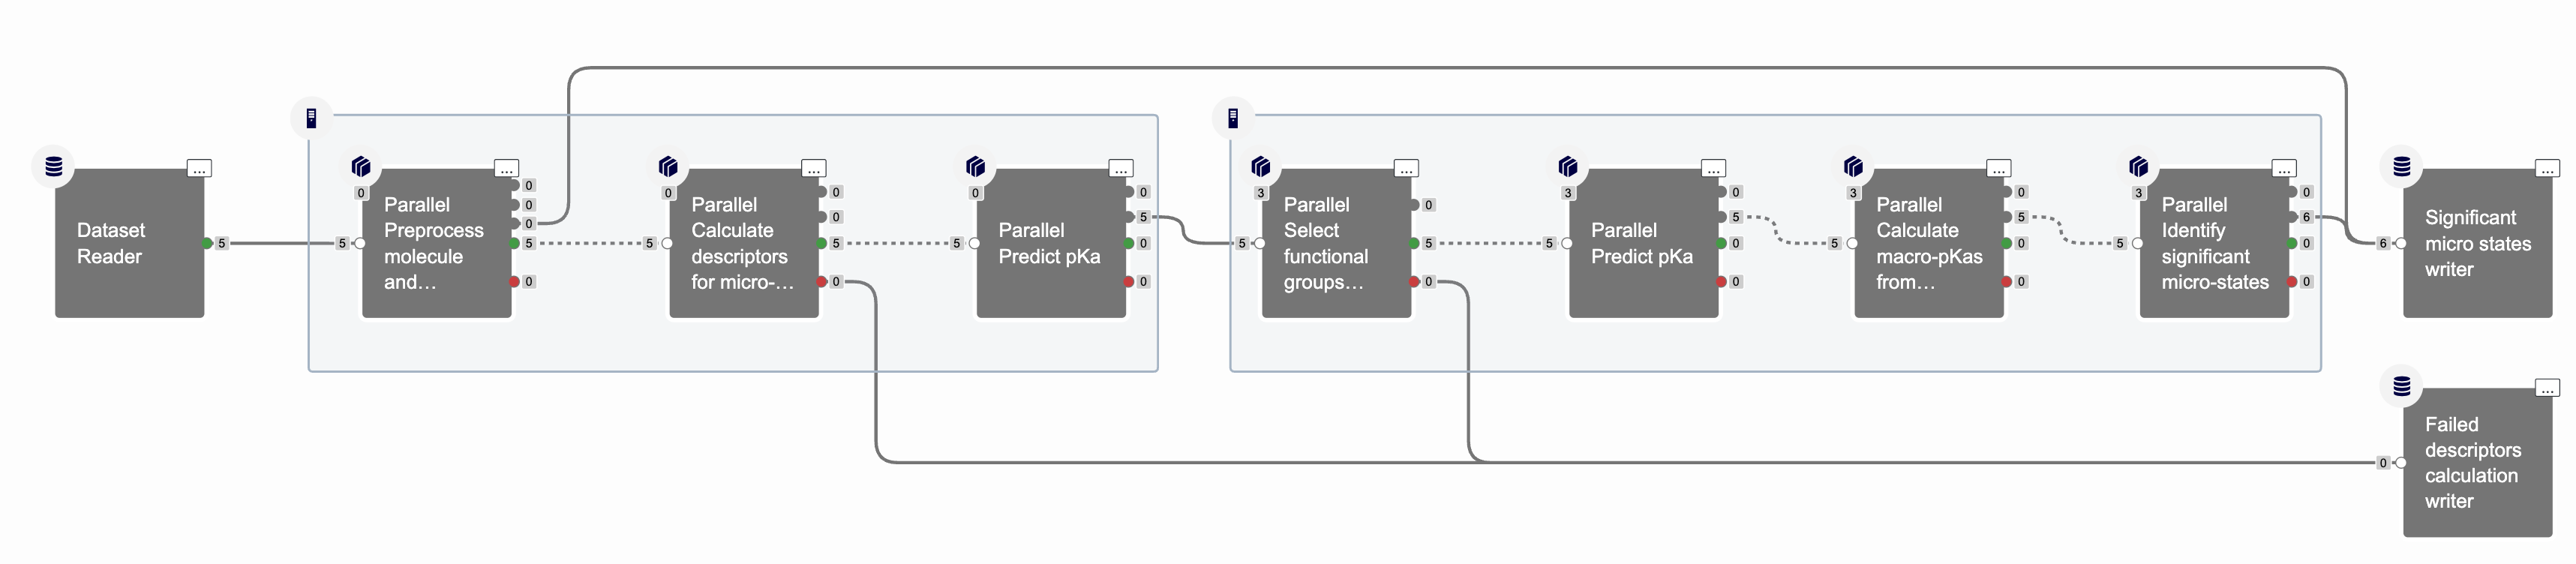
Figure 8. An overview of the cubes in the completed floe.
Floe Output Dataset
Figure 9 shows the output dataset containing the significant states (‘tutorial_examples_significant_states’). You can see that Warfarin has multiple records (one for each significant state). The second column shows the significant state. The third column shows the percentage of the corresponding microstate at the chosen pH. The field name also includes the pH Fraction at pH 7.4. Similarly, the fourth field shows LogD calculated at the chosen environment pH. mis_label specifies the microstate label which is made of the macrostate label and a number in parentheses that identifies a microstate within a macrostate. The columns pred_macro_pKas and pred_macro_pKas_std provide lists of all predicted macro-pKas and the corresponding errors. These values are also provided as individual values in the fields labeled as pred_pKa plus the suffix of the pKa number, such as pred_pKa1 and pred_pKa2. The errors are saved in the pred_pKa1_std and pred_pKa2_std columns.
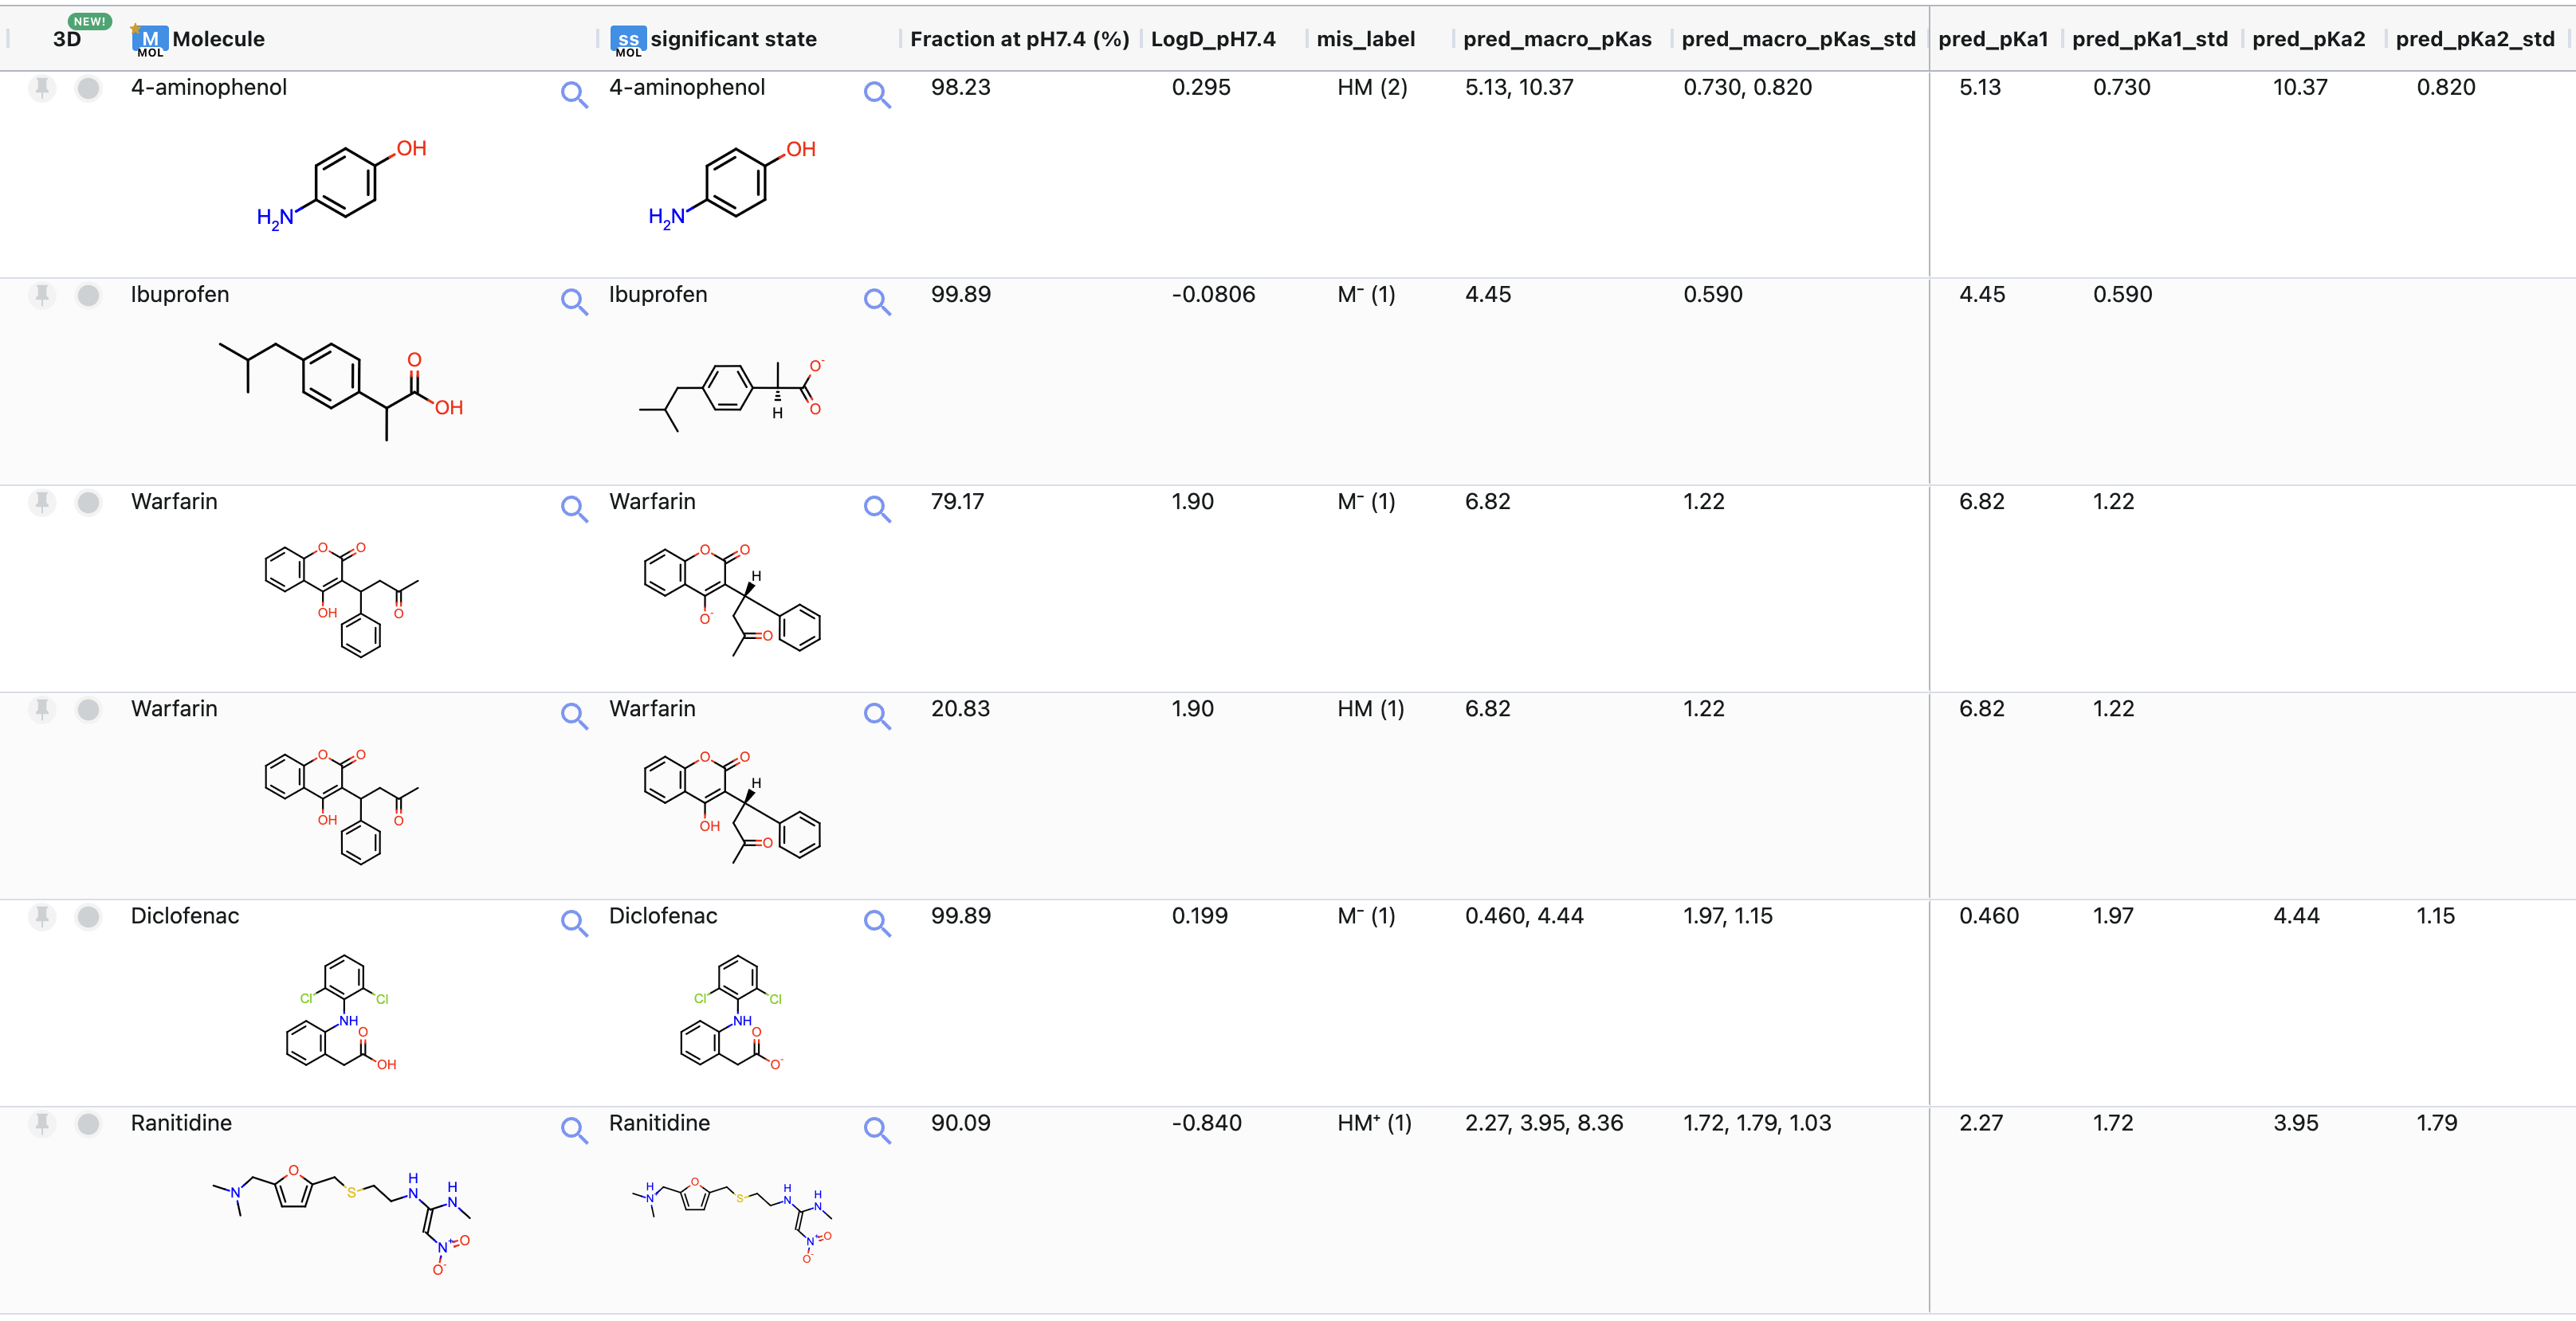
Figure 9. The floe output dataset.