Basic Tutorial 2: Automated WEMD Simulation and Best Structure Search Guided By Eigen Cryo-EM Maps
In this tutorial, you will run the Automated WEMD Simulation and Best Structure Search Guided By Eigen CryoEM Maps Floe, which includes three major components:
Set up and perform WEMD simulations using mean and eigen cryo-EM maps from heterogeneity analysis techniques such as CryoSPARC’s 3DVA or RECOVAR. Use the starting structure of CAK built using AlphaFold2. There is no heterogeneous cryo-EM data analysis for CAK because of its small size.
A synthetic mean map was created by setting all negative values of the cryo-EM map to zero (EMD-12042 was used to derive the 7B5Q PDB structure), then constructed eigenmaps from the density differences between the mean map and the simulation maps of different energy minima from a previous simulation.
The mean map can be subtracted from a WEMD simulation map to find the projection coefficients onto the eigenmaps to create 2D progress coordinates.
It is important to note that those mean maps and eigenmaps are synthetic and simply allow for a quick illustration of the floe. You cannot use them for a physical prediction.
Generate and review a WEMD simulation report. You can check the evolution plot of projection coefficients as a function of the iteration number as well as the corresponding simulation convergence plots.
Find the top candidates from the saved simulation trajectories for a series of input cryo-EM maps and generate a search report of the best structures.
You can use synthetic maps constructed from different energy minima from a previous WEMD simulation without using cryo-EM data as input and find the top N structures from the simulation trajectories.
For real applications, these input maps can be obtained from heterogeneous cryo-EM data analysis on 2D particle images.
Download Initial Files and Prepare the Protein to Run WEMD Simulations
Before starting the simulation, please download
all_init_files.tgz and upload the files under the cak folder to a
folder you have created in Orion, such as Team Data/CAK/init_files. For directions on how to upload,
please see the Data page documentation in the User Guide. Next, prepare the protein using the
SPRUCE - Protein Preparation and Solvate and Equilibrate Target Protein Floes
as described in the Soup to Nuts tutorial.
Use CAK_AF_fit2map.pdb as the initial structure to obtain a dataset for the WEMD simulation input.
The requisite parameters for these floes are shown in Figures 1 and 2.
Remember that the SPRUCE - Protein Preparation Floe
will run first and then provide input to the Solvate and Equilibrate Target Protein Floe.
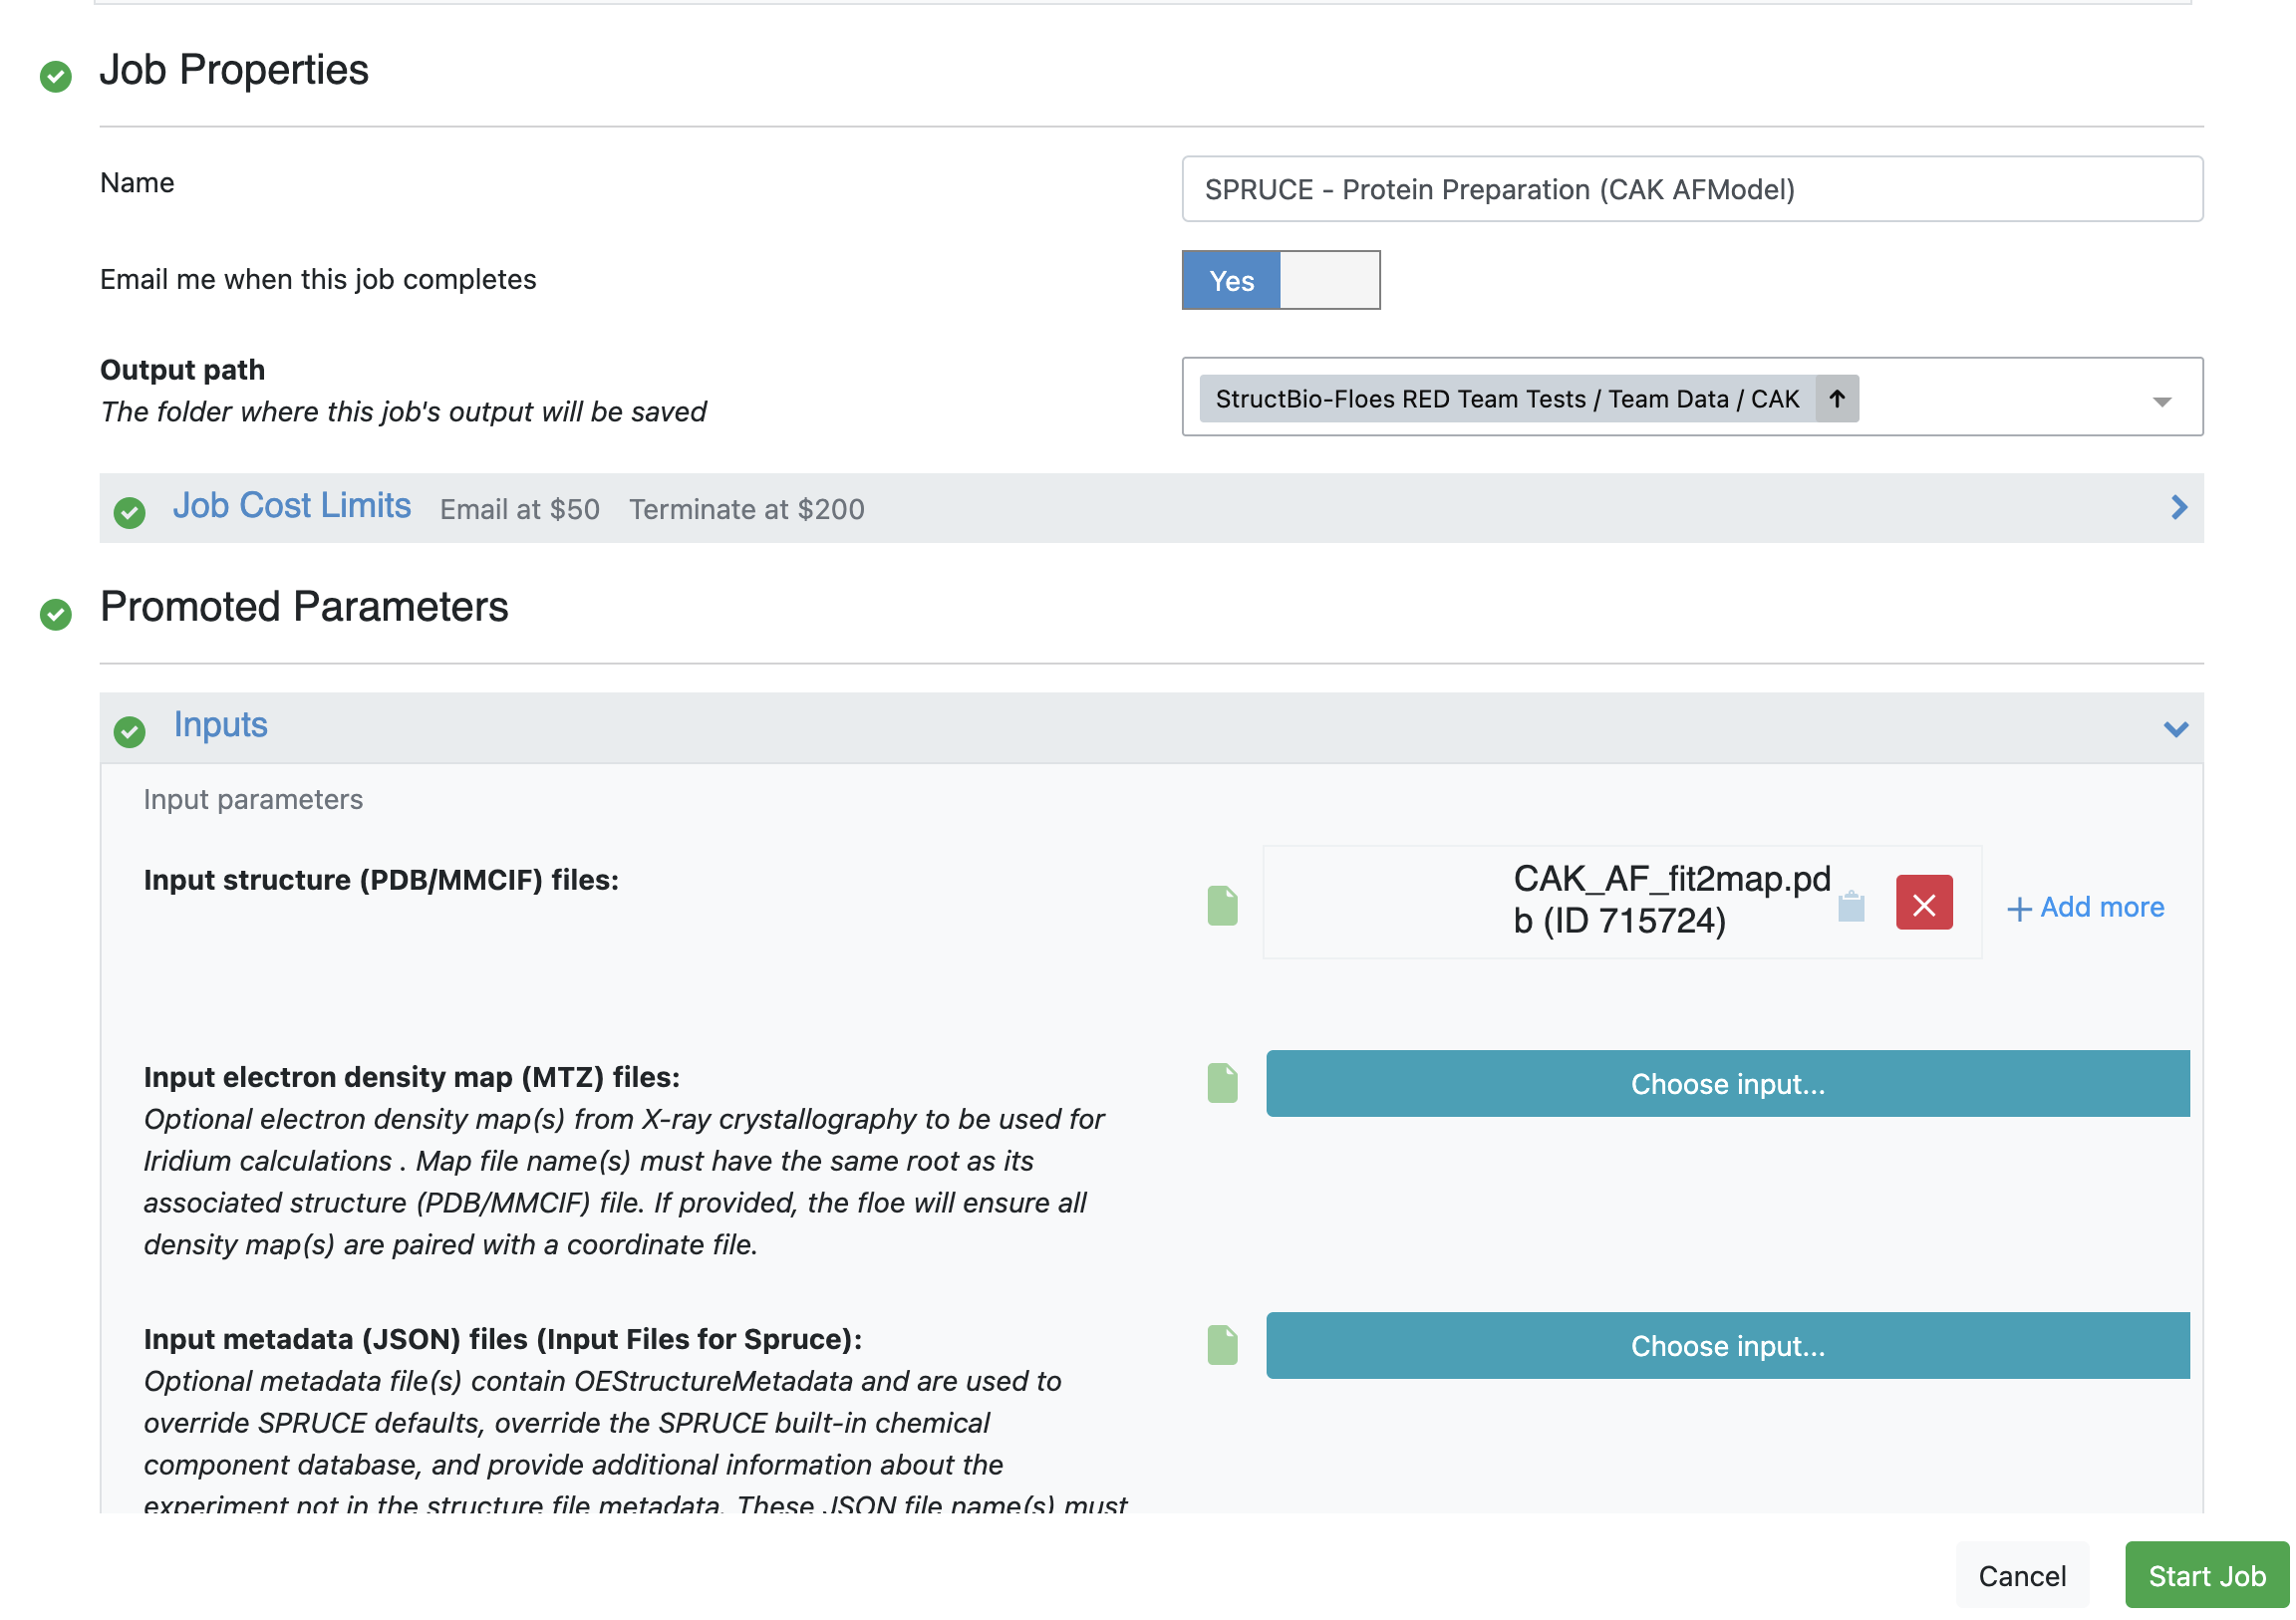
Figure 1. User inputs for the SPRUCE - Protein Preparation Floe.
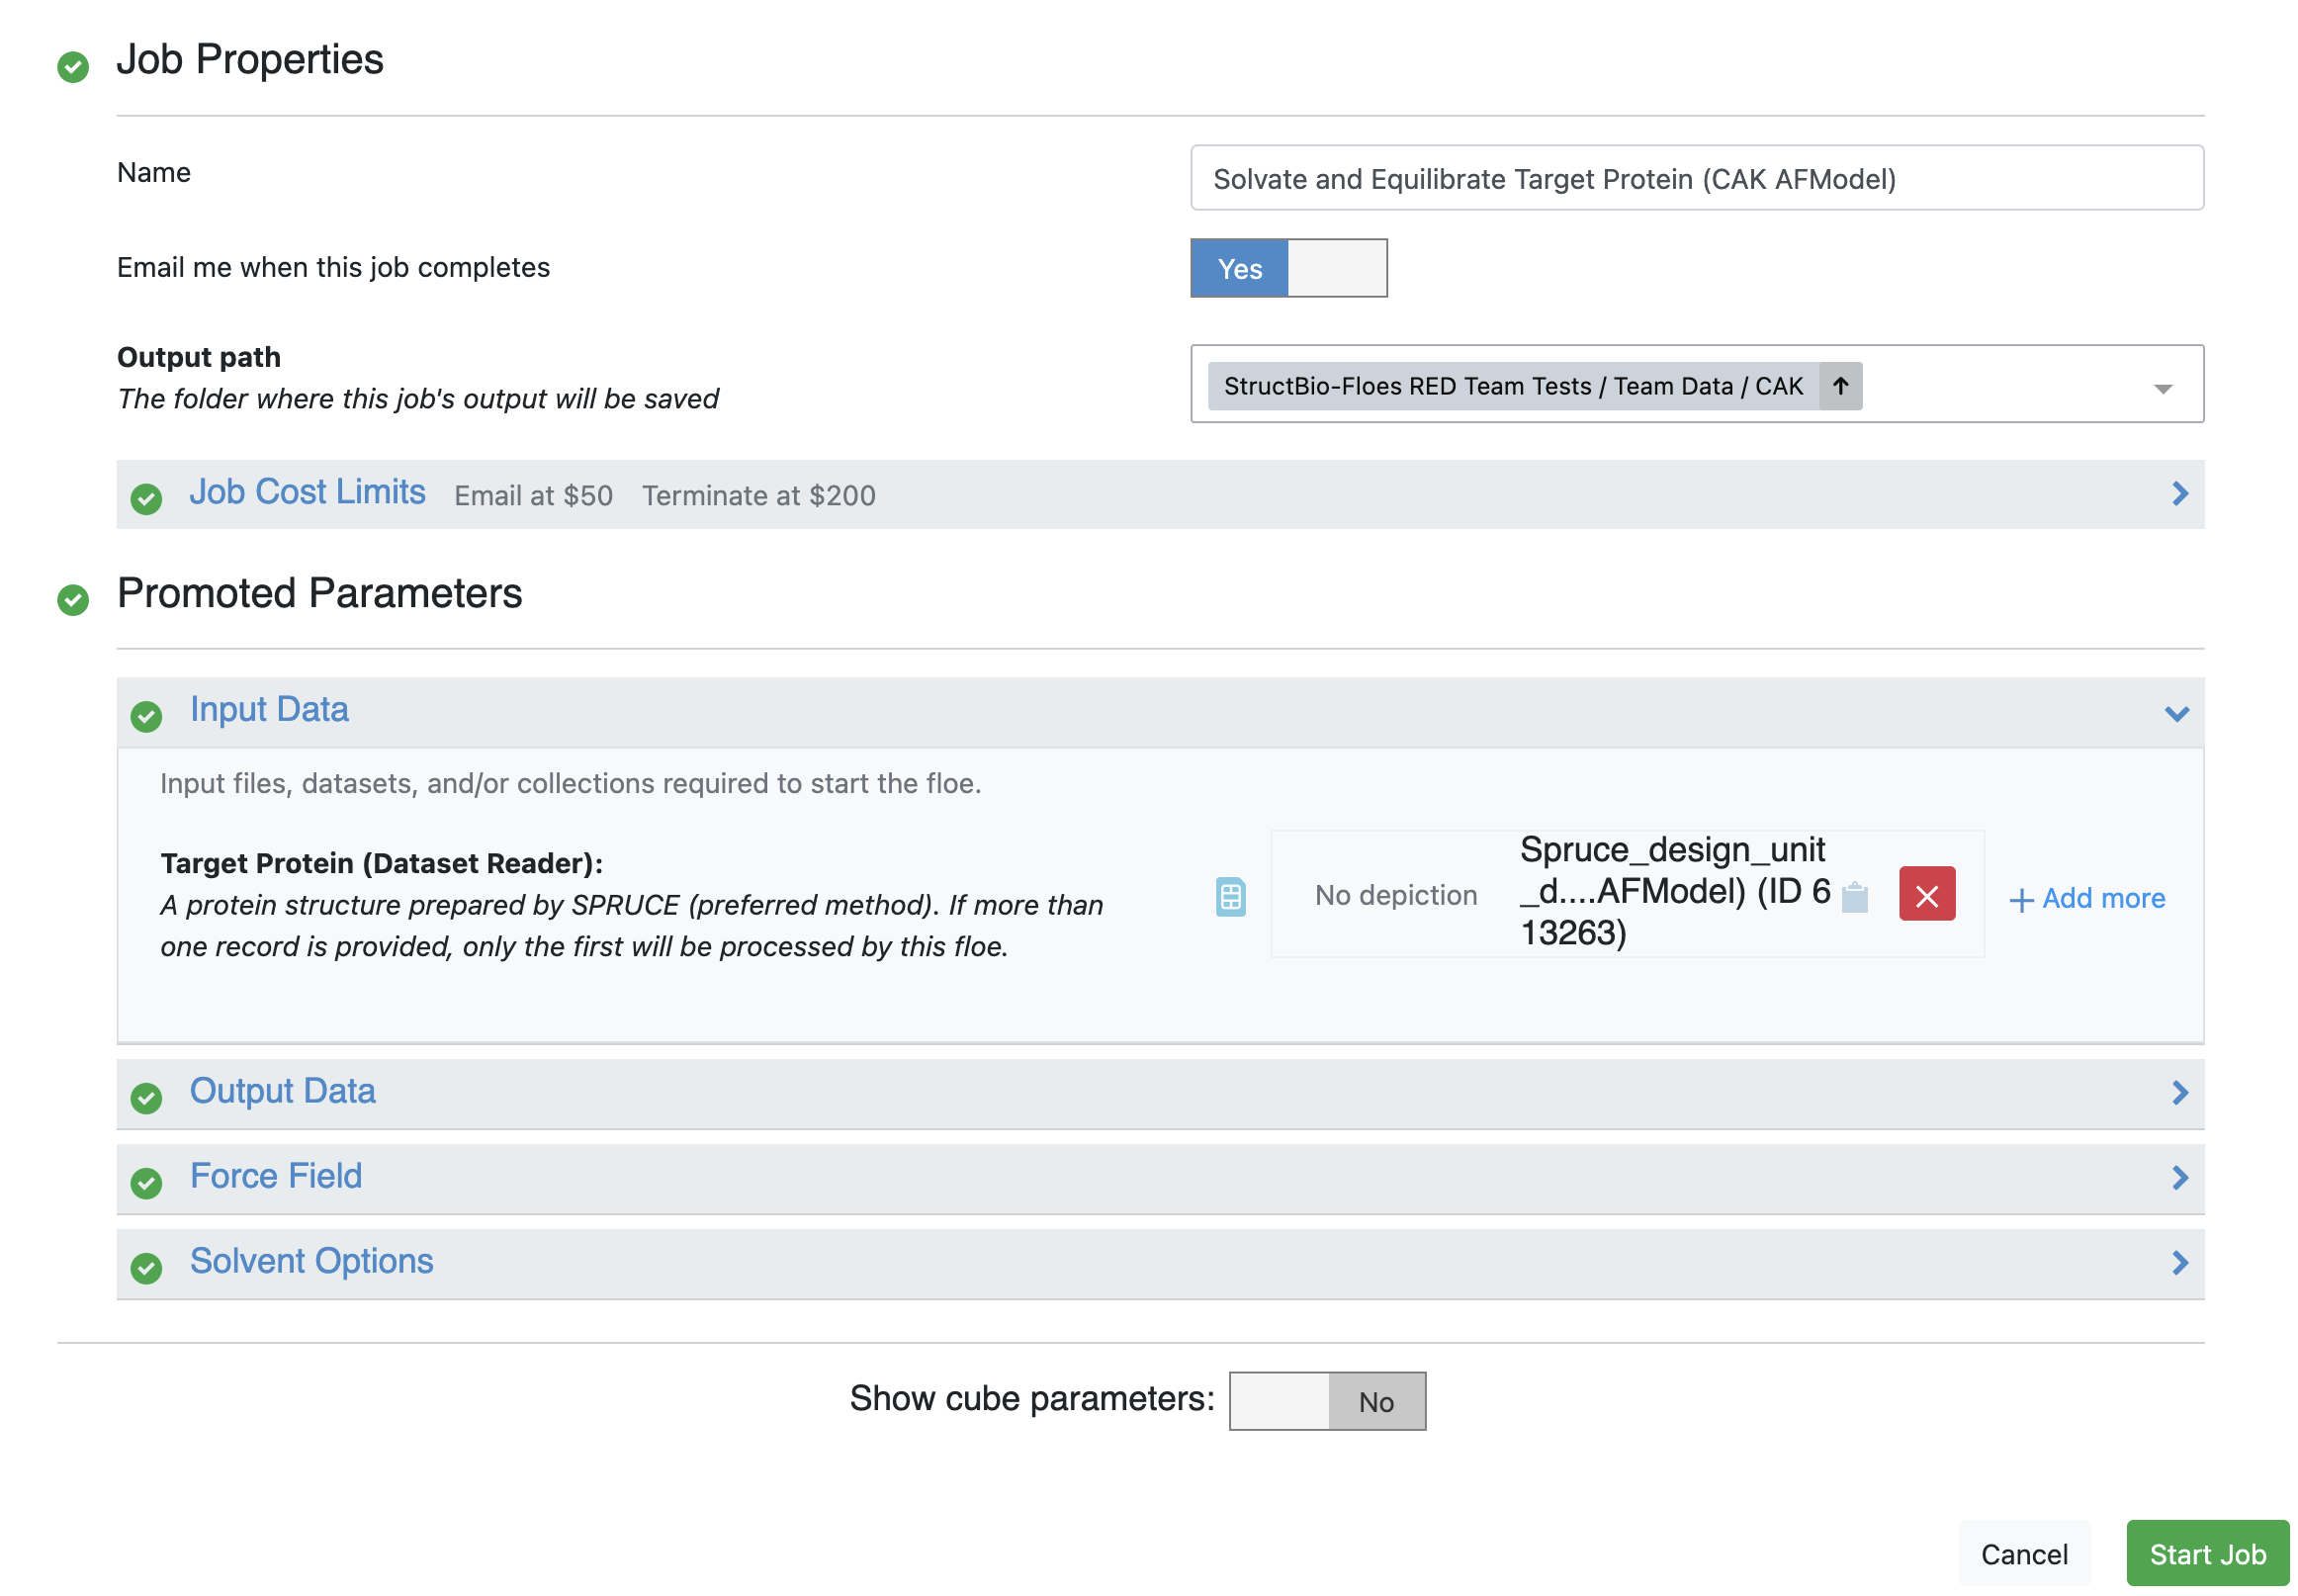
Figure 2. User input for the Solvate and Equilibrate Target Protein Floe.
Provide Input and Parameters to Run the Floe
In the Team Data folder, select cak and create a WEMDEigenMaps2D output folder for the output datasets and collections.
Navigate to the Floe page to find the floe and select the Automated WEMD Simulation and Best Structure Search Guided By Eigen CryoEM Maps Floe. Click the “Launch Floe” button to bring up the Job Form, as shown in Figure 3.
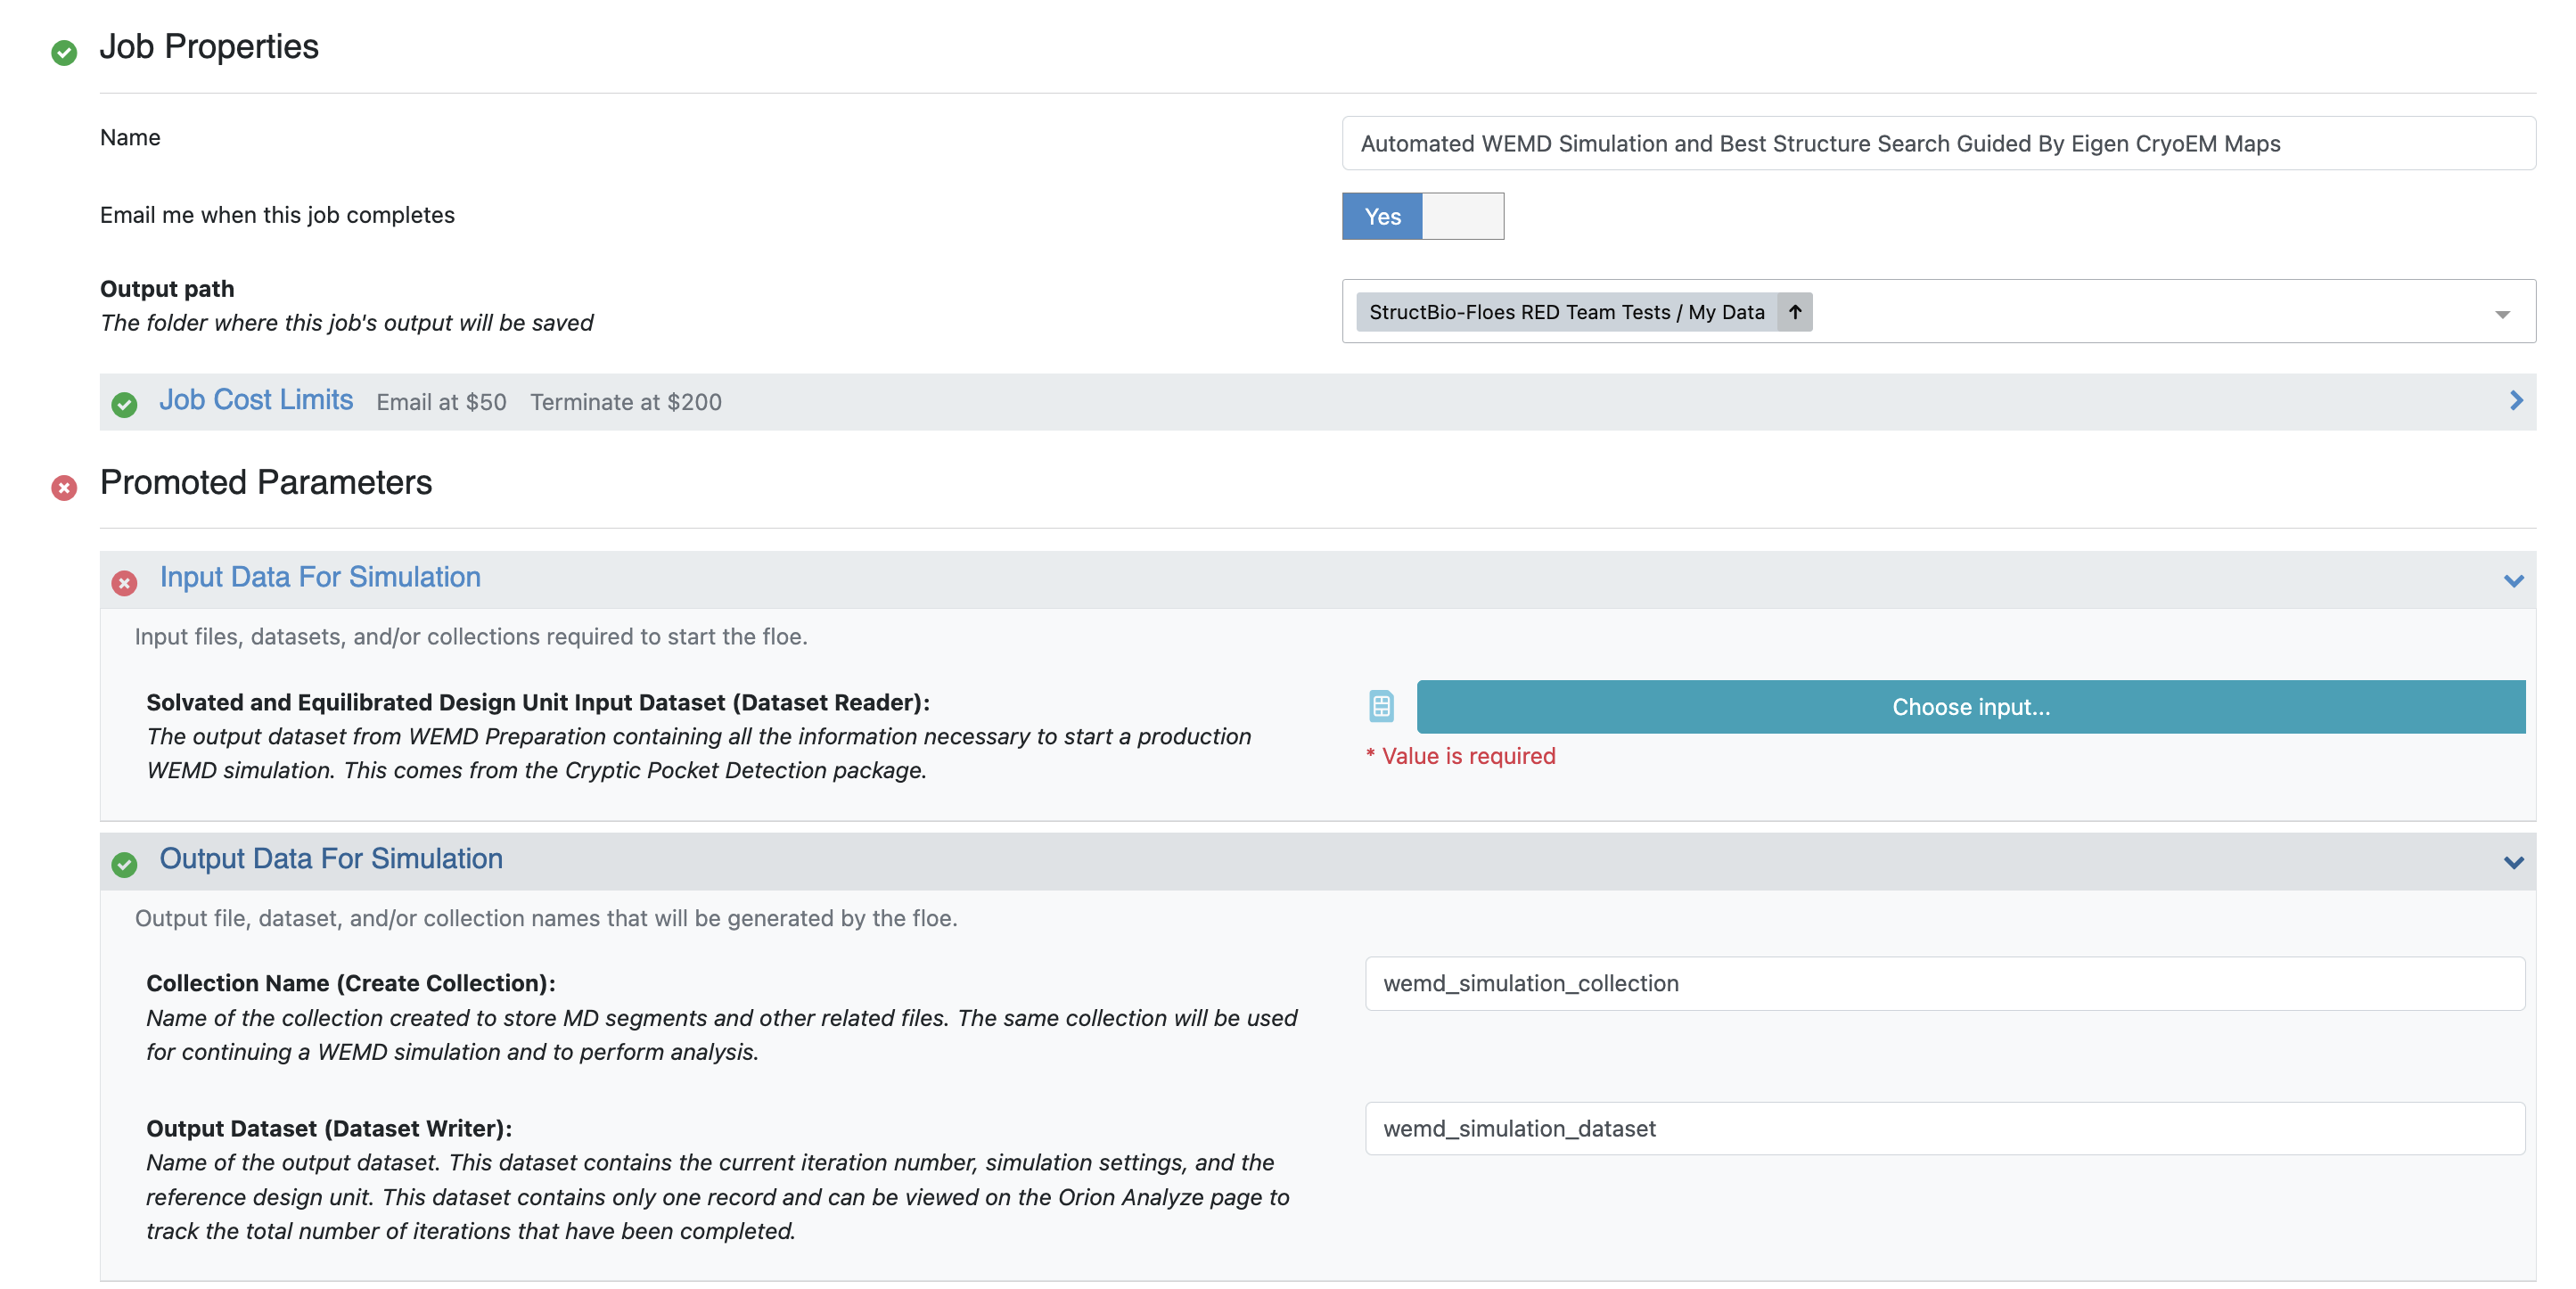
Figure 3. The Job Form for the Automated WEMD Simulation and Best Structure Search Guided By Eigen CryoEM Maps Floe.
The default values for most input and output parameters are appropriate for an initial run. The most notable parameters are listed below:
Output path: On the Job Form, specify where your output data should be directed. For this tutorial, use Team Data/CAK/WEMDEigenMaps2D.
Input Data for Simulation: Choose the Solvated and Equilibrated Protein output dataset from the Solvate and Equilibrate Target Protein Floe.
Output Data for Simulation: Customize the output dataset and collection names here for future identification.
Progress Coordinate Inputs:
Use the uploaded 7B5Q_emd_12042_nosolvent_mean_map.mrc file for the Mean Cryo-EM Map, and CAK_eigen0_351-400.mrc and CAK_eigen1_351-400.mrc for Eigenmaps. Use 2.5 Å for the input resolution.
Reference Protein Dataset: To align simulation structures to the input mean map, use the SPRUCE - Protein Preparation Floe output dataset created from the CAK AlphaFold2 model. Specify which components are selected to compute the simulation map for constructing progress coordinates. Select the top 98% of grid densities to rescale the simulation maps to match the experimental values. More details on customization of these parameters are in the FAQs for Cryo-EM Maps.
When Resize Cryo-EM Map(s) is toggled on, simulation maps and mean maps and eigenmaps will be resized based on the reference structure(s) with 10 Å of padding in order to save time for calculating the progress coordinates.
Weighted Ensemble Parameters: For a quick test, set 20 iterations and 10 ps for each MD segment. The FAQs include details for customization of these parameters.
Input Cryo-EM Maps and Options for Best Structures Search:
Cryo-EM Map Files: For this tutorial, use the uploaded CAK_minima1_351-400.mrc and CAK_minima2_351-400.mrc as inputs.
Reference Protein Dataset: Use the SPRUCE - Protein Preparation Floe output dataset.
Selections for Output Best Structures: Save the top five best candidates for each input cryo-EM map.
Enter the requisite parameters as shown in Figures 4 and 5 and click “Start Job” to begin the floe.
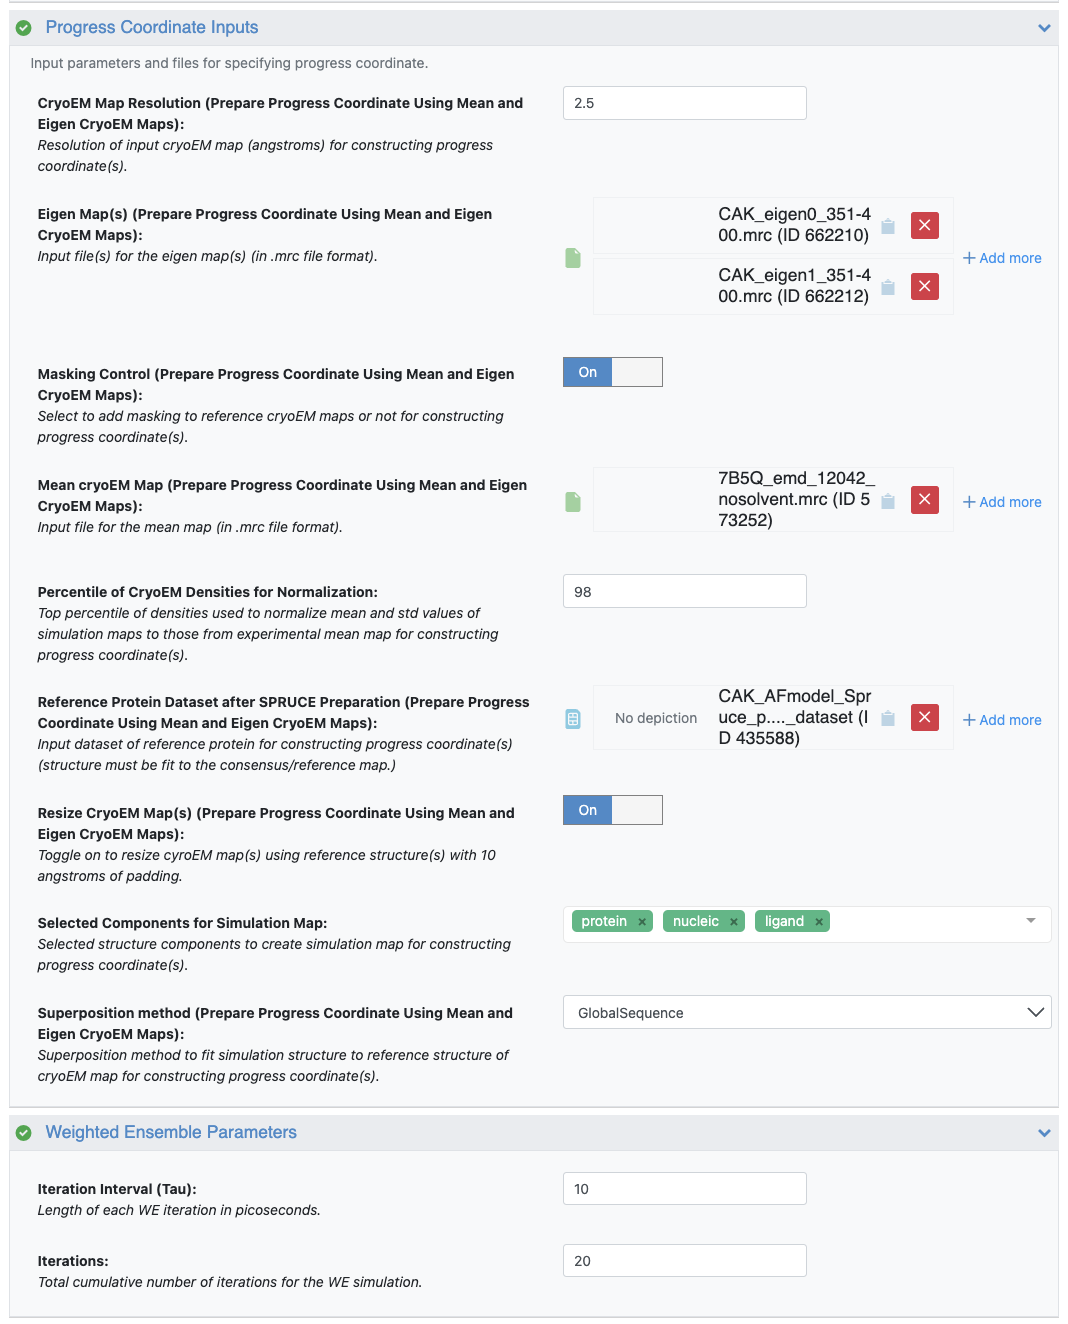
Figure 4. User inputs for the Progress Coordinate Inputs and Weighted Ensemble Parameters.
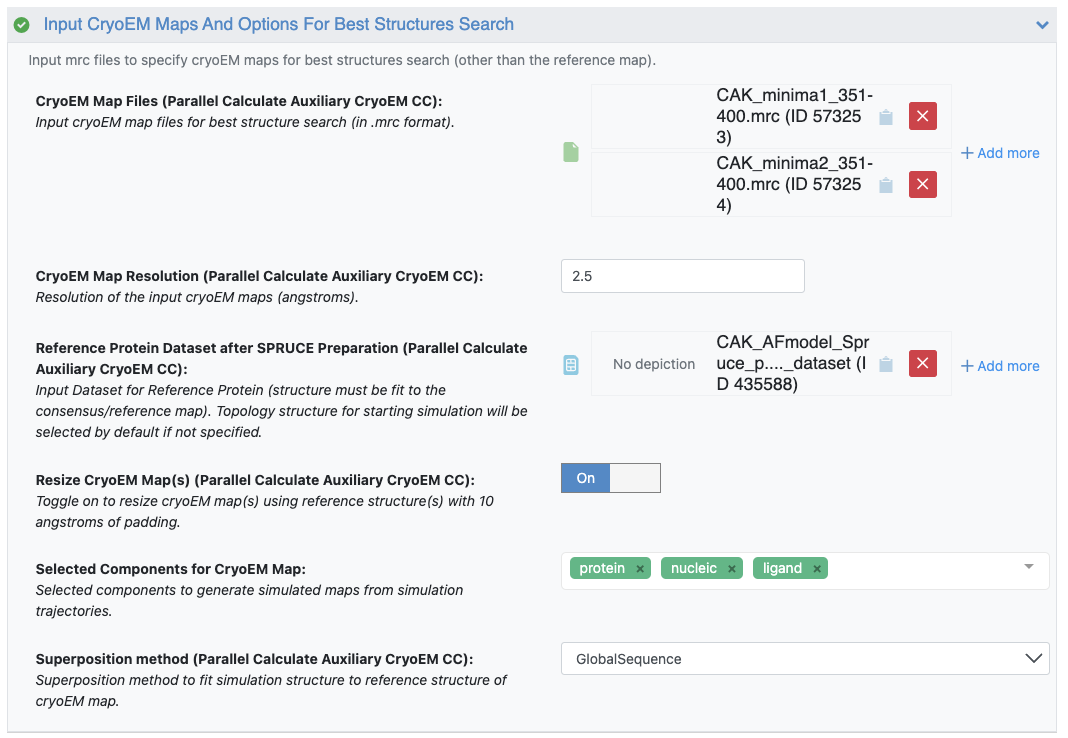
Figure 5. User inputs for the Input Cryo-EM Maps and Options for Best Structures Search parameters.
Check Outputs and Floe Reports
The floe produces two Floe Reports: the WEMD Simulation Report and the Cryo-EM Map Match Report. Click on the “Open Report” icon to open each Floe Report in a new tab. Under Results, you will find the files best_structures_dataset, wemd_simulation_dataset, and wemd_simulation_collection. You can view the datasets and the collection in the specified output folder on the Data page by clicking the “View in Project Data” button. Activate the best_structures_dataset to visualize the structures on the 3D & Analyze page.
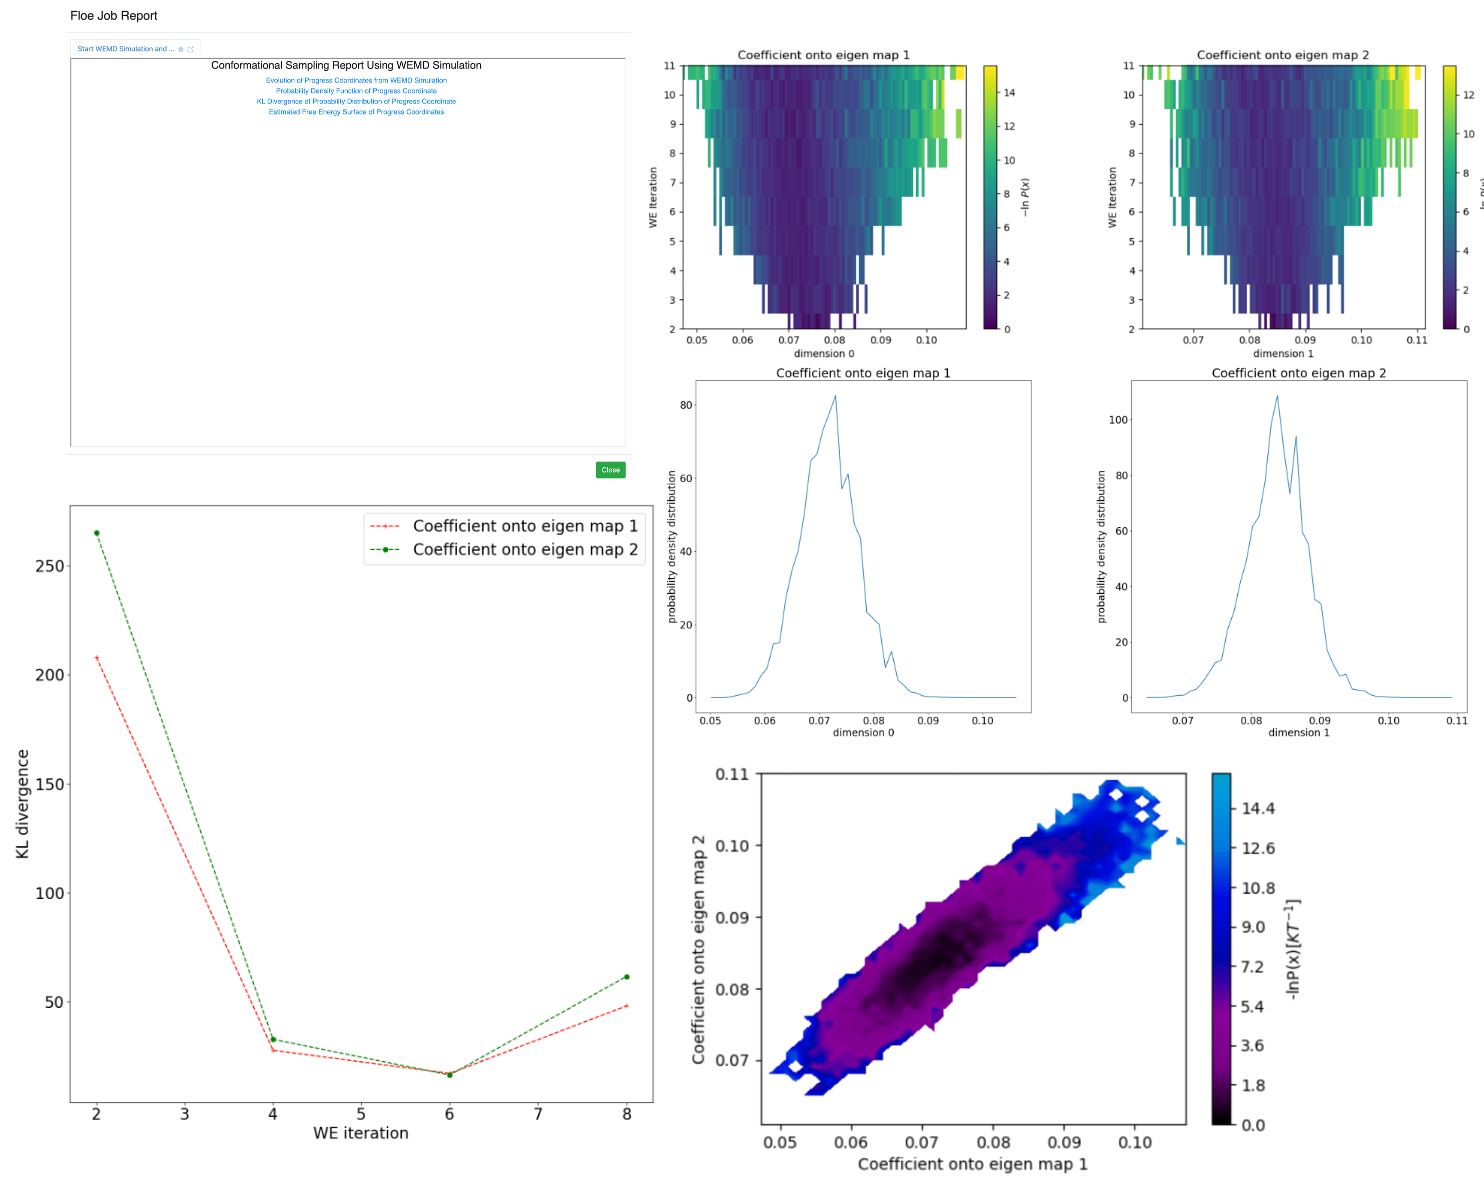
Figure 6. The Start WEMD Simulation and Structure Search Report. Upper left: main page. Upper right: progress coordinate evolution, based on the projection of the residual density (simulation density minus the mean map) onto the eigenmaps as the weighted ensemble (WE) simulation progresses. Free energy, conditional on the starting state, is plotted by iteration (y-axis), with dark blue to light yellow corresponding to free energy minima and maxima. Middle right: final probability distribution of RSCC with the reference map. Lower left: KL-divergence of the probability distributions as the iterations progress (lower values indicate convergence toward a steady-state probability distribution). Lower right: final free energy conditional on the starting structure for both eigenmaps simultaneously.
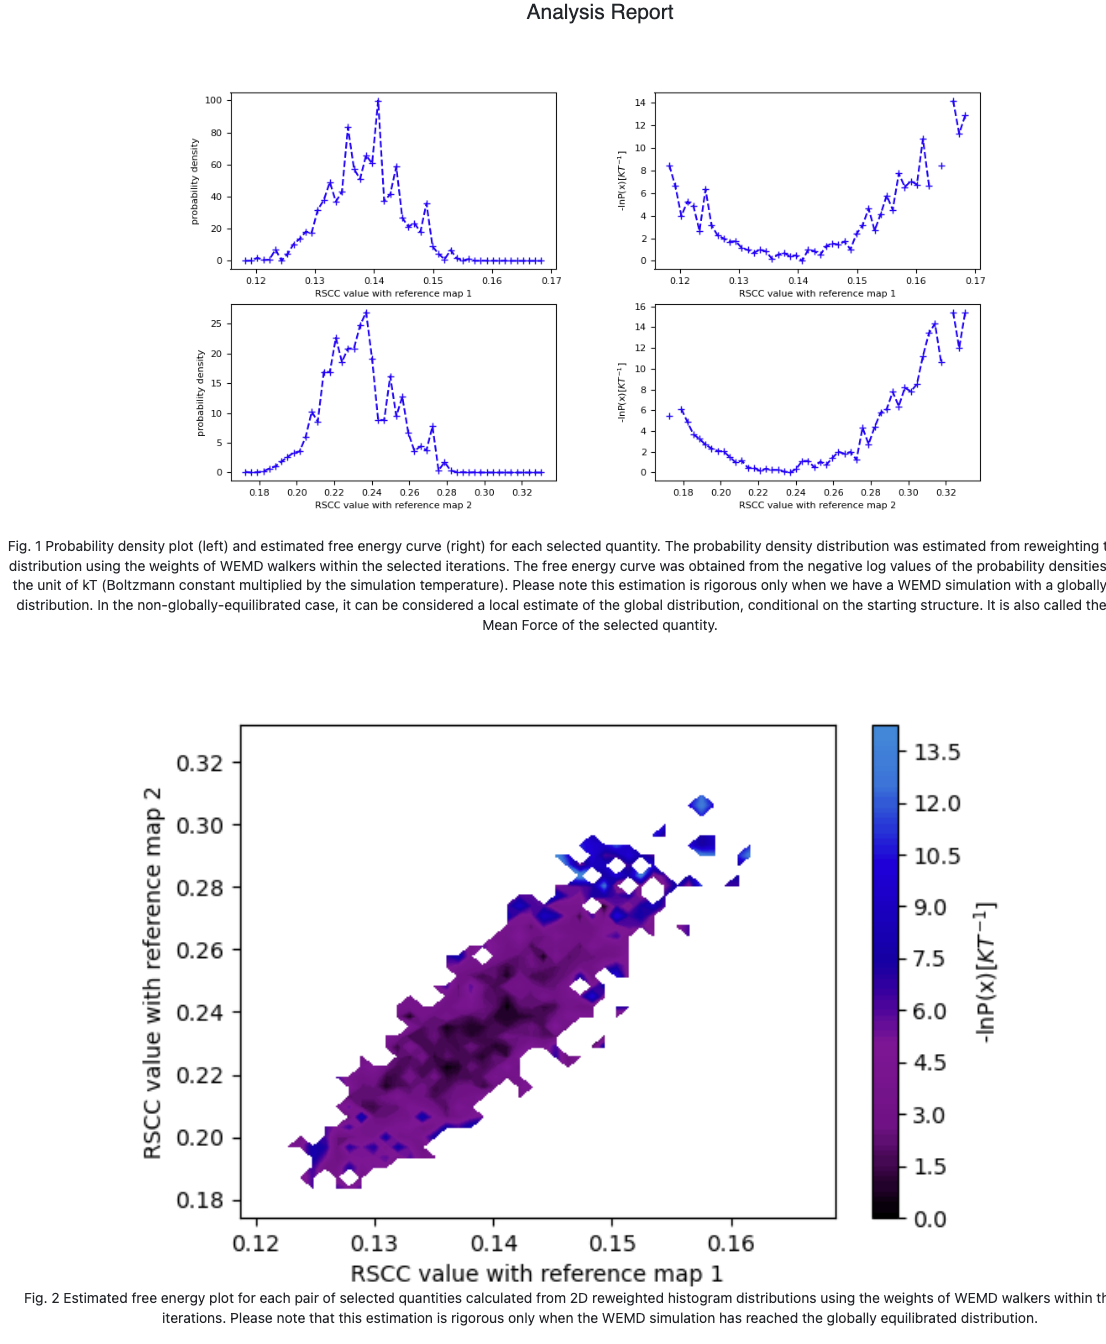
Figure 7. The CryoEM Map Match Report. Upper: Probability distribution and free energy conditional on the starting state, for each best structure search target map. Lower: Free energy landscape conditional on the starting state for the two target maps, plotted simultaneously on each axis.
Predict Cryptic Pockets
The output dataset and collection are consistent with those obtained from the simulation floes using normal modes as progress coordinates in the OpenEye Cryptic Pocket Detection Floes package. Thus all pocket detection floes from that package can be used to predict cryptic pockets for the simulation collections generated in this package. The Cryptic Pocket Detection advanced tutorials offer more insight to the floes from that package.