Calculate Normal Modes
Quick floe search term: CPD A2
Normal modes are orthogonal degrees of motion that the protein can access. Typically, the modes with lower frequencies tend to describe collective motions that engage large parts of the protein; therefore, they are referred to as the global modes [Bahar-2010]. The modes are modeled based on the input PDB structure that has been relaxed using the Solvate and Equilibrate Target Protein Floe. As such, your global modes may not look exactly like the ones displayed in this tutorial, since your protein relaxation could have resulted in a slightly different structure.
Global modes are used as progress coordinates to drive sampling of a chosen protein in the Run a Normal Mode-Guided Weighted Ensemble MD Simulation Floe. Larger changes in protein backbone motions occur on timescales that are expensive to sample via brute force simulation. The hope is that by using global modes to drive the larger protein fluctuations, we can sample a broad range of conformations, including those that reveal pocket opening. This tutorial demonstrates how to select global modes from a set of normal modes calculated using the input structure.
Tip
This floe typically takes less than five minutes to run, just enough time to get a cup of tea or coffee. It costs less than $2.
Search and Run the Floe in Orion
Locate the floe in Orion
Using the blue navigation bar, go to Floe page.
On the Floe page, click on the Floes tab, where you will find the list of the available floes and packages.
Under the Category Floe Filters, click on the caret next to the ‘Packages’ Filter to expand the list of packages and select the OpenEye Cryptic Pocket Detection Floes package. The floes for the Cryptic Pocket Detection package will appear in the middle pane.
From this list, click on the Calculate Normal Modes Floe and then click the blue “Launch Floe”” button to launch the Job Form as shown in Figure 1.
Provide Input Files and Parameters to Run the Floe
- Output Path:
Select the destination for your output data by specifying the Output path.
- Input Data:
Provide the Solvated and Equilibrated Protein dataset generated by the Solvate and Equilibrate Target Protein Floe as an input.
- Output Data:
You can customize the output dataset and collection names in this parameter group.
- System Parameters:
Use this option when you wish to perform a normal mode calculation on a selected region of the protein instead of the entire protein. This becomes useful when you want to focus the enhanced sampling and cryptic pocket search on a region of the target protein. In practice, the input for the System Selection String parameter would look like A:1~150 when selecting residues 1 to 150 on chain A of the input protein. Multiple residue ranges are supported by inputting multiple entries using the “Add More” button provided below the input box.
- Advanced System Parameters:
The Environment Selection String option should be used only when an input is given for the System Selection String. The Environment Selection String should be left empty to include the effect of the entire protein as the environment for the normal mode calculation. You can alternatively choose a subregion of the protein as the environment. This selection may or may not include the region selected for the System Selection String, as the floe will automatically detect and remove overlapping regions. Figure 3 depicts environment selection depending on the input provided. The System–Environment Framework parameter specifies the method for performing the system–environment calculation. The default is Reduce. See below for a detailed discussion on the system–environment calculation.
- ANM Parameters:
The normal modes are calculated using the Anisotropic Network Model (ANM) [Atilgan-2001]. Cutoff Distance and Spring Constant have been set to optimal values by default. Since the Run a Normal Mode-Guided Weighted Ensemble MD Simulation Floe only takes up to two modes as the progress coordinates, it would make sense to set the Maximum Number of Selected Modes to 2 if you would like the floe to automatically rank and select two global modes based on the criterion specified by the Mode Filtering Property. By default, this is set to Collectivity (see below for details about Mode Collectivity). Emptying the Maximum Number of Selected Modes parameter disables the automatic mode filtering, which is the default setting.
Note
Use of the System Selection String is recommended when dealing with a multichain system and if you wish to neglect the effect of entire multimeric protein on the dynamics of the selected region. Keep in mind that by selecting a subregion for normal mode calculations, you might not be able to effectively sample slow motions associated with the excluded regions. You may also use the environment selection option to ignore the effect of floppy regions during normal mode calculation of the selected region. Excluding floppy regions should be a reasonable choice since such regions tend to have relatively fast structural fluctuations, and their dynamics can often be sampled within short time scales.
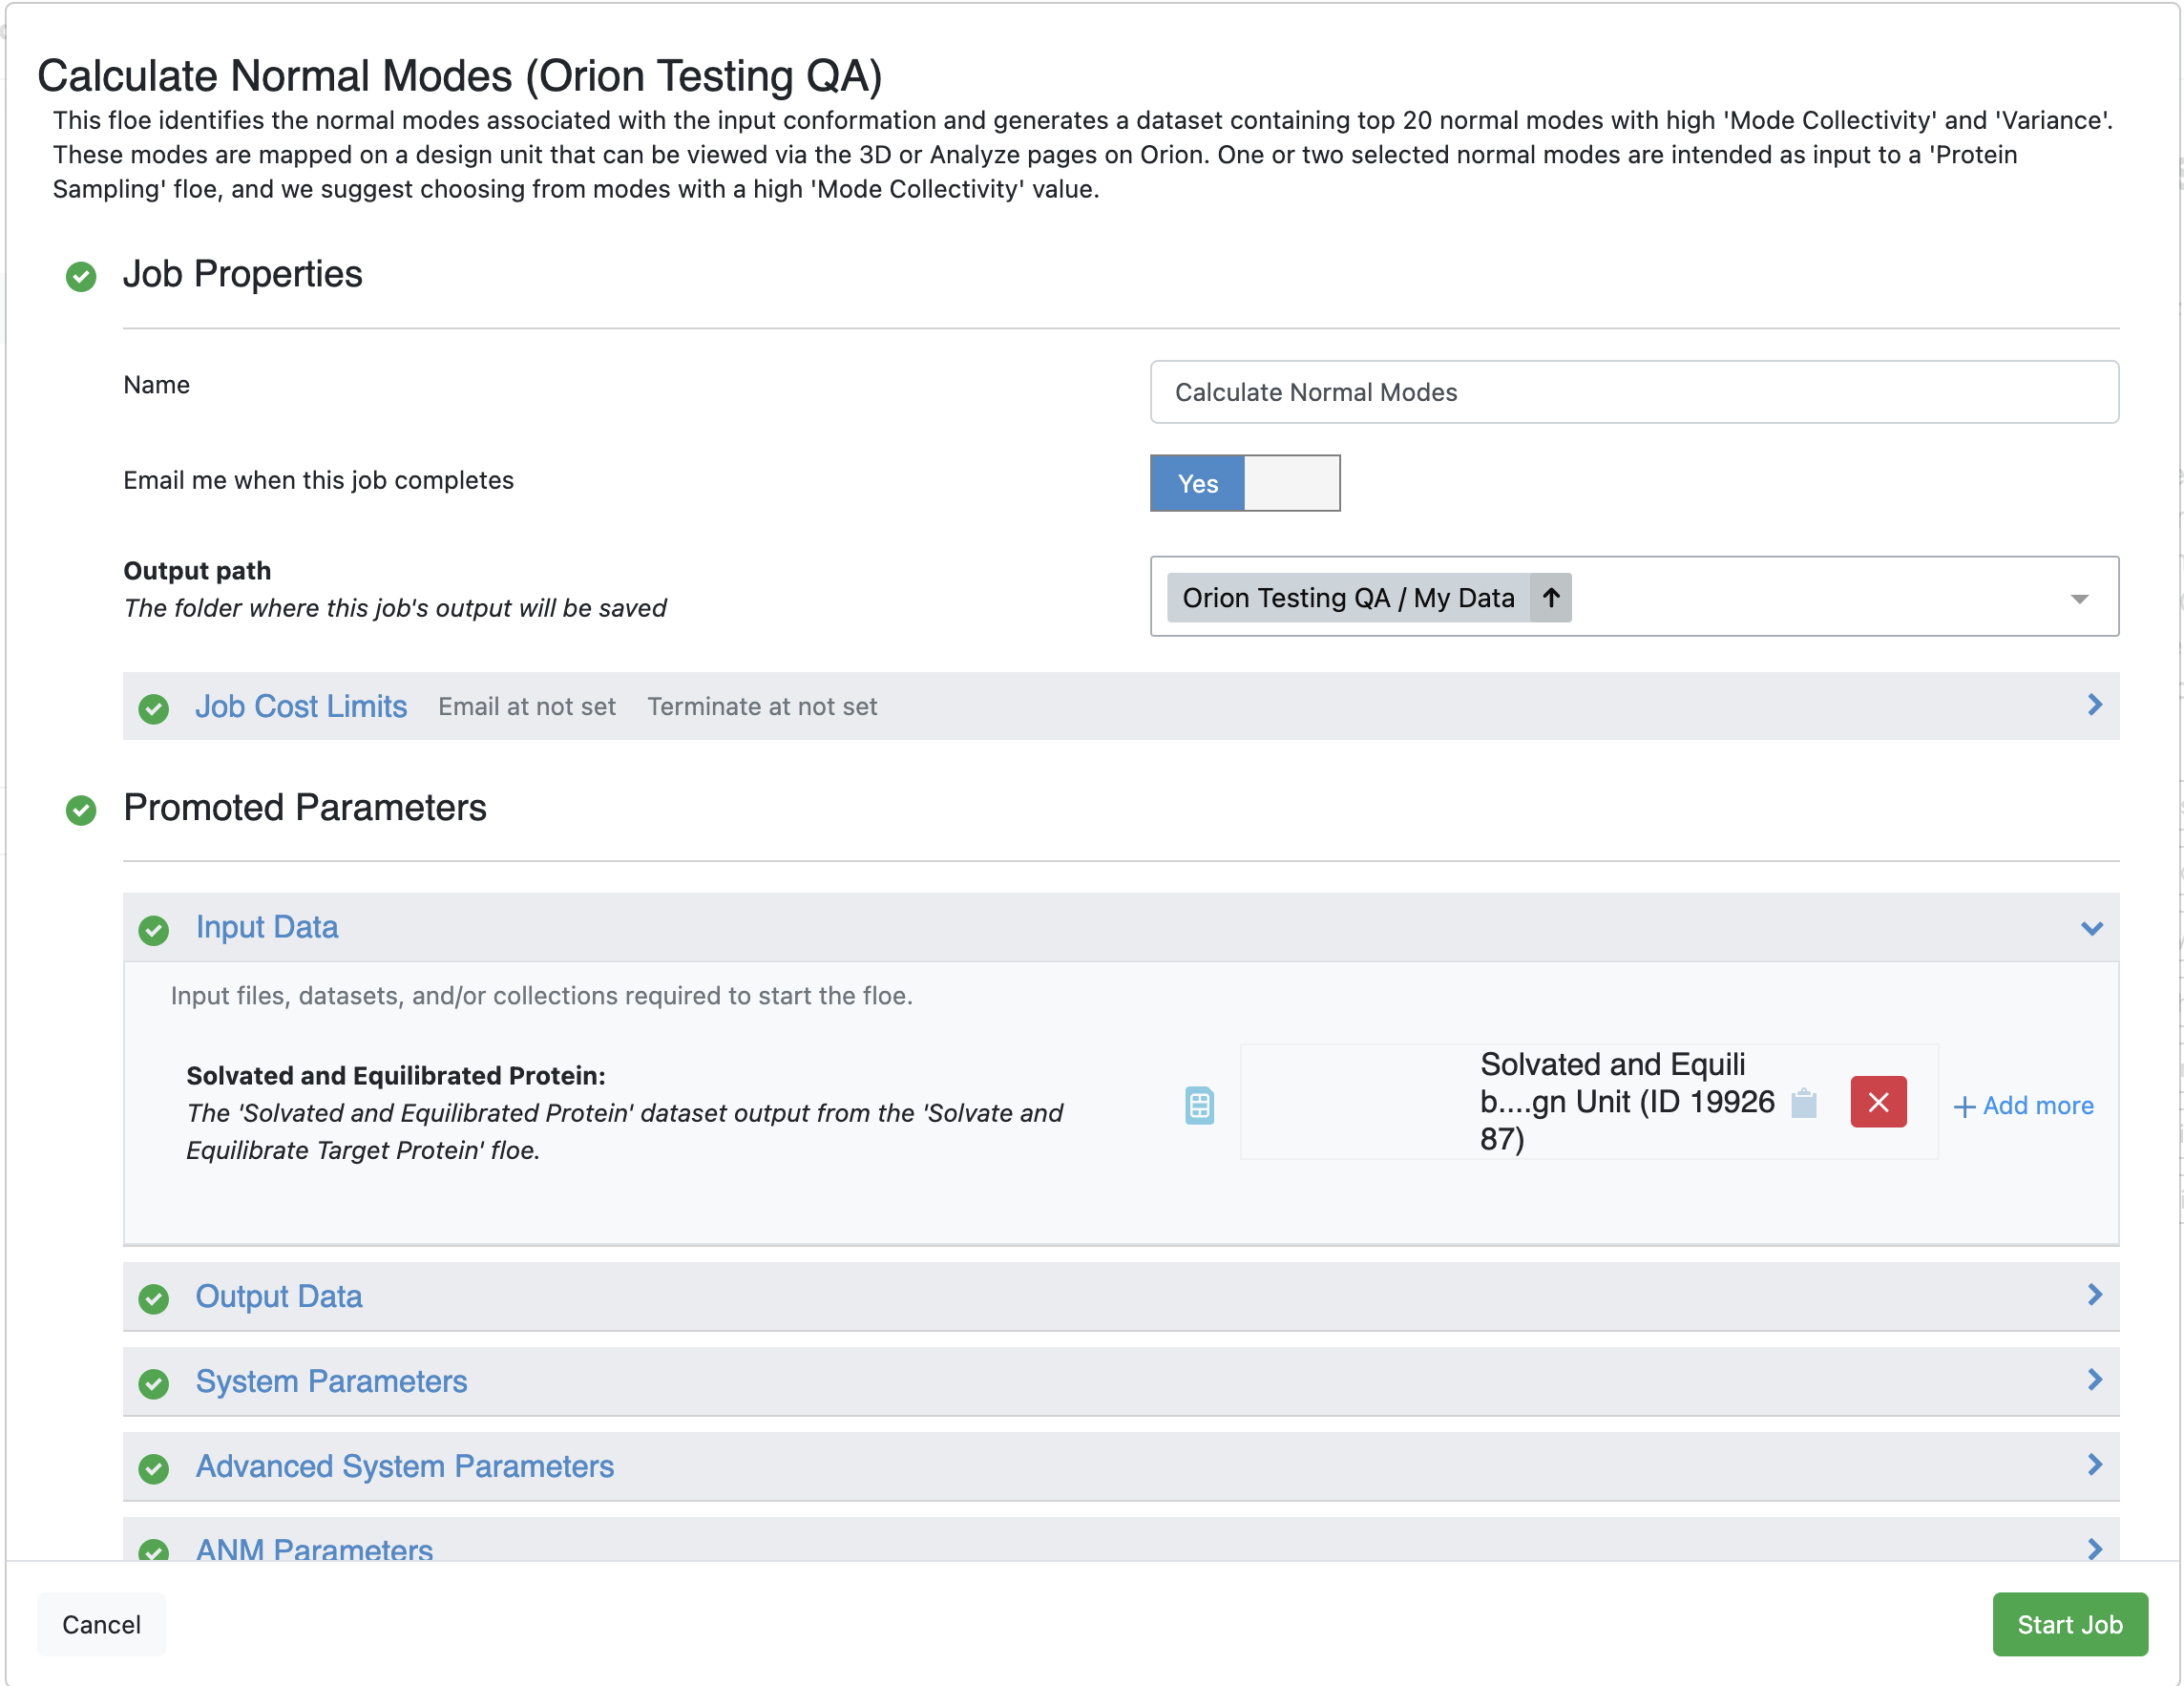
Figure 1. The Job Form for the Calculate Normal Modes Floe.
Click on the green “Start Job” button.
Visualize and Analyze Normal Modes
When the floe job is complete, the output normal mode analysis dataset should be inspected using the 3D & Analyze page to identify the best normal modes to use in the next floe. To access the dataset, navigate to the Jobs Tab on the Floe page. Then click on the job that you want to inspect, in this case, the normal mode analysis job. In the Results section, click on the “View in Project Data” button to see the dataset associated with the job.
This will redirect you to the Data page and show only the dataset associated with the job. To activate the dataset, click on the circle with a + sign, which becomes a checkmark when activated. This will allow you to view the dataset on the 3D & Analyze page.
Using the navigation bar, go to the 3D & Analyze page. In the Active Data Bar, make sure that the normal mode analysis dataset is selected in the ‘Active Datasets’ drop-down. On the scatter plot, use Mode Number for the x-axis and use Mode Collectivity for the y-axis. Click on the ‘Layouts’ drop-down in the top-right corner of the Active Data Bar and select the Analyze with 3D option. This shows a visual representation of the mode vectors as orange arrows on a representative structure of the protein taken from the solvated and relaxed protein structure supplied for the normal mode analysis.
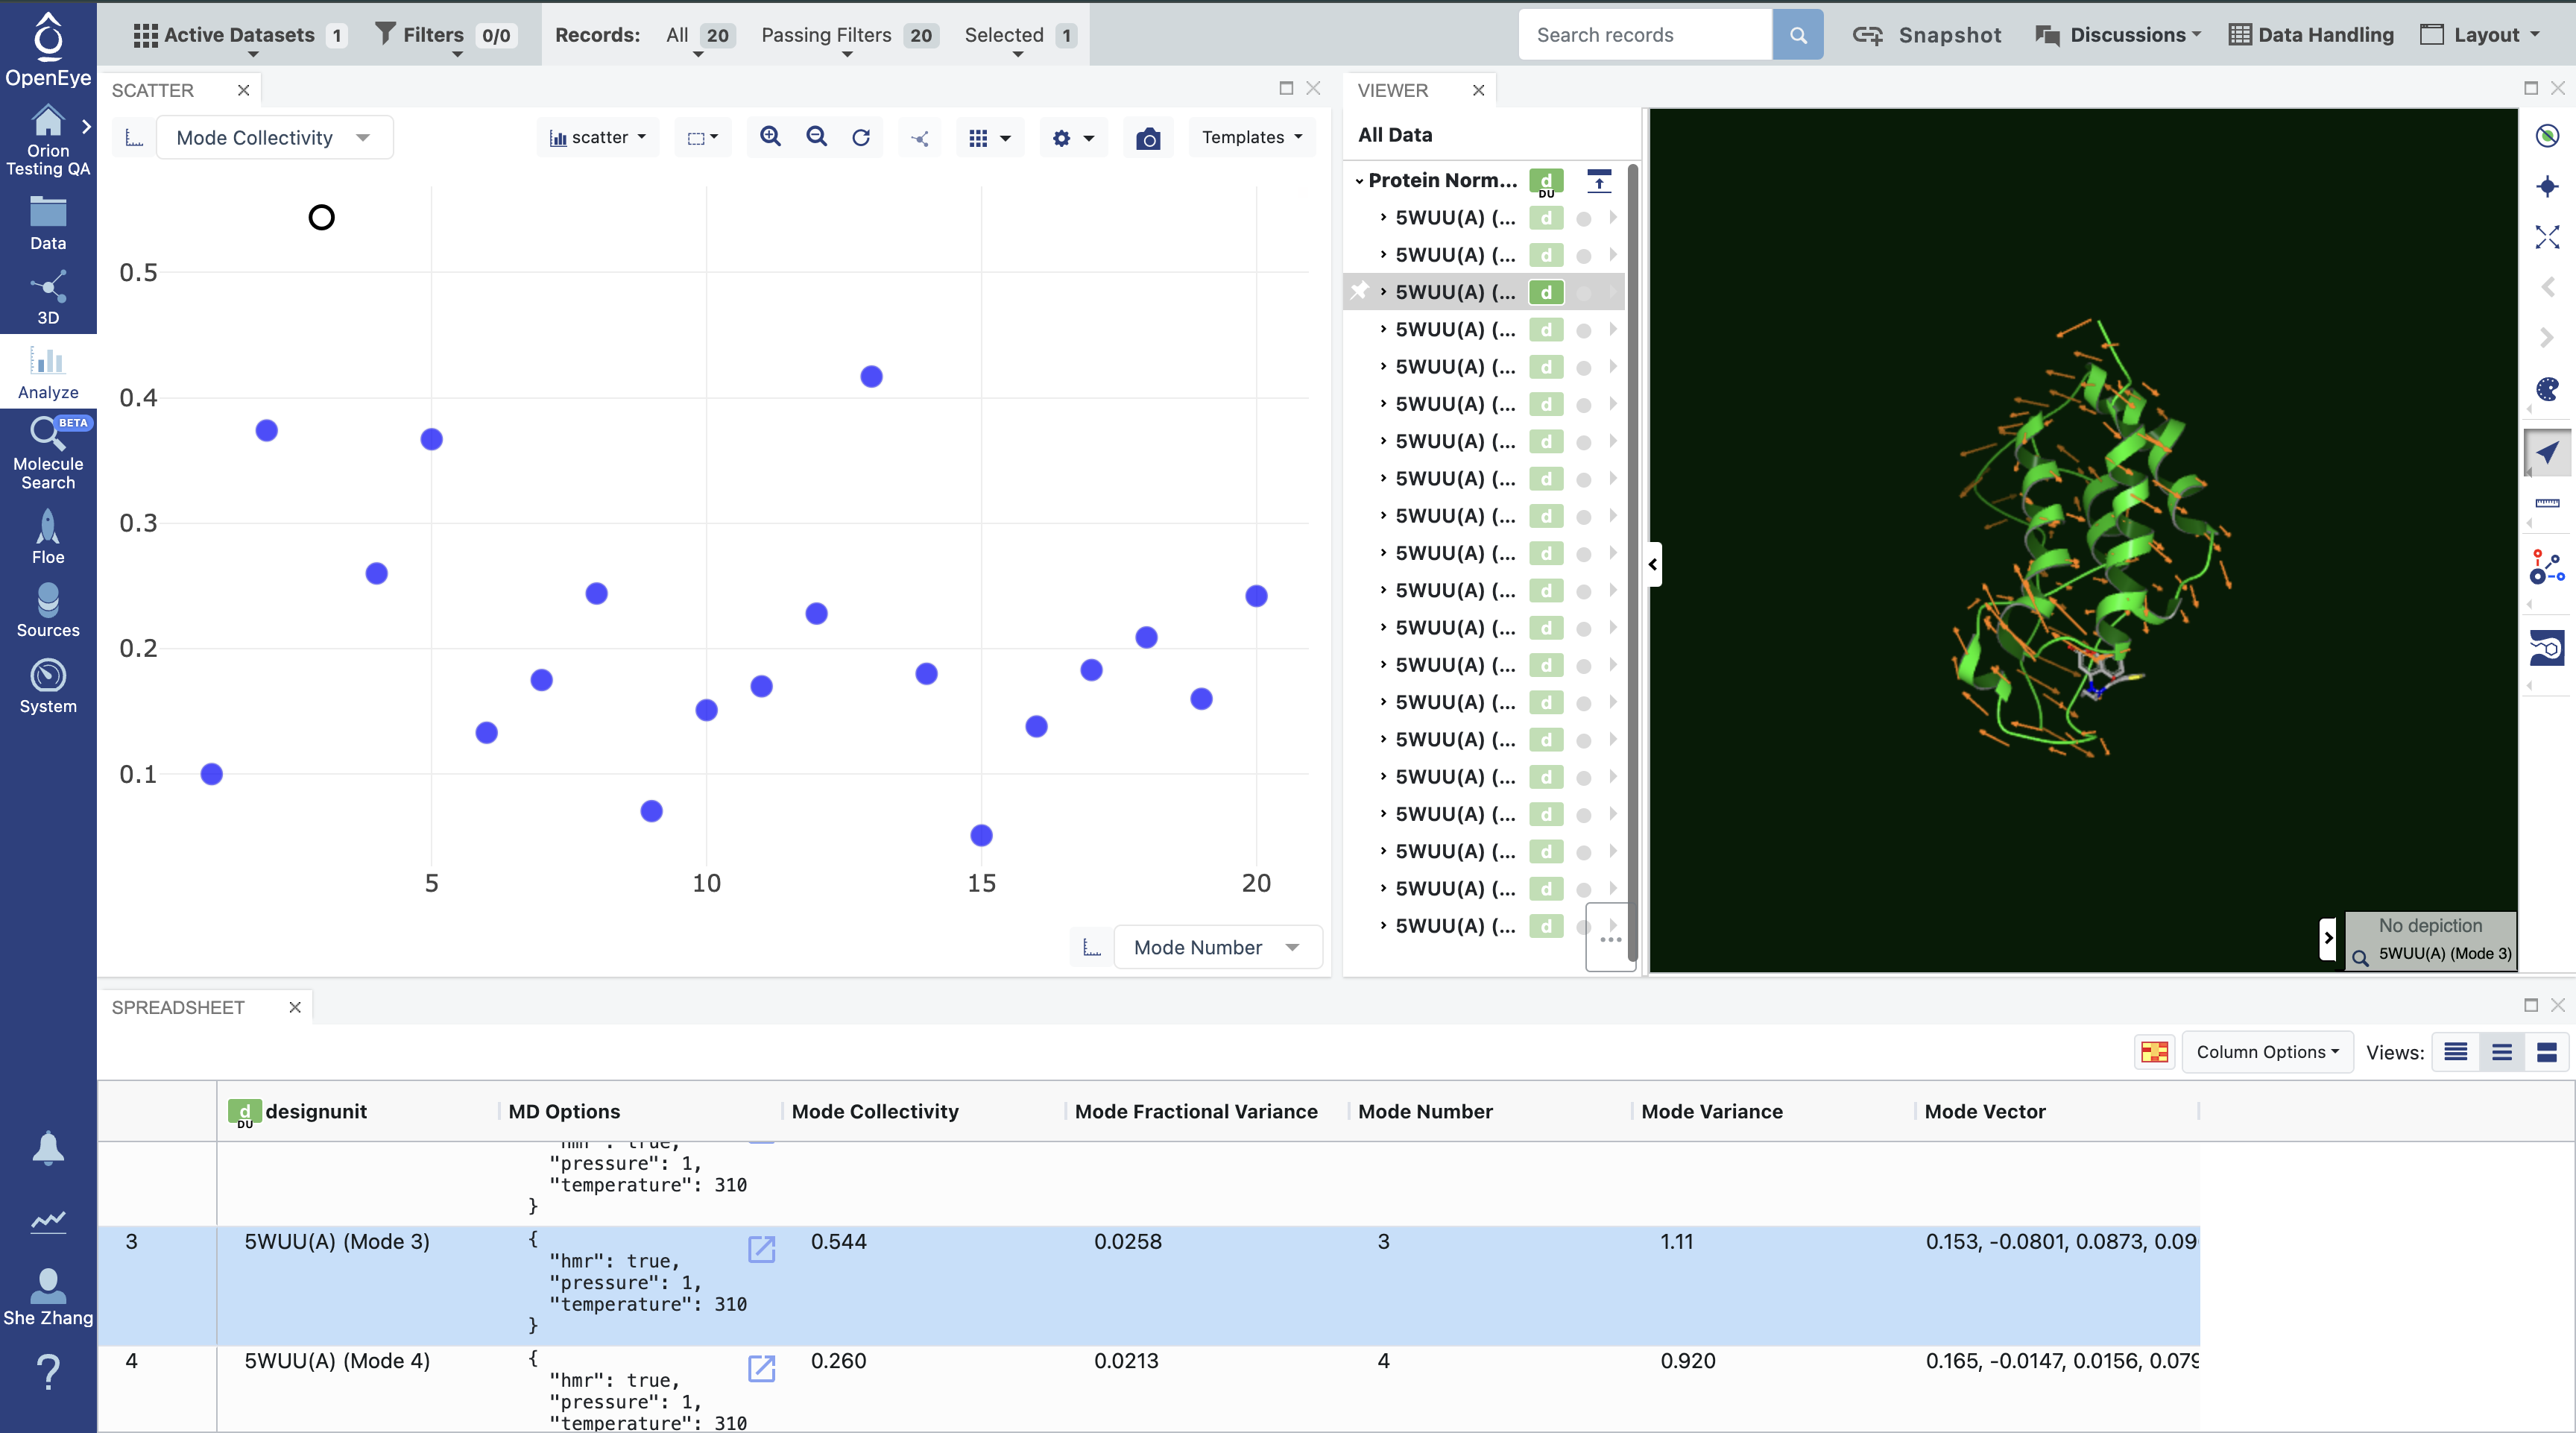
Figure 2. Analysis of the normal mode analysis dataset.
Select Normal Modes for Weighted Ensemble MD Simulation
Mode numbers are assigned to the modes, ranking them from the lowest frequency modes to the highest. By default, if you have not set a value for the Maximum Number of Selected Modes, the top 20 modes (out of thousands) are calculated. As mentioned above, modes with the lowest frequency, or equivalently, the highest magnitude, tend to describe global motion. However, low frequency modes may also correspond to modes where free loops or trailing protein tails dominate the normal mode. This is called the “tip effect.” To avoid issues caused by the tip effect, we recommend picking the modes with high Mode Collectivity among the top 20 modes using the graph in Figure 2.
The tip effect can also be avoided by selecting a subset of residues on the protein that exclude loops and/or portions of the protein that you know will dominate the normal modes. In the floe, this can be done by specifying the range(s) of residues that are considered part of the system, excluding the tail region, using the System Selection String parameter. The general syntax follows
[chain_id]:[from_res_num]~[to_res_num]
In practice, this would look like A:1~150 when selecting residue numbers 1 to 150 on chain A of
the input protein. Omitting either from_res_num or to_res_num allows for open-ended selections. For example,
A:10~ can be used to select any residue with a residue number greater than or equal to 10. A:~150 will select
residues up to residue 150. The chain_id can be also omitted, so that the selection will be applied on every
chain. For example, 1~150 will select residues from 1 to 150 for all chains.
Note
The selection is made based on the input structure, so please make sure to get the residue numbers from the design unit you input to the Calculate Normal Modes Floe.
The Calculate Normal Modes Floe also provides more advanced methods for dealing with the tip effect using the system–environment methods. In short, with this approach, the protein is divided into two parts, the system and the environment. Then, normal modes for the system can be calculated with the effects from the environment being considered. This way, the tail regions can be labeled as the environment, so that their motion is excluded from the modes of the rest of the protein (system), while their effects on the rest are still incorporated into the modes. This method can be turned On by setting the System Selection String parameter to the main part of the protein (i.e., non-tail region). The rest of the system will be considered the environment unless you use the Environment Selection String to specify the range of the environment using the same syntax as described above.
Last but not least, two system–environment methods are provided by the floe. The Slice method performs the original normal mode analysis on the whole system and simply extracts the subsystem portion of the motion from each mode. The Reduce method calculates the modes of the subsystem with vibrational energy terms from the environment being minimized and integrated out [Woodcock-2008]. One of these two methods can be chosen under the System-Environment Framework parameter. The default option is Reduce.
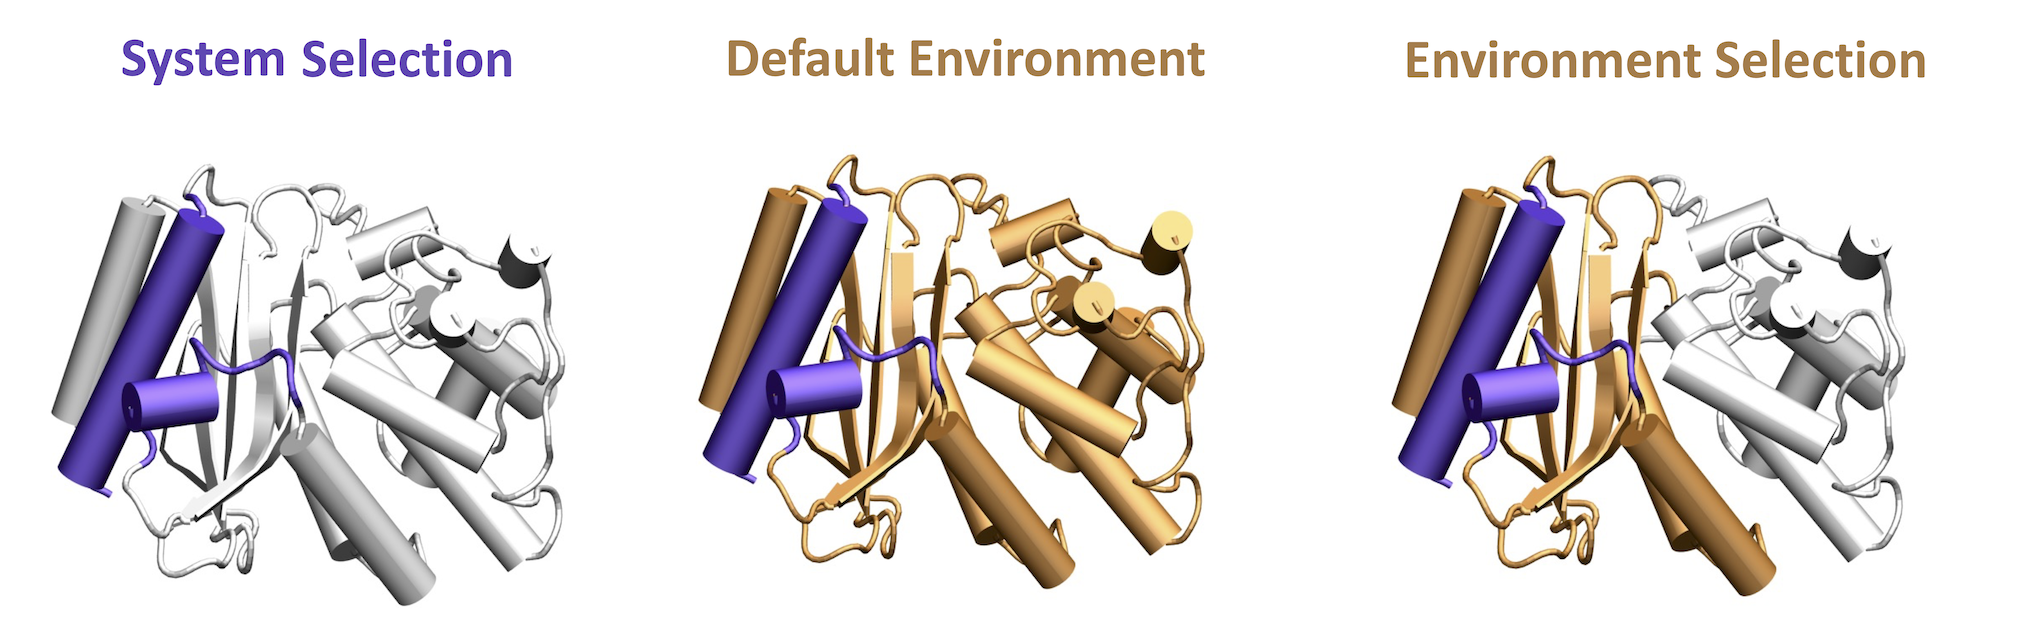
Figure 3. The system and the environment for normal mode calculations.
In this example, we have not specified any residues in the System Selection String or Environment Selection String fields. As such, the calculation was performed on the whole protein. Inspecting the results of the analysis on the 3D & Analyze page allows you to identify modes that are desirable. In the event that you do not have modes that you specifically know will open and close a desired portion of the protein, we recommend choosing modes with high Mode Collectivity that you have inspected to ensure that the mode vectors (shown in orange) are sensible.
Comparison of the Reduce and Slice Methods
Effect |
Reduce Method |
Slice Method |
|---|---|---|
Orthonormal mode vectors |
Yes |
No |
Eigenvalue representation |
Selected system |
Full system |
Effect of the environment |
Implicit |
Explicit |
Recommended criterion for the top mode selection |
Variance |
Collectivity |