Perform Weighted Ensemble MD Analysis
Quick floe search term: CPD A4
This floe performs a range of analyses on weighted ensemble MD simulation data generated by the Run a Normal Mode-Guided Weighted Ensemble MD Simulation and Continue a Normal Mode-Guided Weighted Ensemble MD Simulation Floes and evaluates the extent of sampling and structural fluctuations observed during the simulation.
Tip
This job can take two hours to complete and costs approximately $20.
Search and Run the Floe in Orion
Locate the floe in Orion
Navigate to the Floe page using the blue navigation bar.
On the Floe page, click on the Floes Tab, where you will find a list of the available floes and packages.
Under the Category Floe Filters on the left, click on the caret next to the Packages filter to expand the list of packages and click on the OpenEye Cryptic Pocket Detection Floes package. This will ensure that the floes listed in the middle of the page are from this package.
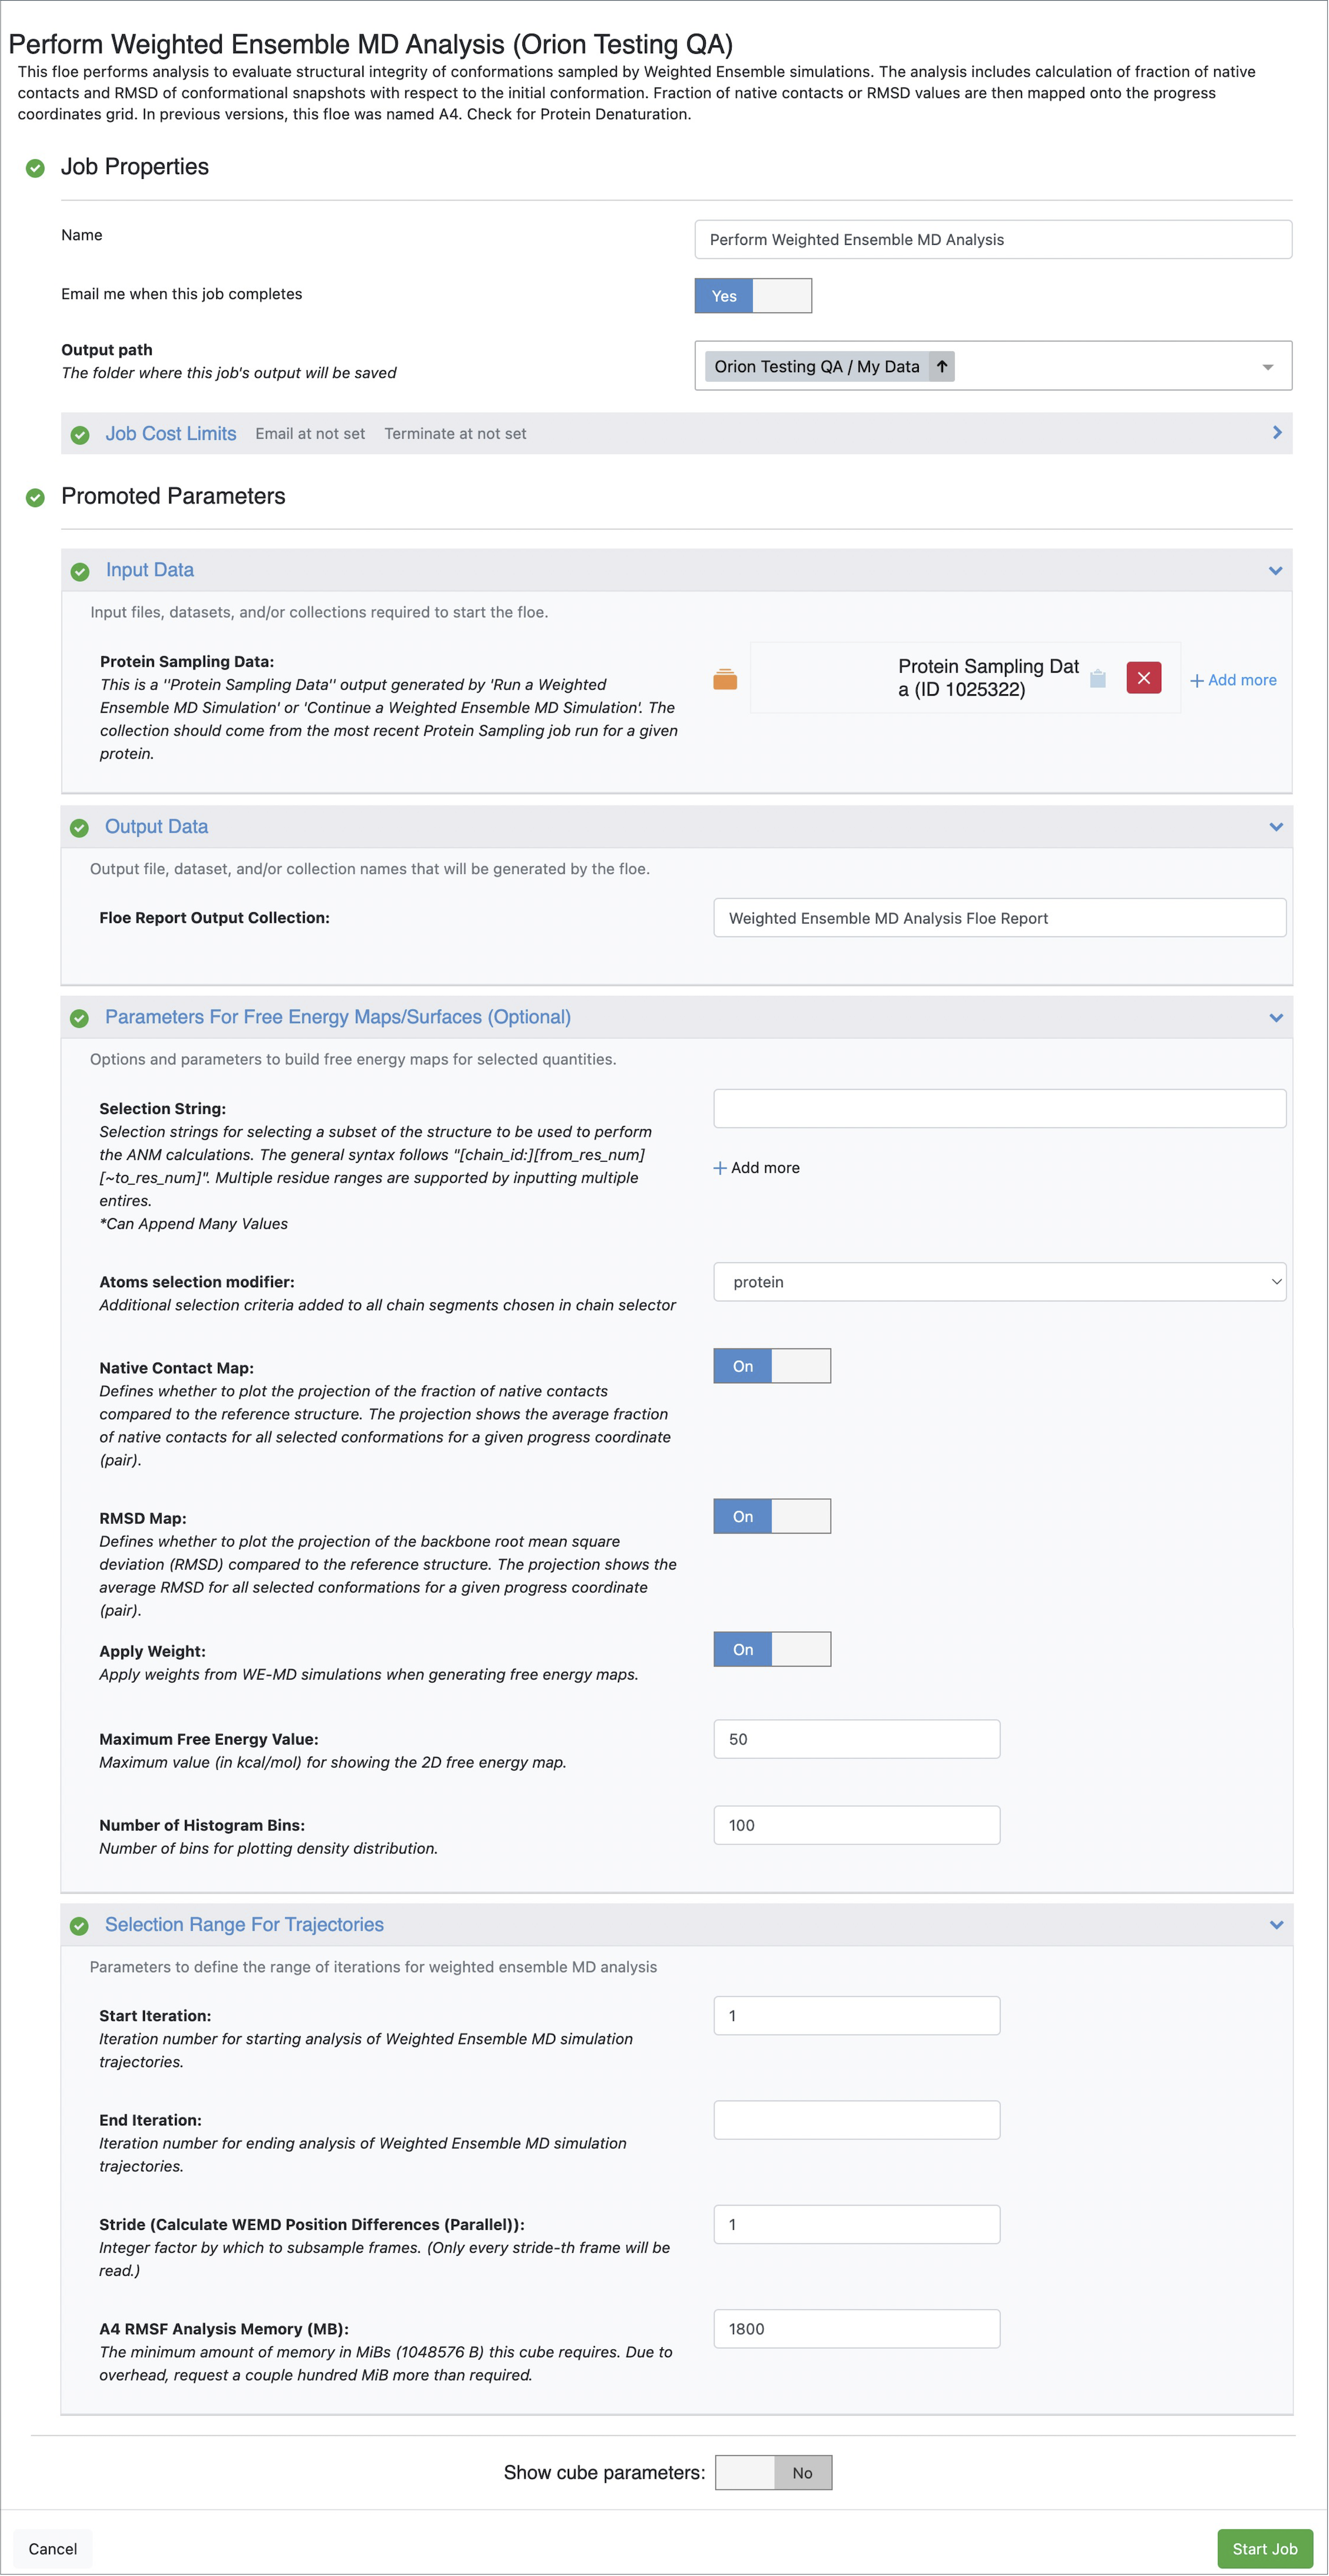
From this list, click on the Perform Weighted Ensemble MD Analysis Floe, and then click on the “Launch Floe” button to launch the Job Form as shown in Figure 1.
Provide Input Files and Parameters to Run the Floe
- Output path:
Select the destination for your output data by specifying the Output path.
- Input Data:
You will need to provide a Protein Sampling Data collection generated by the Run a Normal Mode-Guided Weighted Ensemble MD Simulation Floe as an input.
- Output Data:
You can customize the output dataset and collection names here.
- Parameters For Free Energy Maps/Surfaces:
Advanced parameters to customize the type of weighted ensemble trajectory analysis are given under this section.
Selection String: You can define the set of residues on which to perform RMSD and Native Contacts analyses. This selection can be additionally filtered by choosing one of the options given under the Atoms Selection Modifier parameter.
Atoms Selection Modifier: If protein (default) is selected, RMSD and Native Contacts calculations will be performed on all heavy atoms of the selected residues. Other options include backbone (backbone heavy atoms), name==CA (C-alpha atoms), and sidechain (side chain heavy atoms).
You can optionally turn Off the Native Contact Map and/or RMSD Map options using the toggle switch given next to these parameters.
Apply Weight: This option can be turned Off if you wish to ignore the weights (from Weighted Ensemble MD) of the conformations in free energy calculations.
Maximum Free Energy Value and Number of Histogram Bins adjust the maximum free energy value to be displayed in the maps and the resolution of the free energy profiles, respectively.
- Selection Range For Trajectories:
Start Iteration: This parameter and End Iteration define the range of iterations to include in the trajectory analyses. The default setting includes all iterations starting from 1. By setting a number greater than 1 for Start Iteration, initial iterations can be excluded from the analysis.
End Iteration: If left unspecified, the entire simulation dataset is analyzed. You can select a number lower than the total number of iterations for which your weighted ensemble MD simulation was run.
Stride: By default, every frame will be included in the analysis. However, users can set this parameter value as n between 2 and 4 to read only every n th frame during trajectory analyses.
A4 RMSF Analysis Memory (MB): If your analysis fails due to insufficient memory, you can increase the memory requirement here and rerun the floe.

Figure 1. Job Form for the Perform Weighted Ensemble MD Analysis Floe.
Click the green “Start Job” button.
Visualize Weighted Ensemble MD Analysis Floe Reports
Access the Floe Reports
When the job is complete, all results will be gathered in the Weighted Ensemble MD Analysis Floe Report. To reach the Floe Report, navigate to the Jobs Tab on the Floe page and then click on the job that you want to inspect.
Weighted Ensemble MD Analysis Floe Report
Figure 2 shows Weighted Ensemble MD Analysis Floe Report page in its entirety. Figure numbers mentioned in the bullet points below refer to the figures within Figure 2:
Figure 1 shows the 2D probability distribution and negative log of the probability distribution projected onto the progress coordinates (normal modes).
Figures 2 and 3 show the 1D probability distribution and negative log of the probability distribution for each progress coordinate (normal mode).
Figure 4 shows the average fraction of native contacts conserved in the simulation projected onto the progress coordinates.
Figure 5 shows the average root mean square deviation (RMSD) of the conformations projected onto the progress coordinates. The initial protein structure (Spruce-prepared design unit) is used as the reference structure for RMSD as well as the native contact calculations.
Figure 6 shows the per residue RMSF calculation of the protein’s C-alpha atoms based on anisotropic network model (ANM) used to derive progress coordinates for the simulation.
Figure 7 shows the per residue RMSF calculated from the Weighted Ensemble MD simulation data. The plot on left shows RMSF of the backbone atoms for each residue, and the one on the right shows per-residue RMSF for side chain atoms. Per-residue RMSF values are obtained by averaging over the heavy atoms of a residue. The plots display both weighted (shown in green) and nonweighted (shown in pink) averages of RMSF. For the weighted calculations, conformational weights are obtained from the weighted ensemble MD simulations.

Figure 2. The Weighted Ensemble MD Analysis Floe Report page. The figure numbers mentioned in the bullet points refer to the figures within this figure, which shows the Floe Report in its entirety.