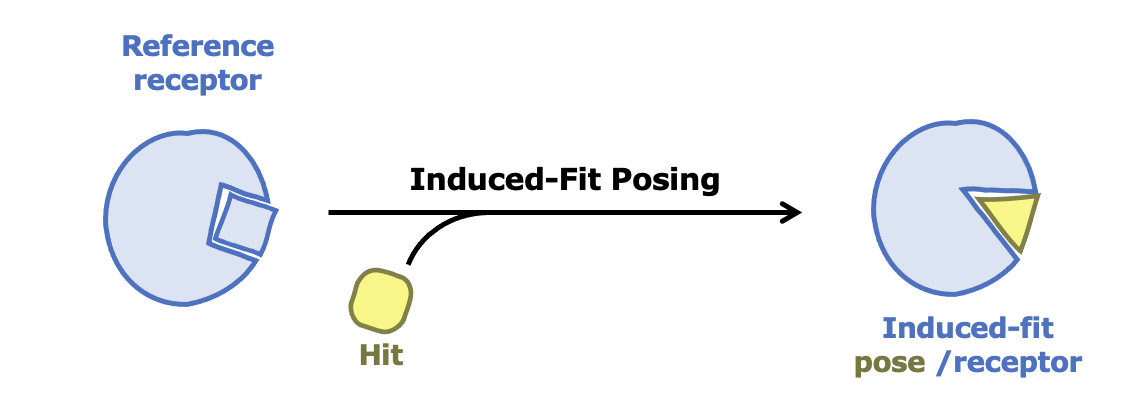
The primary purpose of the Induced-Fit Posing (Confined)
Floe is to generate favorable ligand binding pose(s) in the context of limited (i.e., confined)
local reorganization of the reference receptor (Fig. 1). Protein reorganization is
focused on (but not necessarily limited to) sidechains.
A single instance of the Induced-Fit Posing (IFP) Floe generates predictions
for a single ligand binding to a single receptor. To assess multiple ligands,
the Floe must be run multiple times.
Specify inputs. Minimally, the required inputs comprise:
the Ligand Input Dataset, which contains the ligand of interest, hereafter called
the hit ligand. In this dataset, the hit ligand must occupy a primary molecule field
and have reasonable 3D coordinates.
Note
the specific 3D coordinates of the input hit ligand do not affect the output of this floe.
the Reference Receptor Input Dataset, which is the protein to which hit ligand
binding will be predicted. This protein must be fully prepared for simulation,
for example by running a SPRUCE protein preparation Floe. Additionally, this input
dataset must contain a bound ligand, which we refer to as the reference ligand.
Although the chemical identity and bound pose of the reference ligand can be freely
varied at the discretion of the user, these properties will affect the resulting
IFP predictions.
the inputs listed above are sufficient to run this Floe. The remaining entries
outline the progression of steps that the Floe executes.
Define the collection of protein residues in the reference receptor that constitute
its ligand binding pocket. This identification is accomplished using metrics based
on the distance to the reference ligand and quantitative estimates of protein residue
backbone solvent accessible surface area.
Prune binding pocket residues in the reference receptor to alanine. This creates a
larger pocket for subsequent docking.
Dock the hit ligand into both pruned and unpruned binding pockets of the reference receptor.
To increase the probability that the docked ensemble contains accurate poses, this docking can
employ multiple methods: by default, it employs both ligand-guided (Hybrid) and ligand-free (FRED)
approaches.
Note
IFP aims (without guarantee) to generate a list of highly-ranked poses that includes at
least one accurate pose (target root mean square deviation (RMSD) < 2 Å). In some cases,
the most accurate poses will originate from pruned docking, whereas other cases may favor
unpruned docking. Likewise, either Hybrid or FRED may provide superior initial
models for a given system of interest. The default IFP procedure leads to a top-12 ranked list
of predicted binding modes because 2 docking methods * 2 treatments of binding pocket residues
in the reference receptor * 3 final models per approach = 12 (which may then be moderately
reduced due to conformational similarity).
Revert the reference receptor back to its original sequence and run a series of energy minimizations
to resolve any clashes that docking might have introduced.
A modeled series of equilibrations to permit limited (i.e., confined) induced fit as the
reference receptor relaxes around the hit ligand.
Finally, pose/receptor conformations are scored and ranked. The IFP Floe report and success dataset provide
quantification and 3-dimensional coordinates of up to 12 of the top-ranked pose/receptor conformations,
respectively.
Worked example #1: cyclin-dependent kinase 2 (CDK2)
The IFP Floe requires correctly prepared proteins up to “MD ready” standards which
require chain capping, full atomic definition (including hydrogens), the resolution
(or capping) of missing protein loops, and sidechain protonation state selection.
Cofactors and structured waters may be included.
We strongly recommend using SPRUCE protein preparation Floes.
This tutorial component utilizes the CDK2 receptor.
As the reference receptor, we select PDB ID: 2C6I [1], which has a bound triazolopyrimidine inhibitor [2].
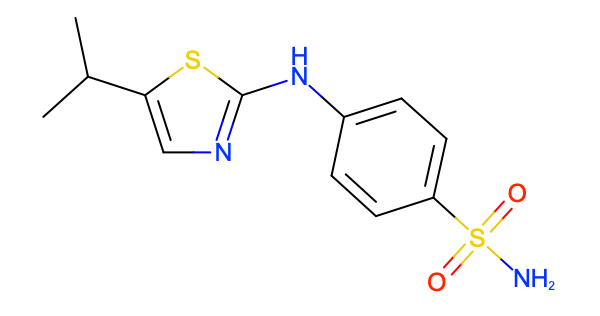
As the hit ligand, we select the 2-aminothiazole inhibitor PNU-230032,
4-[(5-Isopropyl-1,3-thiazol-2-YL)amino]benzenesulfonamide [3] (Fig. 2). The SMILES of the ligand
is CC(C)C1=CN=C(S1)NC2=CC=C(C=C2)S(=O)(=O)N.
For convenience, we collect this ligand from its CDK2-bound pose in PDB ID: 2BTS [4], [5].
The Reference Receptor Input Dataset used in this tutorial is:
The input has been prepared by running SPRUCE - Protein Preparation Floe with the parameters:
PDB code(s) to download: 2C6I, Ligand name(s): DT1.
(The dataset has been aligned by 1JSV, with the parameter Reference Structure Inputs/Optional PDB Code for reference DU: 1JSV.)
Additional guidance on how to run the Spruce Floe is available in the SPRUCE tutorial.
Note
If you are planning a series of IFP runs using similar reference receptors,
it can be convenient to provide the SPRUCE - Protein Preparation
Floe with a PDB code for the Optional PDB Code for reference DU input that is
consistent across SPRUCE runs. This will facilitate three-dimensional visualization by
providing a common reference receptor alignment. Although we have set this optional
input to 1JSV while generating the input datasets, this SPRUCE field can also be
left blank in preparation for IFP.
The Ligand Input Dataset used in this tutorial is:
The ligand input has been taken from the Spruced 2BTS DU dataset.
(The 2BTS DU dataset has been aligned by 1JSV, with the parameter Reference Structure Inputs/Optional PDB Code for reference DU: 1JSV.)
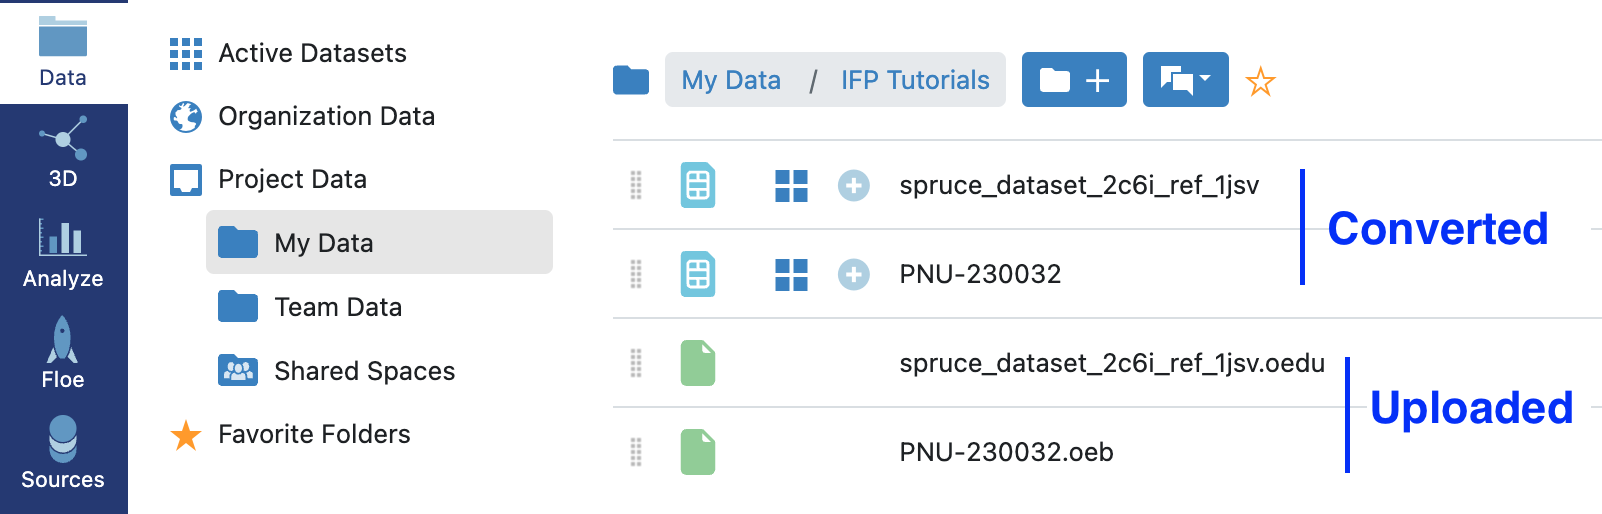
After you upload the downloaded files to Orion®, it will automatically convert them to datasets
(Fig. 3). All future work in Orion will utilize these datasets rather than the uploaded
files. Additional instructions for uploading files and managing directories in the
Orion user interface (UI) can be found in the OpenEye documentation as
text or
video.
Figure 3: Orion automatically converts uploaded files into datasets.
Caution
All IFP input datasets must have a single record. That condition can be assessed
directly in the appropriate Orion Data directory. In this example, both the
datasets generated by Spruce protein preparation do have a single record (Fig. 4).
Solutions for situations in which this is not the case are discussed at the end of this
worked example (Step #7).
Figure 4: Input datasets for IFP must have a single record only.
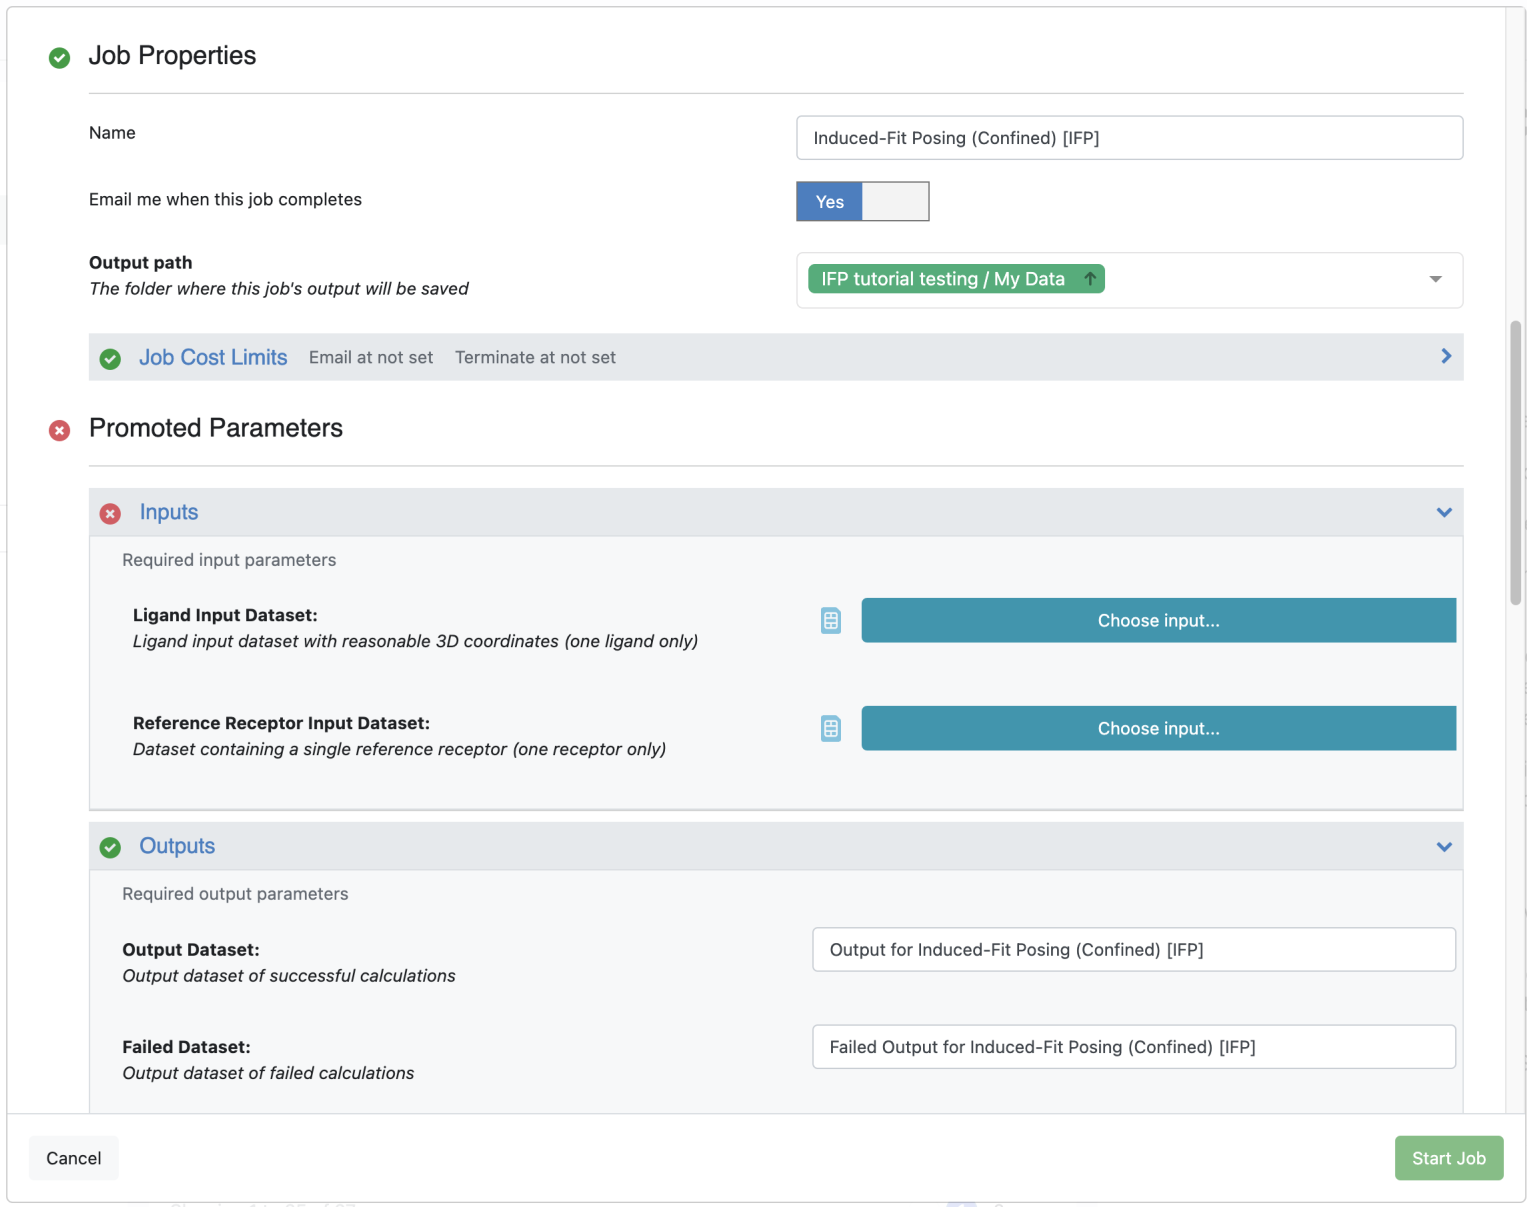
After selecting “launch Floe”, you will be presented with a job form on which inputs,
outputs, and parameters may be defined (Fig. 6). Although many options can be specified
or varied, only two are required:
Step 3: Verify that the IFP Floe completed successfully
If the Floe was configured to do so, you will receive an email when the job finishes. This
email will indicate the status of the job. If the job was successful, you should receive
an email that reads: Job “Induced-Fit Posing (Confined) [IFP]”, has completed successfully.
Caution
If the Floe failed, your email will instead read:
Job “Induced-Fit Posing [Test] [IFP]”, has completed with errors:
followed by a brief listing of the errors that were encountered.
In this case, you will need to re-run the Floe after diagnosing the
source(s) of the failure.
A successful IFP job will produce a number of output files, all of which can be
found by selecting the Data icon on the vertical menu that occupies the left hand
side of the Orion UI and navigating to the appropriate directory. An alternative
approach to access the outputs associated with the Floe is to select the Floes icon
on the vertical menu that occupies the left hand side of the Orion UI, then select
Jobs in the top horizontal menu, then left click on the name of the job submitted as
part of this tutorial. Ensuring that the JOBS tab is selected on the left side of the
screen will lead it to be occupied by three sections. The Results section will contain
links to most outputs, whereas the Reports section will contain a link to the Floe report.
Key IFP outputs are listed below and shown in Fig. 7.
The IFP Summary collection. This collection represents a Floe report that can be
viewed by left clicking on the light blue image of a page that sits beside it in
the data listing. Hovering over this light blue image of a page reveals the
text Open Floe Report.
The Output for Induced-Fit Posing (Confined) [IFP] dataset. This is the
Output Dataset of the Floe. Left clicking on the four blue squares that sit
beside it in the data listing opens the output dataset in a tile view.
Alternatively, this dataset can be added to active data using the associated icon of
a white plus sign inside a light blue circle, followed by left clicking on either the
Analyze or 3D icons on the vertical menu that occupies the left hand side of the
Orion UI.
Open the Floe report, either by navigating to the appropriate Data directory and
left-clicking on the light blue image of a page that sits beside the IFP Summary
collection in the data listing, or by using the appropriate link in the Job summary
(both methods described in more detail above).
The Floe report will open as a pop-up window. It is often convenient to view the Floe
report in full-screen mode by clicking on the open in a new tab icon near the
IFP Summary index text at the top of the pop-up. This icon is a square with an arrow
pointing out of its top right corner.
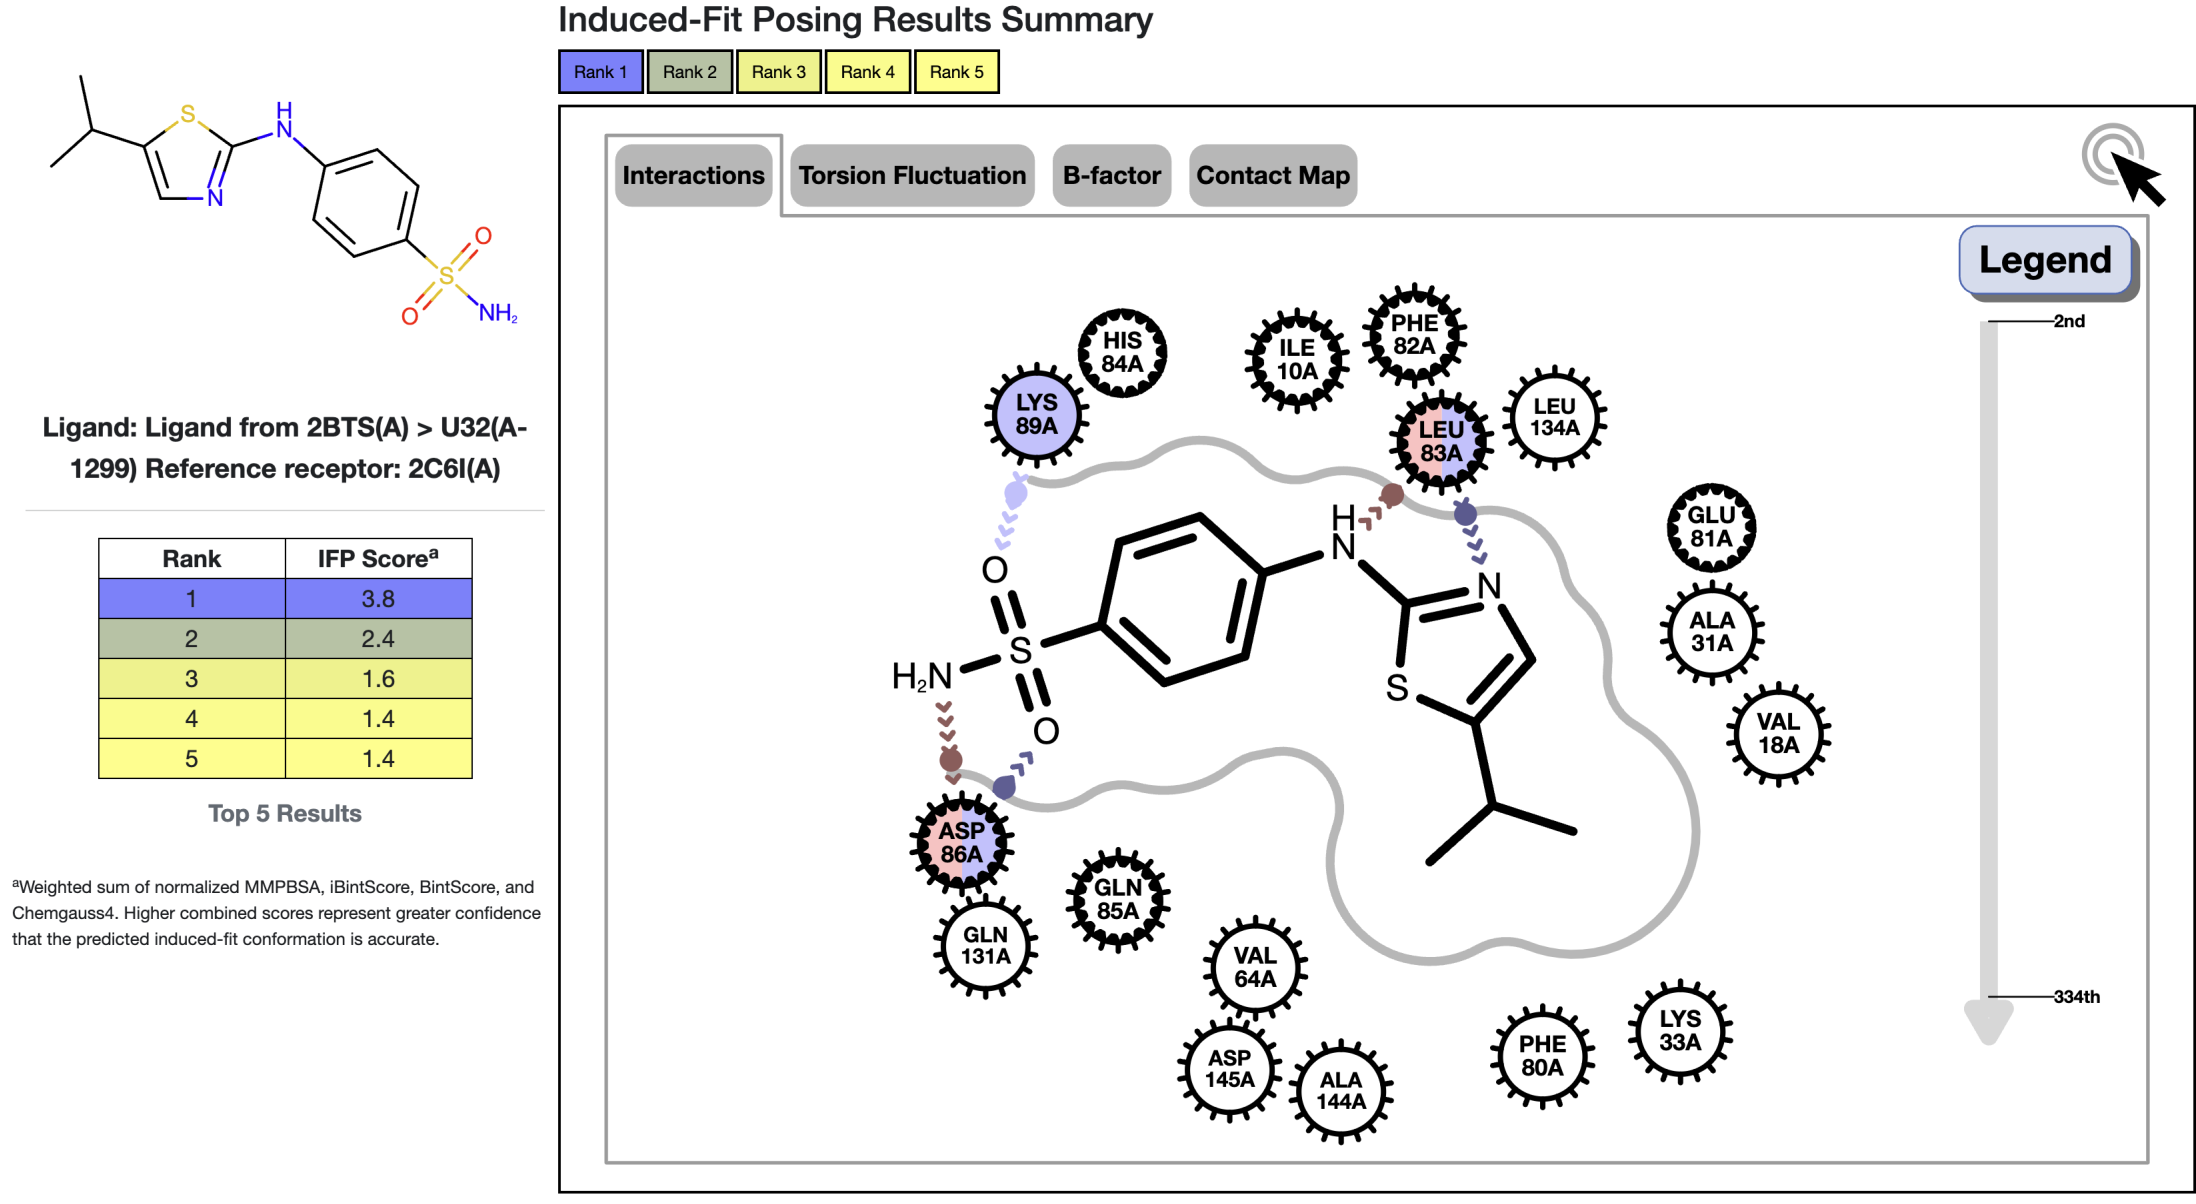
The top portion of the IFP Floe report for this CDK2 example is shown in Fig. 8.
It displays a variety of information about ligand-receptor interactions for the
5 top-ranked induced-fit poses. The IFP score is shown in the ranking table on the left.
The IFP score is a weighted sum of normalized MMPBSA, BintScore, iBintScore, and Chemgauss4
(terms described in more detail after Fig. 9).
Larger IFP scores represent greater confidence that the
predicted induced-fit conformation is accurate.
Figure 8: Top portion of the IFP Floe report for this CDK2 example.
Note
Additional guidance on the interpretation of the interactive images available
in the IFP Floe report is available in the short trajectory molecular dynamics (STMD)
tutorial,
the associated Floe report shares many common features.
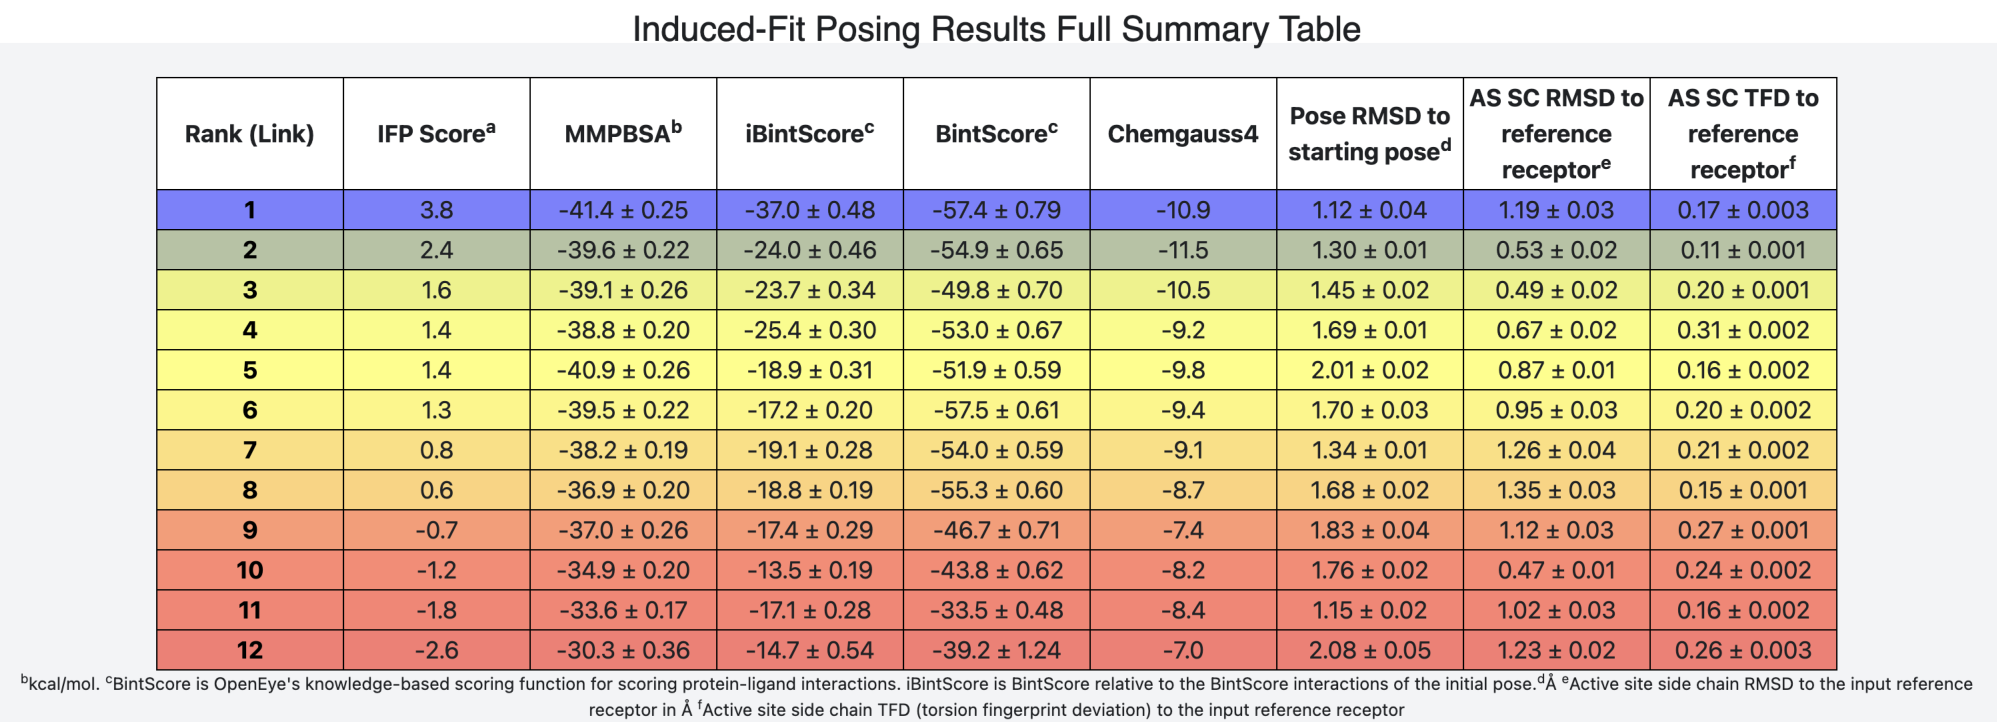
The bottom portion of the IFP Floe report for this CDK2 example is shown in Fig. 9.
It comprises a table that quantifies the characteristics of the top-ranked 12 poses.
(Note that the number of poses included in this table may be fewer than 12 if some
results were sufficiently similar to cluster together).
Figure 9: Bottom portion of the IFP Floe report for this CDK2 example.
The table in Fig. 9 shows:
The IFP score and its component metrics:
Molecular mechanics Poisson-Boltzmann surface area (MMPBSA) energy (in kcal/mol)
BintScore, which is OpenEye’s knowledge-based scoring function for scoring
protein-ligand interactions
iBintScore, which is the BintScore relative to the BintScore interactions of the
initial pose
The final pose RMSD to the initial pose (in Å), thereby
quantifying the conformational change in the ligand that occurred during the induced-fit
components of the procedure
Active site sidechain RMSD to the input reference receptor (in Å)
Active site sidechain torsion fingerprint deviation (TFD) to the input reference
receptor (in Å)
Note
The main IFP Floe report shown in Figs. 8 and 9 can be viewed directly as an interactive HTML file
here.
However, the per-ligand Floe reports usually linked in the lower table’s first column,
titled “Rank (Link)”, will not work in this version as those files are not provided with this tutorial.
In addition to the main Floe report (Figs. 8 and 9), each pose listed in the main Floe report table (Fig. 9) is
associated with its own pose-specific Floe report. These reports can be accessed by left-clicking on the first
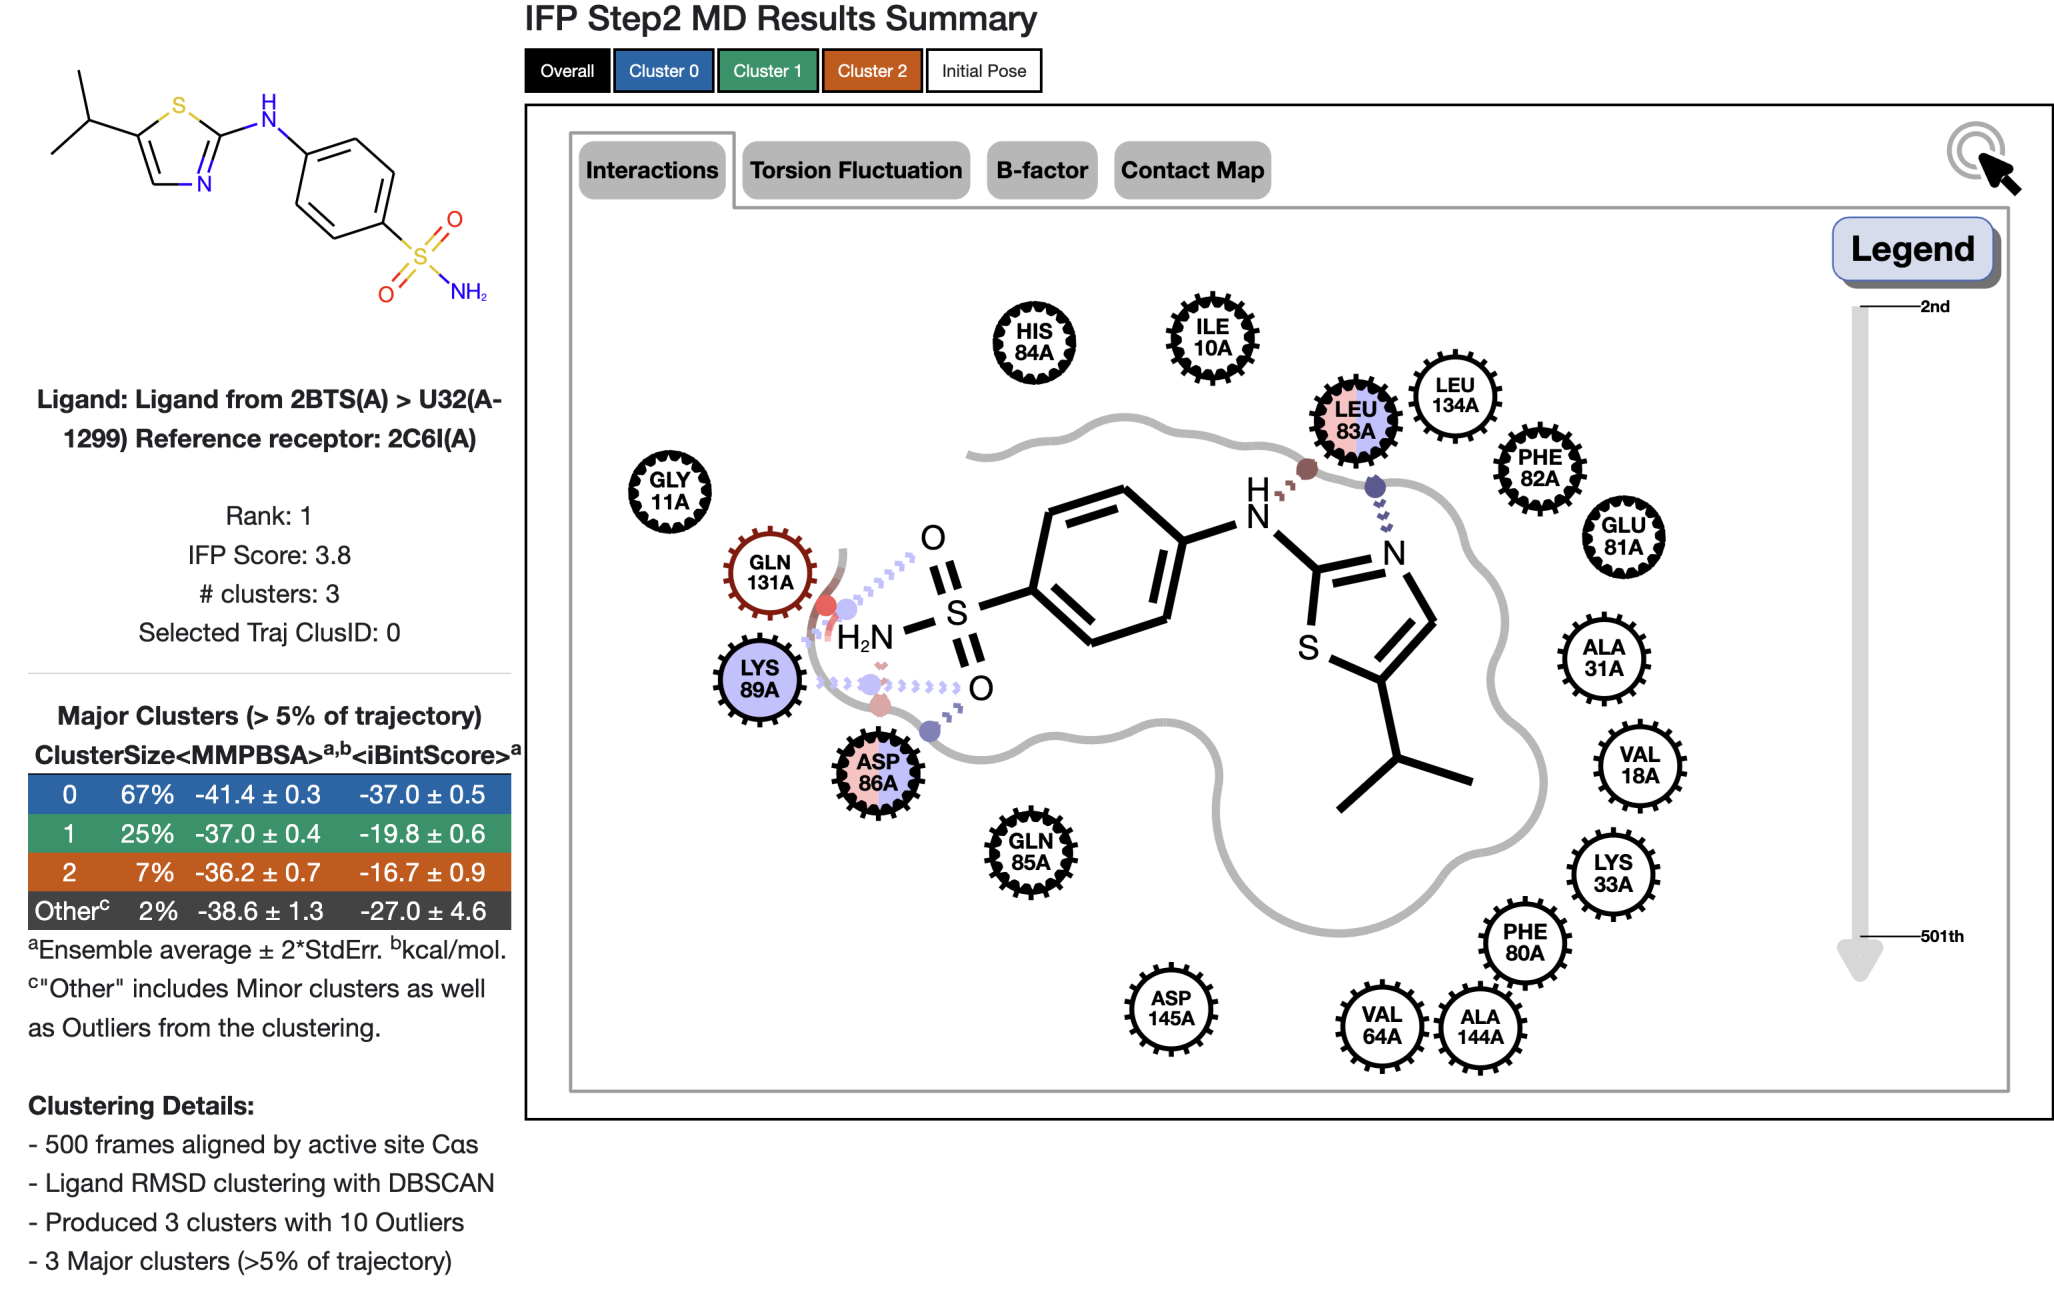
column in the IFP full summary table (Fig. 9). A sample pose-specific Floe report is depicted in Figs. 10-12.
Figure 10: Top portion of a pose-specific IFP Floe report for this CDK2 example.
Figure 11: Middle portion of a pose-specific IFP Floe report for this CDK2 example.
Figure 12: Bottom portion of a pose-specific IFP Floe report for this CDK2 example.
Note
The per-pose Floe report shown in Figs. 10-12 can be viewed directly as an interactive HTML file
here.
Step 5: Inspect and visually assess / re-rank the poses
One of IFP’s design goals is to increase the probability that an accurate pose is included in the top-ranked 12 poses.
In order to realize this goal, IFP uses a variety of docking methods despite the likelihood that some of these methods
will return poses of poor accuracy for some protein-ligand combinations. Because the IFP score is imperfect, we
recommend that users visually inspect and conduct a human-guided re-ranking of the top 5 ligands based on the IFP score.
To some extent, this visual inspection can be conducted in the Floe report. However, in this tutorial, we will use the
3D viewer of Orion’s UI.
To simplify your 3D viewing experience, you may want to hide or deselect any other active datasets via the
tool to add, hide, & view currently loaded datasets that is available at the top left of the Orion UI (Fig. 13).
Add the Output for Induced-Fit Posing (Confined) [IFP] dataset (the Output Dataset of the IFP Floe) to the
active data by left clicking on its associated icon of a white plus sign inside a light blue circle. Before we
proceed to the 3D viewer, we will also select the Reference Receptor Input Dataset you downloaded in Step 1. That
selection is done analogously using the icon of a white plus sign inside a light blue circle to activate the data from
spruce_dataset_2c6i_ref_1jsv.
Additionally, we will upload and activate the target receptor dataset:
The dataset has been prepared by running SPRUCE - Protein Preparation Floe with the parameters:
PDB code(s) to download: 2BTS, Ligand name(s): U32.
(The dataset has been aligned by 1JSV, with the parameter Reference Structure Inputs/Optional PDB Code for reference DU: 1JSV.)
Once these three datasets have been
selected (and ideally your Orion Active Datasets menu [Fig. 13] indicates that 3 datasets are active),
left click on the 3D icon on the vertical menu that occupies the left hand side of the Orion UI.
This will take you to Orion’s 3D viewer, preloaded with the top 12 (or slightly fewer) IFP output poses, the input
pose of the template ligand (from spruce_dataset_2c6i_ref_1jsv), and the crystallographic pose of the hit ligand
(spruce_dataset_2bts_ref_1jsv).
Note
Additional guidance on using Orion’s 3D viewer is available in the 3D modeling documentation. Additional information is available via a set of
videos.
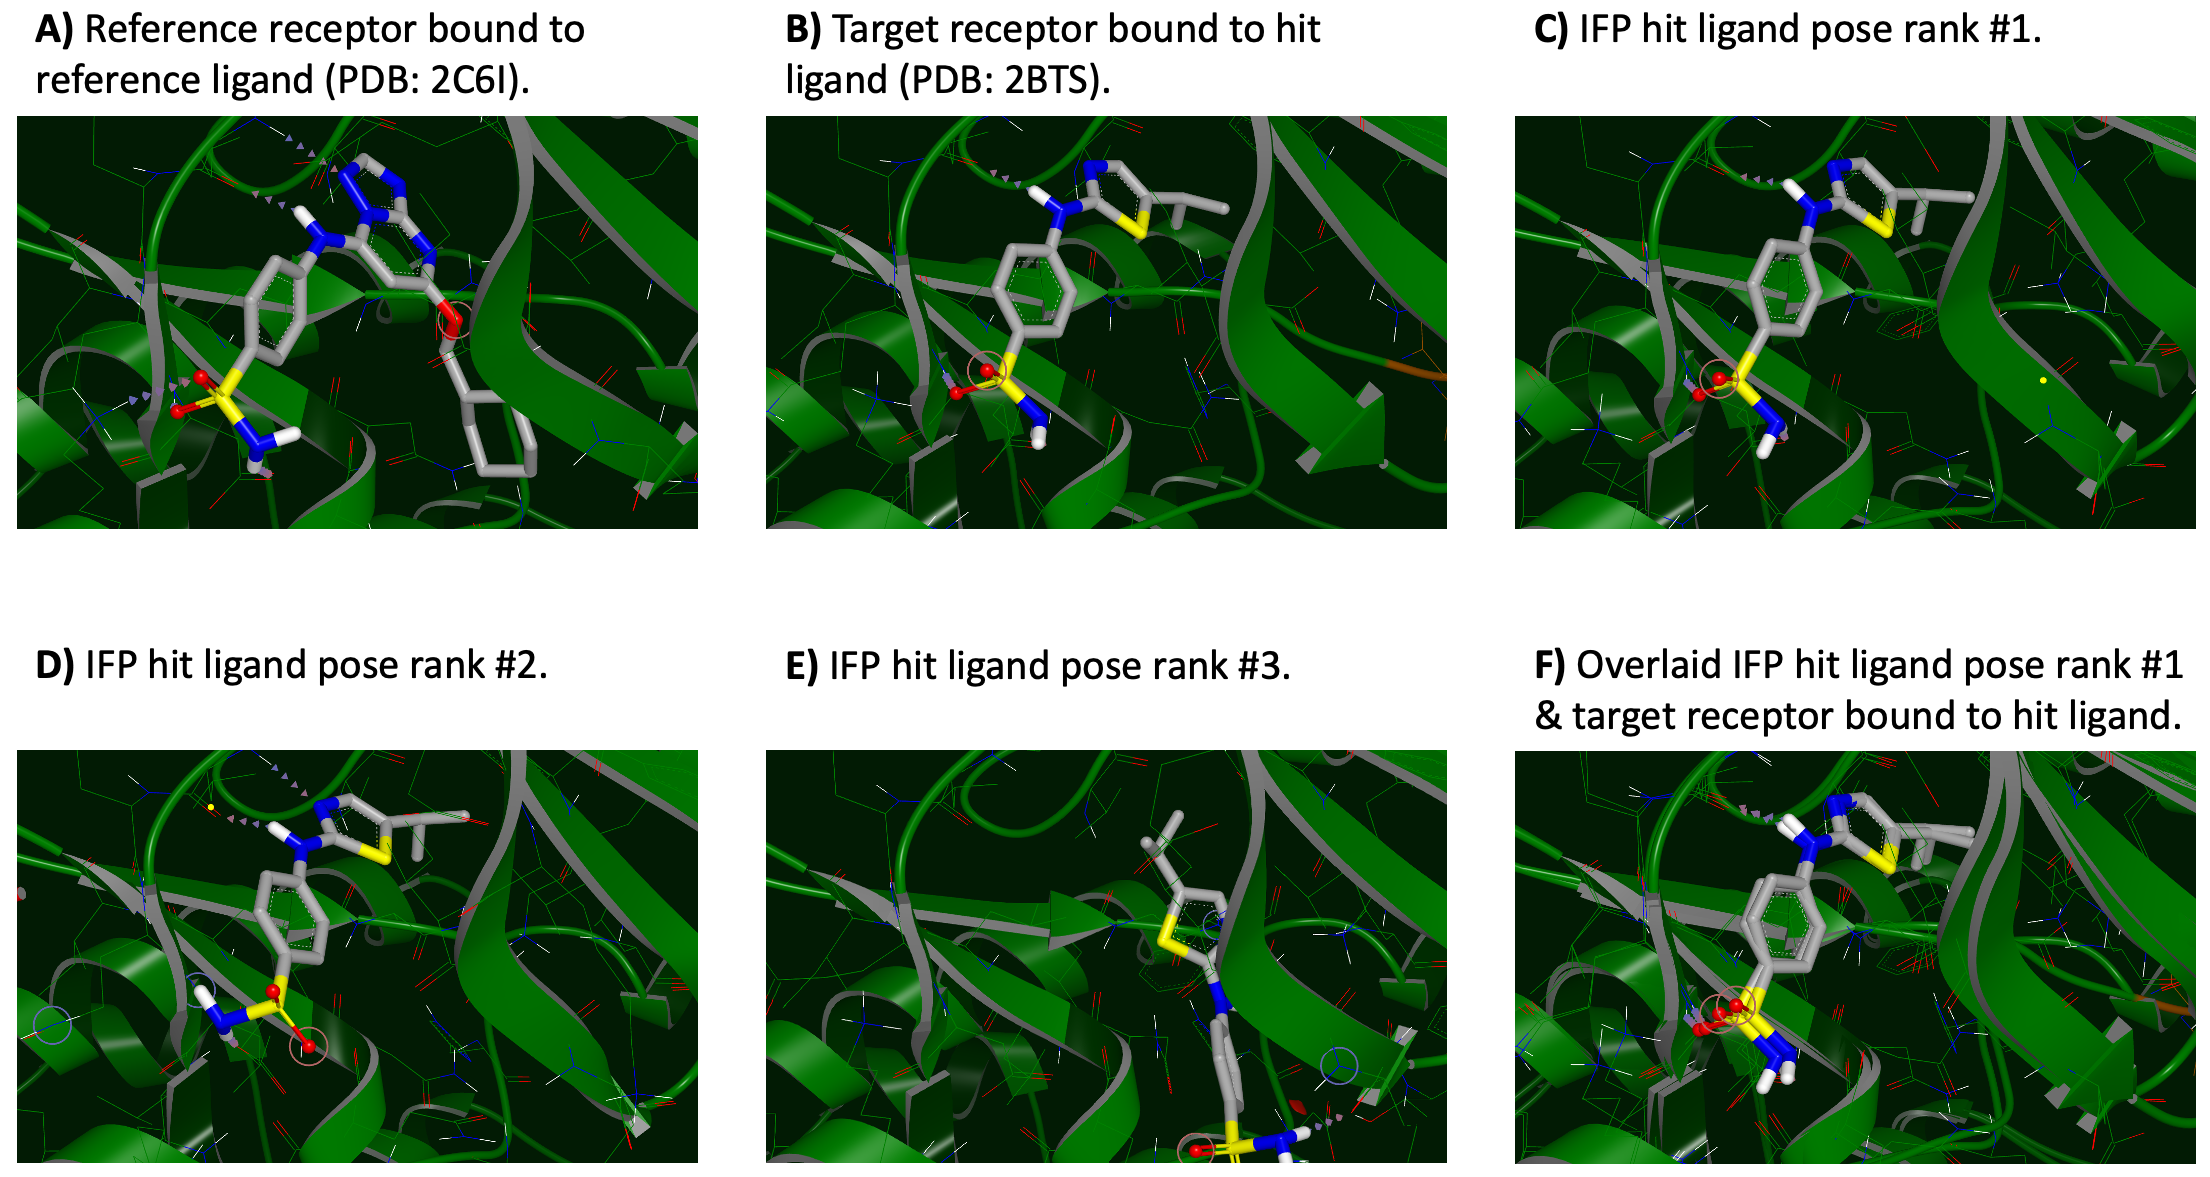
IFP predictions of PNU-230032 binding to CDK2 are shown in Fig. 14. In this figure:
Part A depicts the reference receptor in the crystallographic conformation it adopts when bound to the
reference ligand (the triazolopyrimidine inhibitor
4-{[5-(cyclohexylmethoxy)[1,2,4]triazolo[1,5-a]pyrimidin-7-yl]amino}benzenesulfonamide [6]).
Part B depicts the target receptor bound to the hit ligand (PNU-230032).
This represents the crystallographic pose that we take as the correct answer for PNU-230032 binding to CDK2.
Note that the reference and target receptors are both CDK2; we use this terminology to distinguish
conformations of the receptor and the identity and conformation of its bound ligand.
Parts C-E depict IFP output poses ranked #1-#3, respectively. Note the similarity between poses ranked #1 and #2,
and their divergence from the pose ranked #3.
Part F overlays part B (the correct answer) and part C (the top-ranked IFP pose).
Figure 14: 3D IFP predictions of PNU-230032 binding to CDK2.
Caution
In this example, IFP-generated poses ranked #1 and #2 represent accurate predictions. However, the appearance of the
most accurate poses at the top of the IFP-score ranking is, unfortunately, not always the outcome of an IFP Floe.
Therefore, we encourage the user to visually inspect at least the top 5 poses, and to consider re-ranking them via
expert human intuition or other computational tools such as additional STMD or conformation-specific nonequilibrium
switching (NES). Please note that we are still in the process of quantifying the comparative value of such
re-ranking approaches.
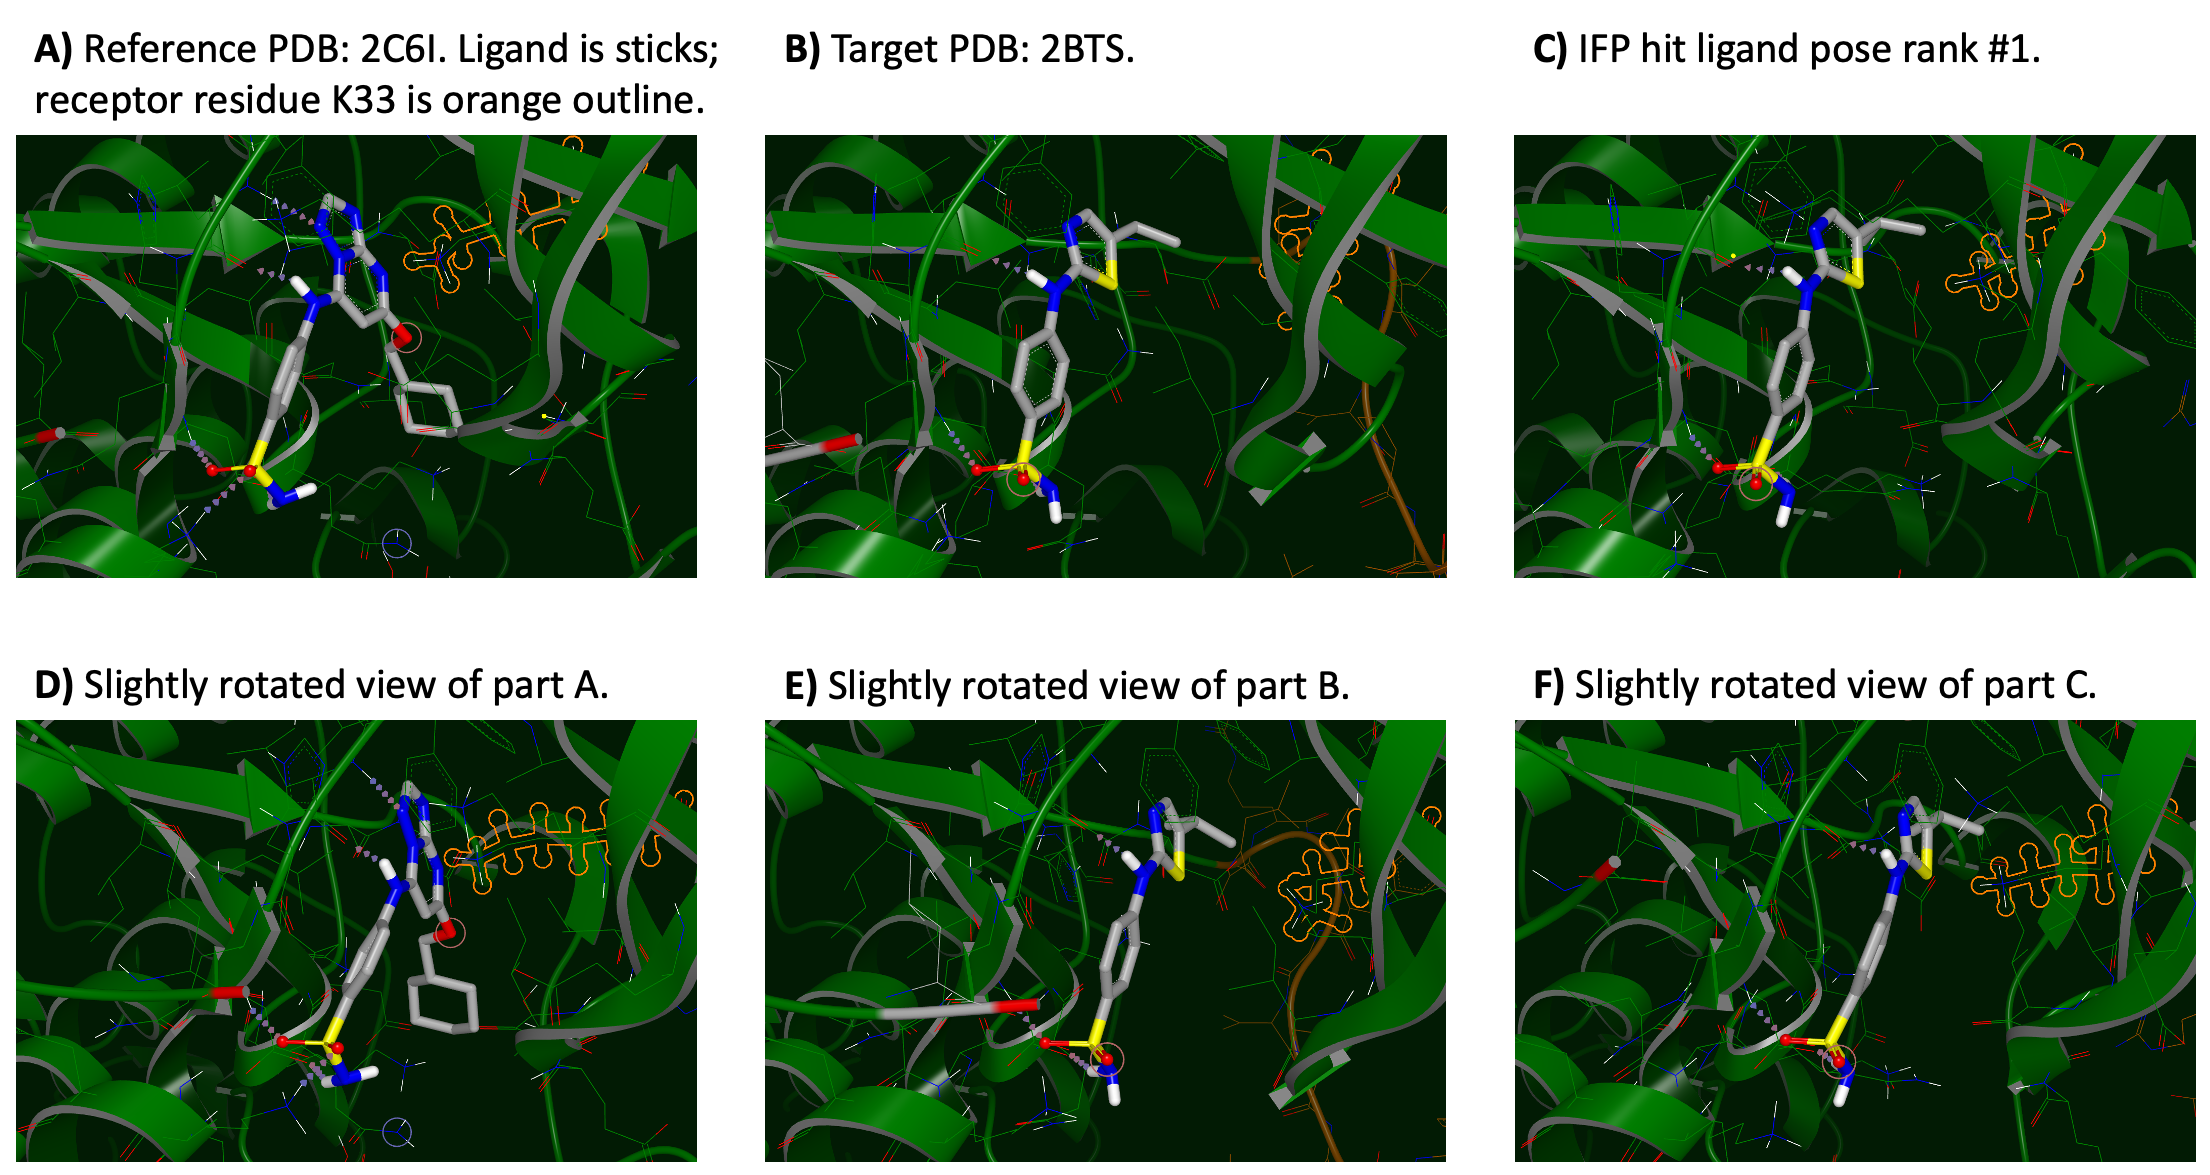
This CDK2 example provides insight into some of the benefits of IFP over rigid docking (Fig. 15). Fig. 15A shows the
Reference receptor input dataset, in which protein residue K33 adopts a position near the bound ligand. Conversely,
Fig. 15B shows that K33 rotates away from the ligand in the crystal structure with PNU-230032. The IFP result of the
top-ranked pose is shown in Fig. 15C. Here, protein residue K33 has rearranged from its starting position (Fig. 15A)
to permit PNU-230032 binding (Fig. 15C), though this rearrangement is less extensive than observed crystallographically
(Fig. 15B). Figs. 15D-F are provided to add more perspective, but are based on the same coordinates used to generate
Figs. 15A-C.
Figure 15: Movement of lysine 33 permits PNU-230032 binding to CDK2.
Step 6: Quantitative comparison to the known binding pose (when available)
After running the Induced-Fit Posing (Confined) Floe, it is possible to regenerate the Floe report while
augmenting it with quantitative comparisons to a known correct answer. For this purpose, we will use the
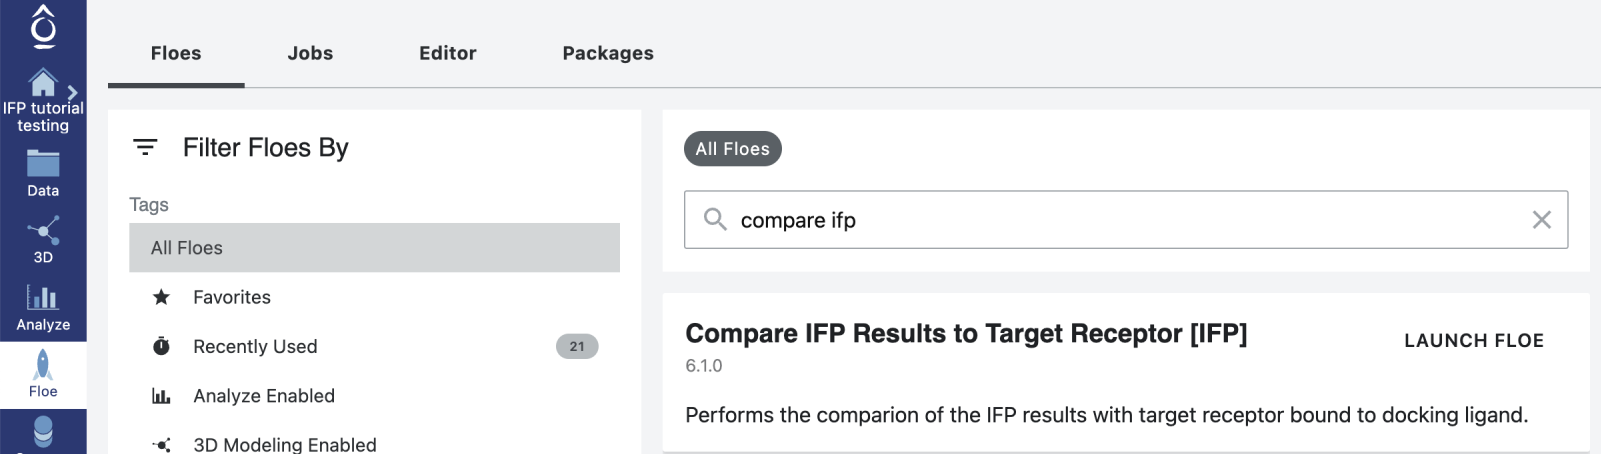
Compare Induced-Fit Posing (IFP) Results to Target Receptor Floe.
Find and launch the Compare IFP Results to Target Receptor Floe in the Orion UI (Fig. 16).
Figure 16: Launching the Compare IFP Results to Target Receptor Floe.
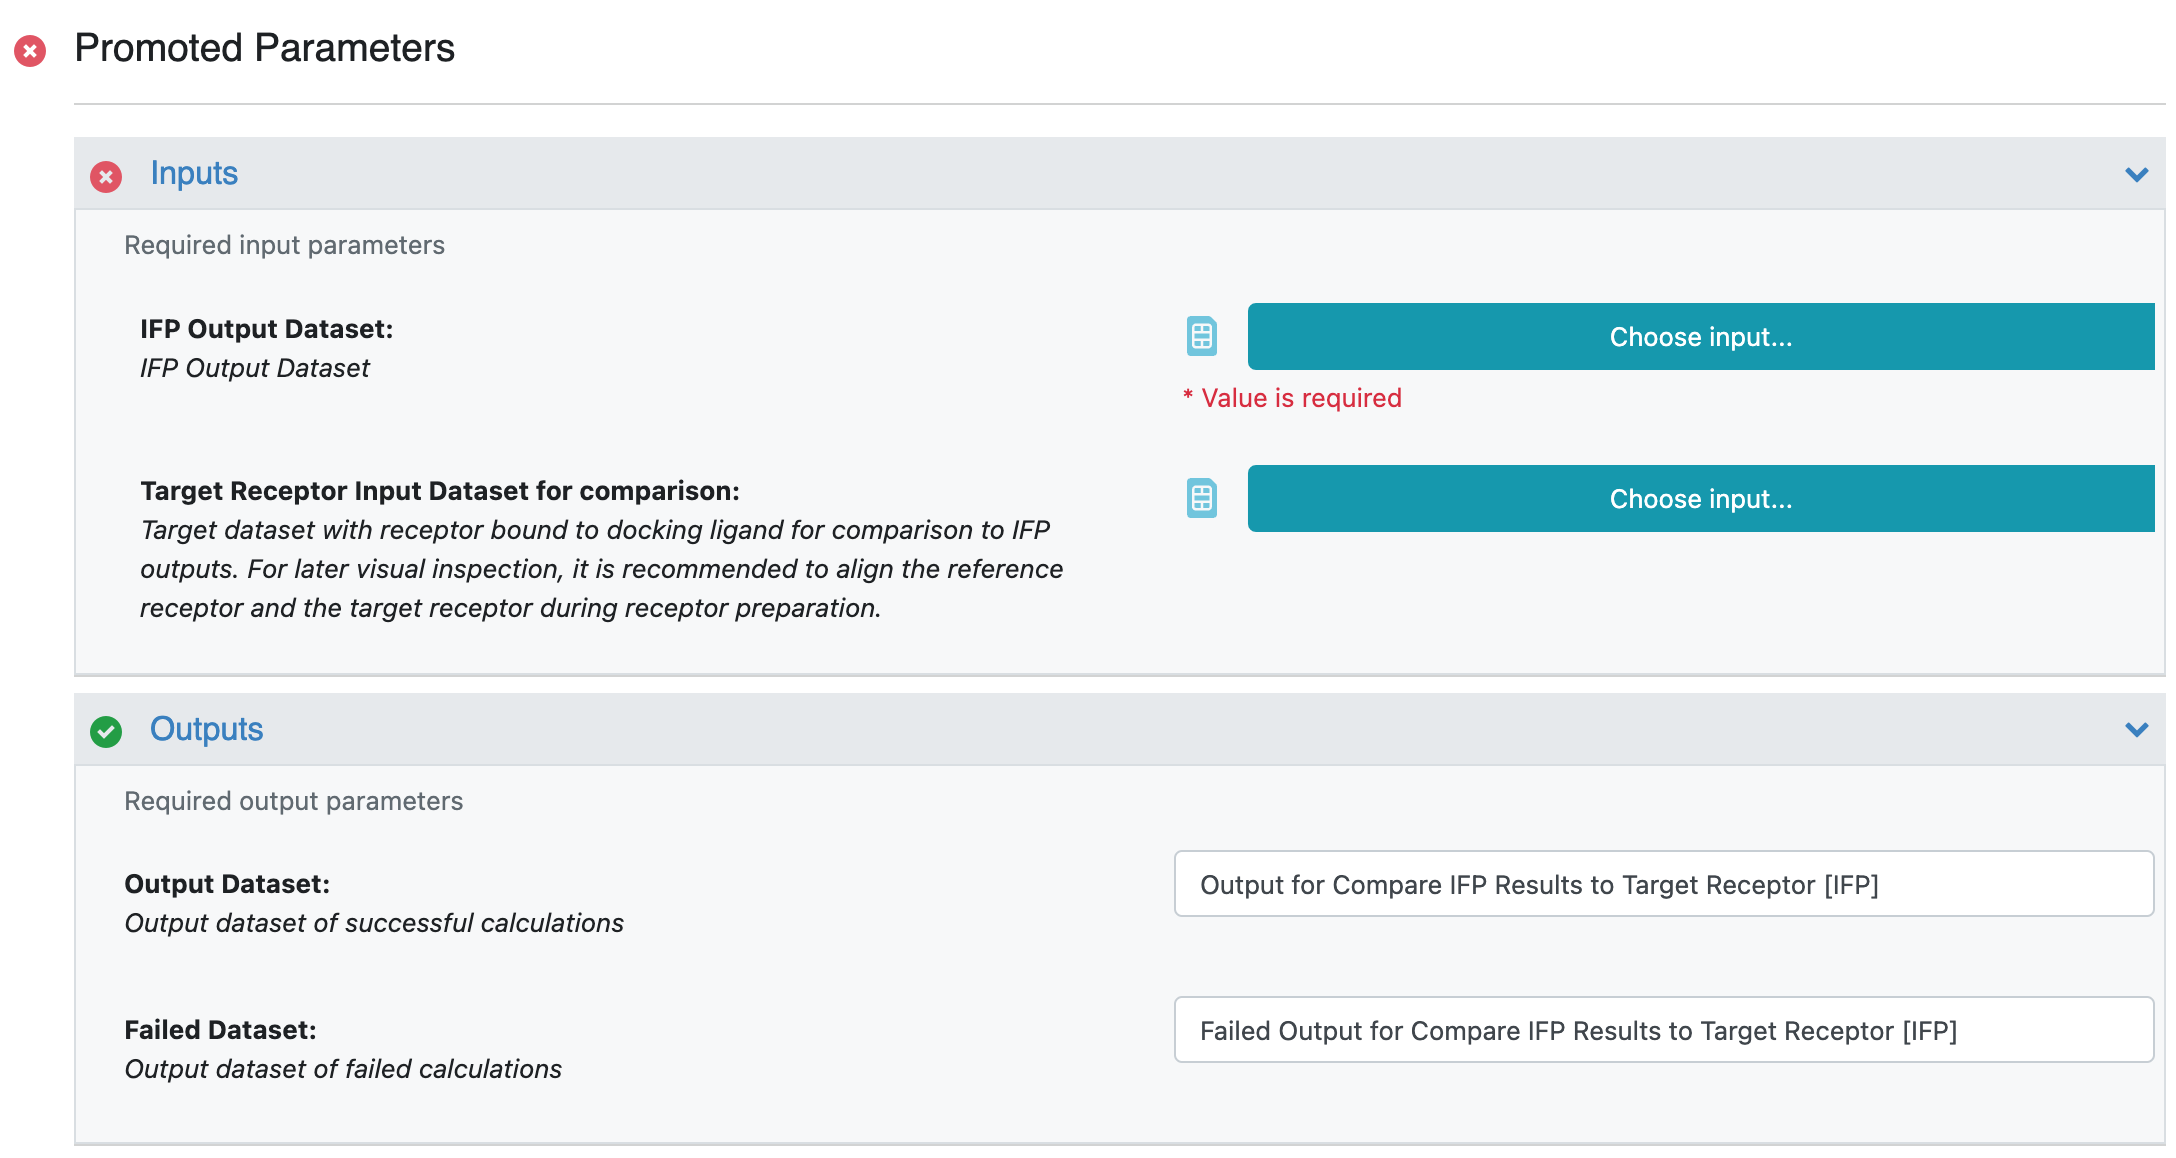
After selecting “launch Floe”, you will be presented with a job form on which inputs,
outputs, and parameters may be defined (Fig. 17). Although many options can be specified
or varied, only two are required:
The IFP Output Dataset, which is the output of the Induced-Fit Posing (Confined) Floe we just ran.
The default output dataset name is Output for Induced-Fit Posing (Confined) [IFP]
The Target Receptor Input Dataset for comparison, which describes the protein bound to the hit ligand
and defines what will be interpreted to be the correct result. This will usually be a dataset generated
by SPRUCE based on a crystal structure of the receptor-hit ligand complex. For this example, we will use
the spruce_dataset_2bts_ref_1jsv dataset, which you uploaded in a previous step.
Caution
When making comparisons to a known correct answer via an IFP Floe, it is imperative that the order in which
ligand atoms are defined is conserved between the Ligand Input Dataset and the dataset that will be used as the
correct answer as defined by the Target Receptor Input Dataset for comparison. If care
is not taken to ensure conserved atomic ordering between these two datasets, quantitative comparisons may be incorrect.
When you are satisfied with the Compare IFP Results to Target Receptor Floe setup,
press the green ‘Start Job’ button at the lower right.
When completed, this Floe will generate another Floe Report. Unless you renamed it in the Floe inputs
(non-promoted parameter Floe report title in the Generate Ligand Floe Report Cube),
this collection will have the same default name as the original Floe report (IFP Summary), except that there will be
a “ 1” added to the name by Orion to avoid duplication. This Floe report is broadly similar to the original Floe report
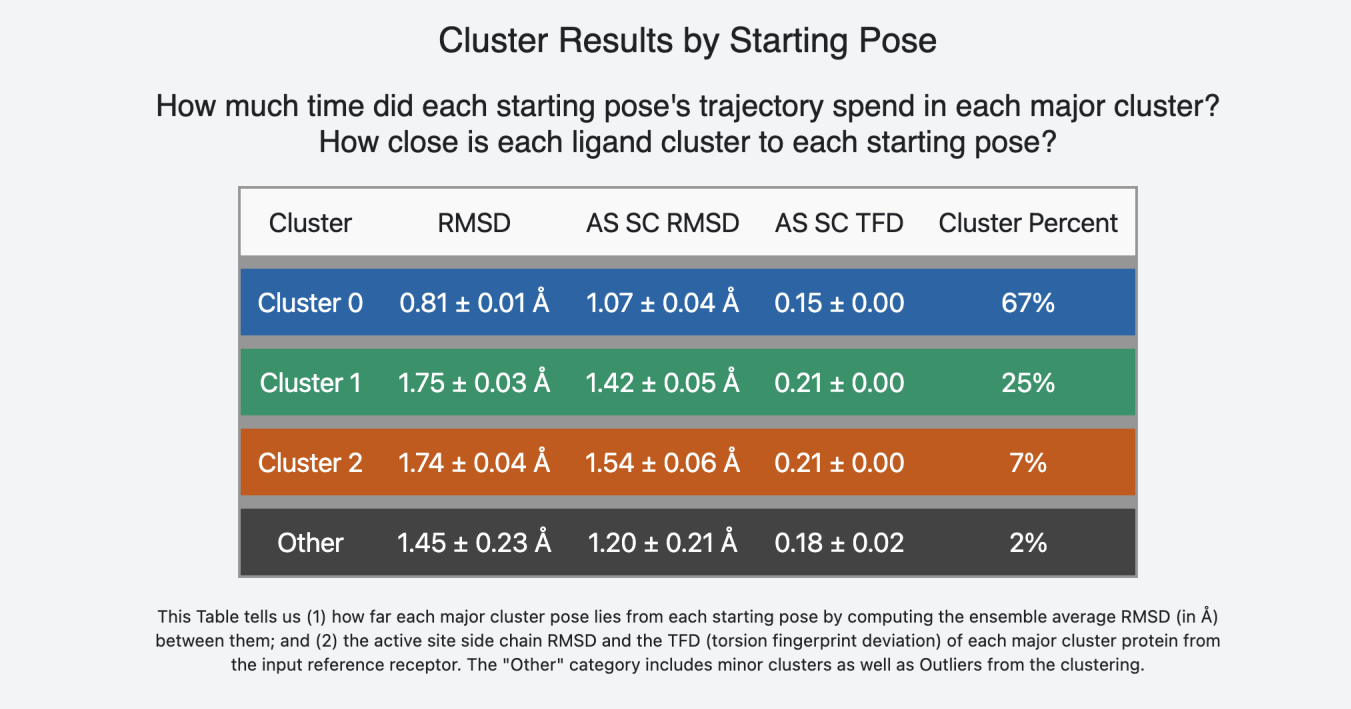
(Figs. 8-12), except that the table at the lower portion of the main summary report will have 3 additional columns:
Pose RMSD to target pose, which quantifies the accuracy of the ligand pose, given the defined
(possibly crystallographic) “correct answer”.
AS SC RMSD to target receptor, which quantifies the accuracy of the reorganization of the protein’s
active site (AS) sidechains (SC) upon ligand binding, given the defined (possibly crystallographic)
“correct answer”.
AS SC TFD to target receptor, which is similar to the previous metric, but uses a torsion angle fingerprint
deviation (TFD) in place of a SC RMSD.
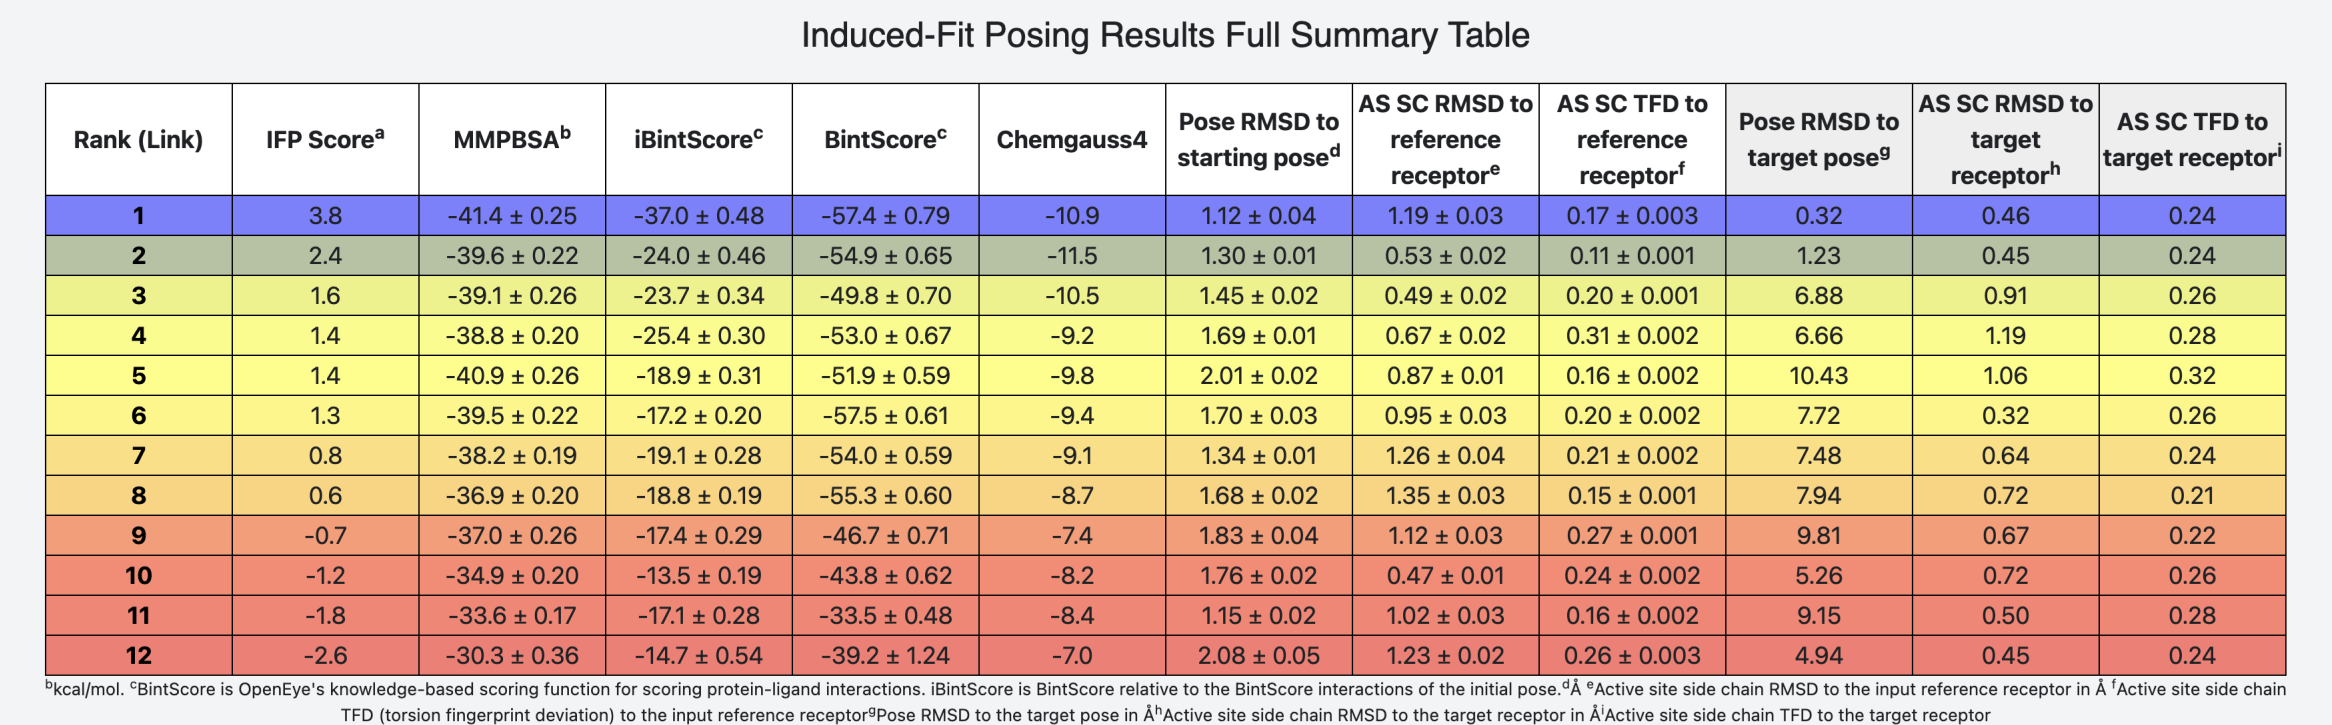
This table, which includes comparisons to the target pose and receptor, is depicted below in Fig. 18.
Figure 18: Bottom portion of the IFP Floe report for this CDK2 example; generated after running the
Compare IFP Results to Target Receptor Floe.
Consistent with the analysis up to this point, the third-last column in Fig. 18 (‘Pose RMSD to target pose’) reveals
that poses ranked #1 and #2 are highly consistent with the provided ‘correct answer’, whereas pose rank #3 is not.
In this example, poses ranked #1 and #2 are accurate (Figs. 14 and 18) and poses ranked #3 through #12 are
inaccurate (Fig. 18). However, the success of IFP for this pose/receptor pair across multiple testing runs is
the reason it was selected as the first worked example for this tutorial and IFP does not always work this well.
Caution
It is possible/expected for some high-accuracy poses to receive lower IFP scores than some low-accuracy poses.
It is also possible for the full top-12 pose list to lack any high-accuracy poses.
A more challenging application of IFP, in which the most accurate poses receive lower IFP scores than some low-accuracy
poses is provided as worked example #2 below.
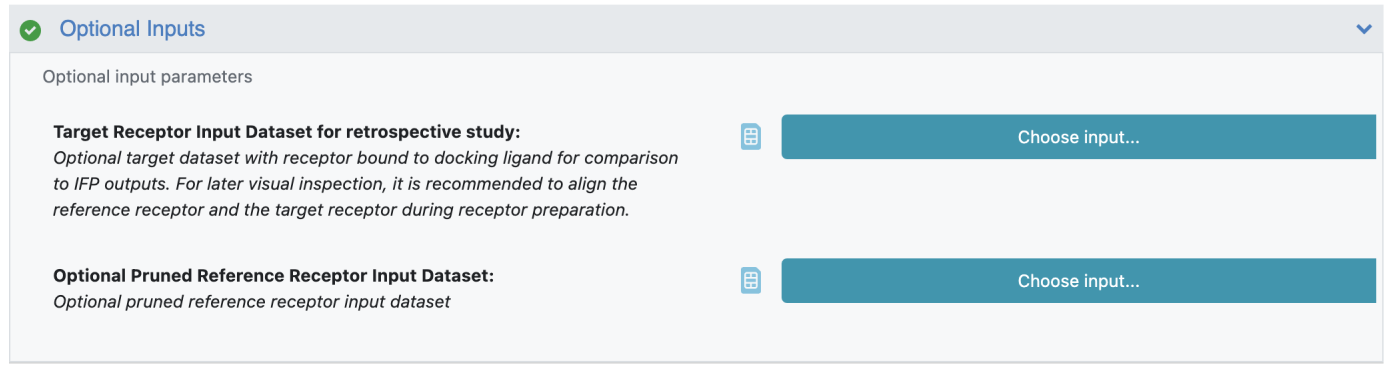
Note
In this tutorial, we used two separate Floes. First, we used the Induced-Fit Posing (Confined) Floe to generate
poses, followed by the Compare IFP Results to Target Receptor Floe, which compared those poses to the ‘correct
answer’ as defined by a crystal structure of the hit ligand bound to the CDK2 receptor. However, it is possible
to combine these steps. If a Target Receptor Input Dataset for retrospective study is defined in the
Induced-Fit Posing (Confined) Floe (i.e., by using the field shown in Fig. 19), then the table at the bottom
portion of the initial Floe report will contain the additional 3 columns comparing each pose to the target
receptor (as in Fig. 18).
Figure 19: Optional inputs to the Induced-Fit Posing (Confined) Floe can define the Target Receptor
Input Dataset for retrospective study.
Step 7: Check that your Floe inputs meet these important requirements
All IFP input datasets must have a single record. Any datasets with multiple records must be
converted to single-record datasets prior to their use in an IFP Floe. To do this:
Open the dataset in a tile view by navigating to the dataset in the Orion data viewer and left-clicking on
the four blue squares that sit beside it.
(Optional) If desired, sort the records. For example, if the input dataset is from a SPRUCE protein
preparation Floe, click on the header “Columns” and select the “ird_single”, which is the Iridium score. Then
click on the blue ‘Apply’ button. If it is available, this will label each record as either highly trustworthy
(HT), mildly trustworthy (MT), not trustworthy (NT), or not applicable (NA). For more information on the
Iridium score, see the OpenEye documentation
or the associated publication [7]
Left click on the record you want to use, then left click on the blue button reading ‘Save Selected Records’.
Select ‘New Dataset’ as the destination, enter a name for the new dataset, and define its directory path.
Verify that the new dataset exists and that it has only one record.
The new dataset can now be used as an input to an IFP Floe.
The Reference Receptor Input Dataset and the Target Receptor Input Dataset for retrospective study must be
aligned. If they are not aligned, then RMSD scores related to pose accuracy (e.g., in Fig. 18) will not be
correct. One convenient way to ensure similar alignment is to provide the same reference DU dataset to all
SPRUCE Floes. For example, when using the SPRUCE - Protein Preparation Floe, it may be
convenient to specify the same Optional PDB Code for reference DU across all SPRUCE runs as you prepare
input datasets for IFP.
The hit ligand and the target ligand (bound ligand of the target receptor) must have atoms defined in
the same order. They must also represent the same tautomeric state.
Worked example #2: phosphodiesterase type 5 (PDE5)
Steps 1-7 below go through setup, Orion submission, and data analysis for a PDE5 system. This mirrors the
general procedures outlined for CDK2 in example #1, above. The information provided below is substantially
less verbose than the analogous descriptions in the first example.
The estimated cost of the IFP Floe run for the example #2 is around $52.
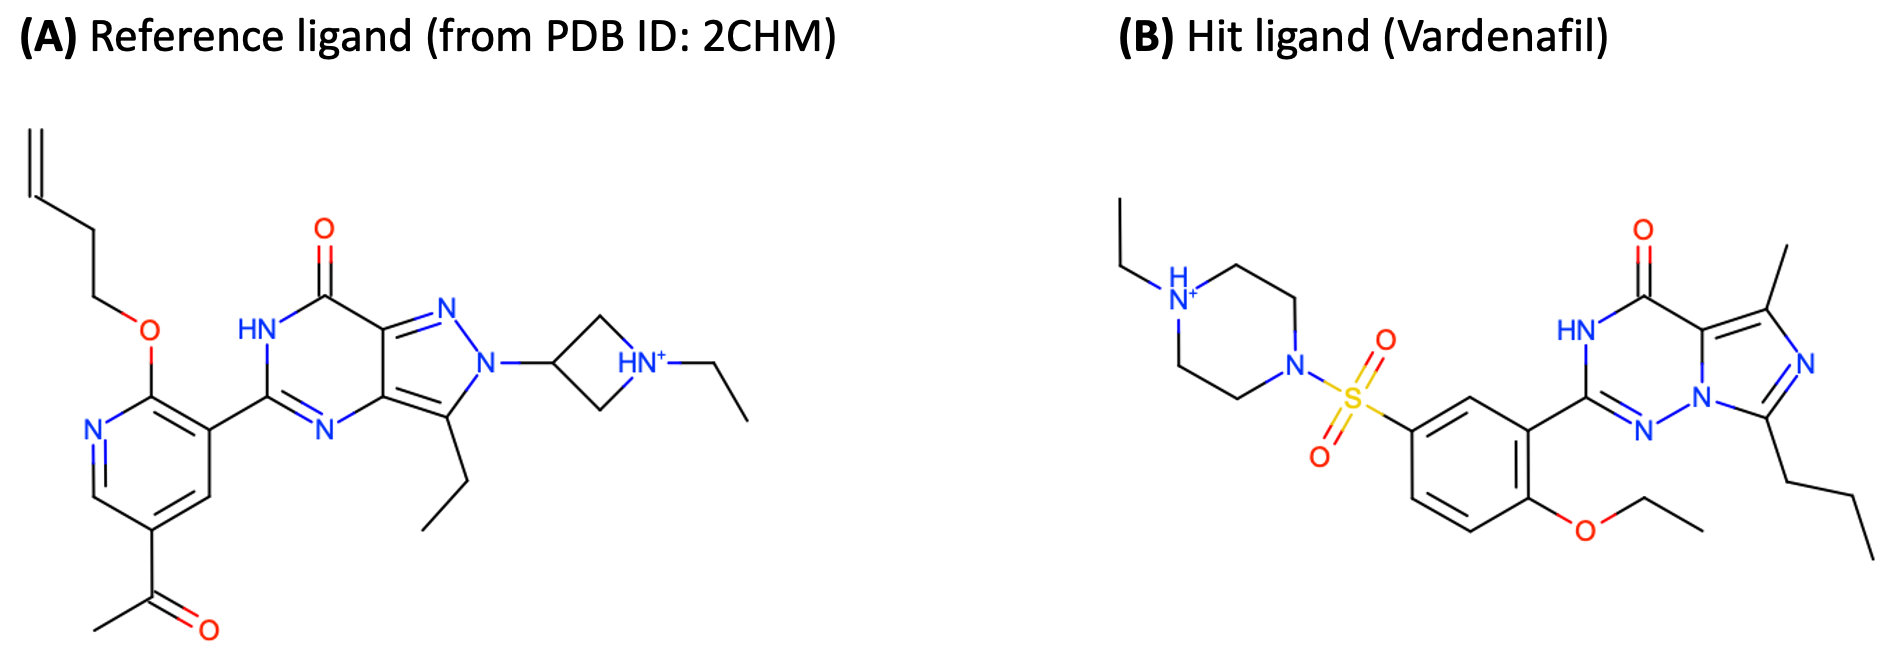
This example utilizes PDE5. As the reference receptor, we
select PDB ID: 2CHM [8], [9], which has a bound N2 substituted pyrazolo pyrimidinone [10] (Fig. 20A).
As the hit ligand, we select the PDE inhibitor Vardenafil (Fig. 20B). For convenience, we collect
this ligand from its PDE5-bound pose in PDB ID: 1XP0 [11], [12].
Figure 20: (A) Reference ligand pyrazolo pyrimidinone and (B) hit ligand Vardenafil.
The Reference Receptor Input Dataset used in this tutorial is:
The input has been prepared by running SPRUCE - Protein Preparation Floe with the parameters:
PDB code(s) to download: 2CHM, Ligand name(s): 3P4.
(The dataset has been aligned by 1XP0, with the parameter Reference Structure Inputs/Optional PDB Code for reference DU: 1XP0.)
The Ligand Input Dataset used in this tutorial is:
The ligand input has been taken from the Spruced 1XP0 DU dataset.
After automatic conversion by Orion, both datasets should already have only one record.
Caution
Proper protomer and tautomer states of the hit must be provided.
The SMILES of the hit ligand, Vardenafil, as provided by the RCSB Protein Data Bank is
CCCc1nc(c2n1NC(=NC2=O)c3cc(ccc3OCC)S(=O)(=O)N4CCN(CC4)CC)C [13].
The protomer and tautomer state of the hit ligand was taken account during Spruce preparation of
PDB ID:1XP0, and the SMILES of the prepared hit ligand for this tutorial is CCCc1nc(c2n1nc([nH]c2=O)c3cc(ccc3OCC)S(=O)(=O)N4CC[NH+](CC4)CC)C (Fig. 20B).
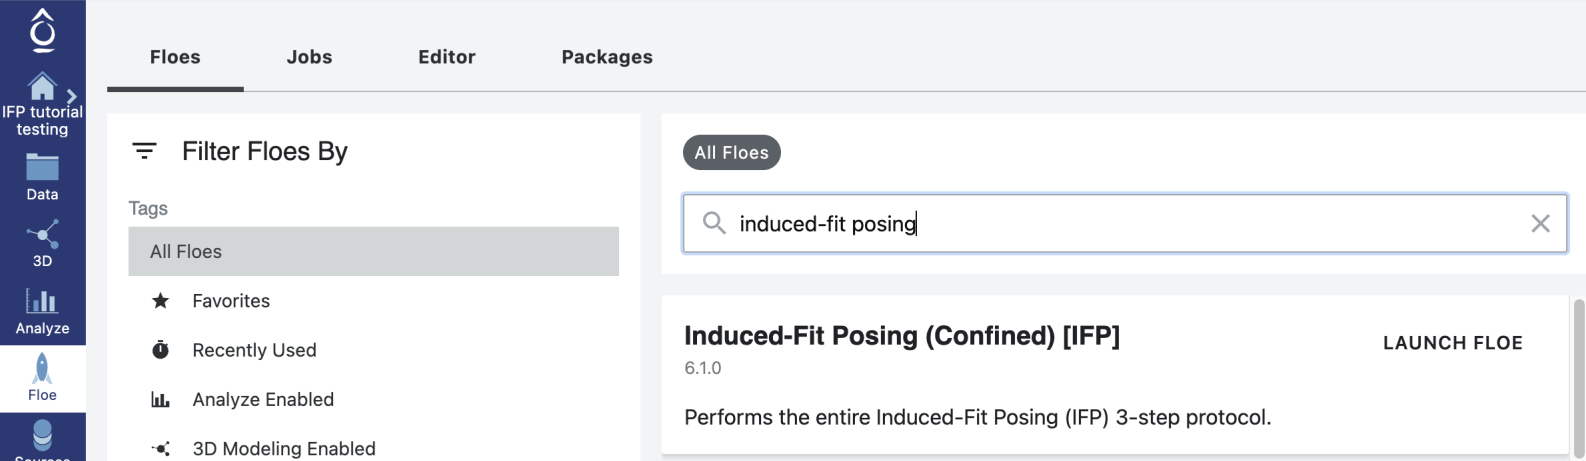
Find and launch the Induced-Fit Posing (Confined)
Floe in the Orion UI (Fig. 5). After selecting “launch Floe”, you will be presented with a job form on which inputs,
outputs, and parameters may be defined (Fig. 6). As before, we will use the datasets that
Orion automatically generated upon uploading the .oedu and .oeb files in Step 1. Although many
options can be specified or varied, only two are required:
When you are satisfied with the IFP Floe setup, press the green ‘Start Job’ button at the
lower right.
Step 3: Verify that the IFP Floe completed successfully
If the Floe was configured to do so, you will receive an email when the job finishes. This
email will indicate the status of the job. If the job was successful, you should receive
an email that reads: Job “Induced-Fit Posing (Confined) [IFP]”, has completed successfully.
Additional details on verifying that the IFP Floe completed successfully can be found in
Example #1 Step 3.
Note
As you submit more jobs, you may find it easier to manage these jobs if you change
the name of the Orion job via the Name field at the top of the job form depicted in Fig. 6.
Open the Floe report, either by navigating to the appropriate Data directory and
left-clicking on the light blue image of a page that sits beside the IFP Summary
collection in the data listing, or by using the appropriate link in the Job summary.
Note
The main IFP Floe report for this PDE5 IFP run can be viewed directly as an interactive HTML file
here.
As in Example #1, the per-ligand Floe reports usually linked in the lower table’s first column,
titled “Rank (Link)”, will not work in this version as those files are not provided with this tutorial.
The associated per-pose Floe report for pose rank #1 can be viewed directly as an interactive HTML file
here.
Step 5: Inspect and visually assess / re-rank the poses
To facilitate analyses, we will upload the target receptor dataset:
The dataset has been prepared by running SPRUCE - Protein Preparation Floe with the parameters:
PDB code(s) to download: 1XP0, Ligand name(s): VDN.
As before, to simplify your 3D viewing experience, you may want to hide or deselect any other active datasets via the
tool to add, hide, & view currently loaded datasets that is available at the top left of the Orion UI (Fig. 13).
Follow the instructions outlined in Example #1 Step 5 to use the Orion 3D viewer to display the
Output for Induced-Fit Posing (Confined) [IFP] dataset (the Output Dataset of the IFP Floe), the
Reference Receptor Input Dataset you downloaded in Step 1, and the target receptor dataset that was
downloaded at the outset of this step.
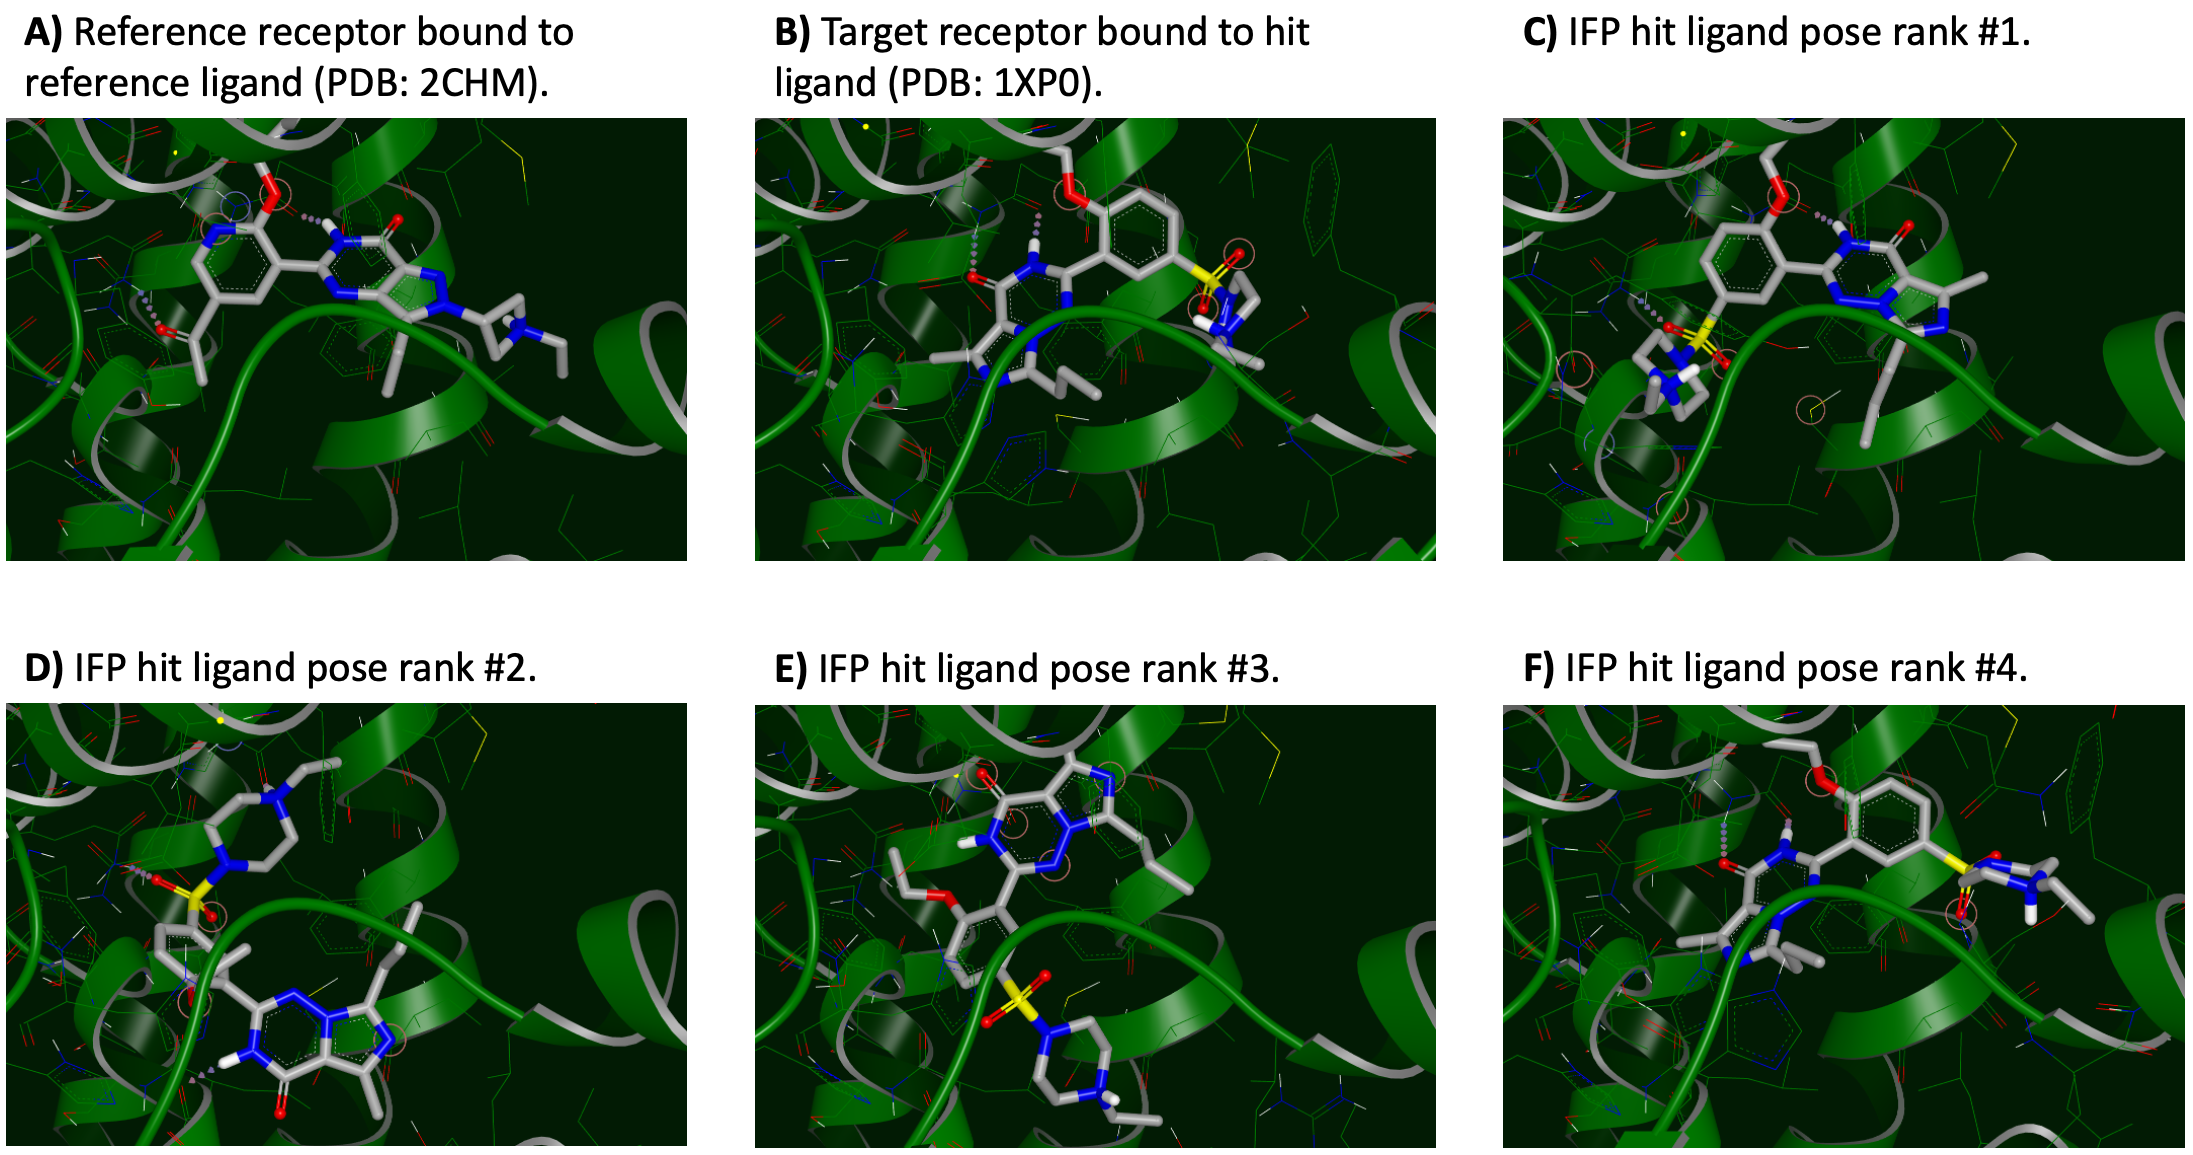
IFP predictions of Vardenafil binding to PDE5 are shown in Fig. 21. In this figure:
Part A depicts the reference receptor in the crystallographic conformation it adopts when bound to the
reference ligand.
Part B depicts the target receptor bound to the hit ligand (Vardenafil).
This represents the crystallographic pose that we take as the correct answer for Vardenafil binding to PDE5.
Parts C-F depict IFP output poses ranked #1-#4, respectively. Note the dissimilarity among these 4 top-ranked poses.
Figure 21: 3D IFP predictions of Vardenafil binding to PDE5.
Fig. 21 parts C-F display the top 4 ranked poses from IFP. They are all dissimilar to one another and only
the pose ranked #4 is accurate. Importantly, poses ranked #1-#3 all look reasonable and have seemingly favorable
interactions with PDE5. Moreover, pose #1 (Fig. 21C) has a common substructure that is remarkably similar to
the pose of the reference ligand (Fig. 21A). It is currently unclear how likely it would be for an expert to
select pose #4 instead of a top-3 pose.
Note
The flipped binding mode of the reference ligand compared to other similar ligands, and the effect of this
alternative binding mode on the sidechain conformation of a proximal leucine (residue 804), is discussed by
Allerton et al. (2006). Moreover, ligand binding mode flipping for Vardenafil and its analog Sildenafil
among PDE isoforms 5A and 4B is discussed in Card et al. (2004). These features may be relevant to the aforementioned
differences in the binding modes of the common substructure that can be observed when comparing Fig. 21A to
Figs. 21B and 21F.
Step 6: Quantitative comparison to the known binding pose (when available)
As in the first example, we will now regenerate the Floe report while
augmenting it with quantitative comparisons to a known correct answer via the
Compare IFP Results to Target Receptor Floe.
Find and launch the Compare IFP Results to Target Receptor Floe in the Orion UI (Fig. 16).
After selecting “launch Floe”, you will be presented with a job form on which inputs,
outputs, and parameters may be defined (Fig. 17). Although many options can be specified
or varied, only two are required:
The IFP Output Dataset, which is the output of the Induced-Fit Posing (Confined) Floe we just ran.
The default output dataset name is Output for Induced-Fit Posing (Confined) [IFP]
The Target Receptor Input Dataset for comparison. For this example, we will use
the spruce_dataset_1xp0_ref_1xp0 dataset, which you uploaded in a previous step.
When you are satisfied with the Compare IFP Results to Target Receptor Floe setup,
press the green ‘Start Job’ button at the lower right.
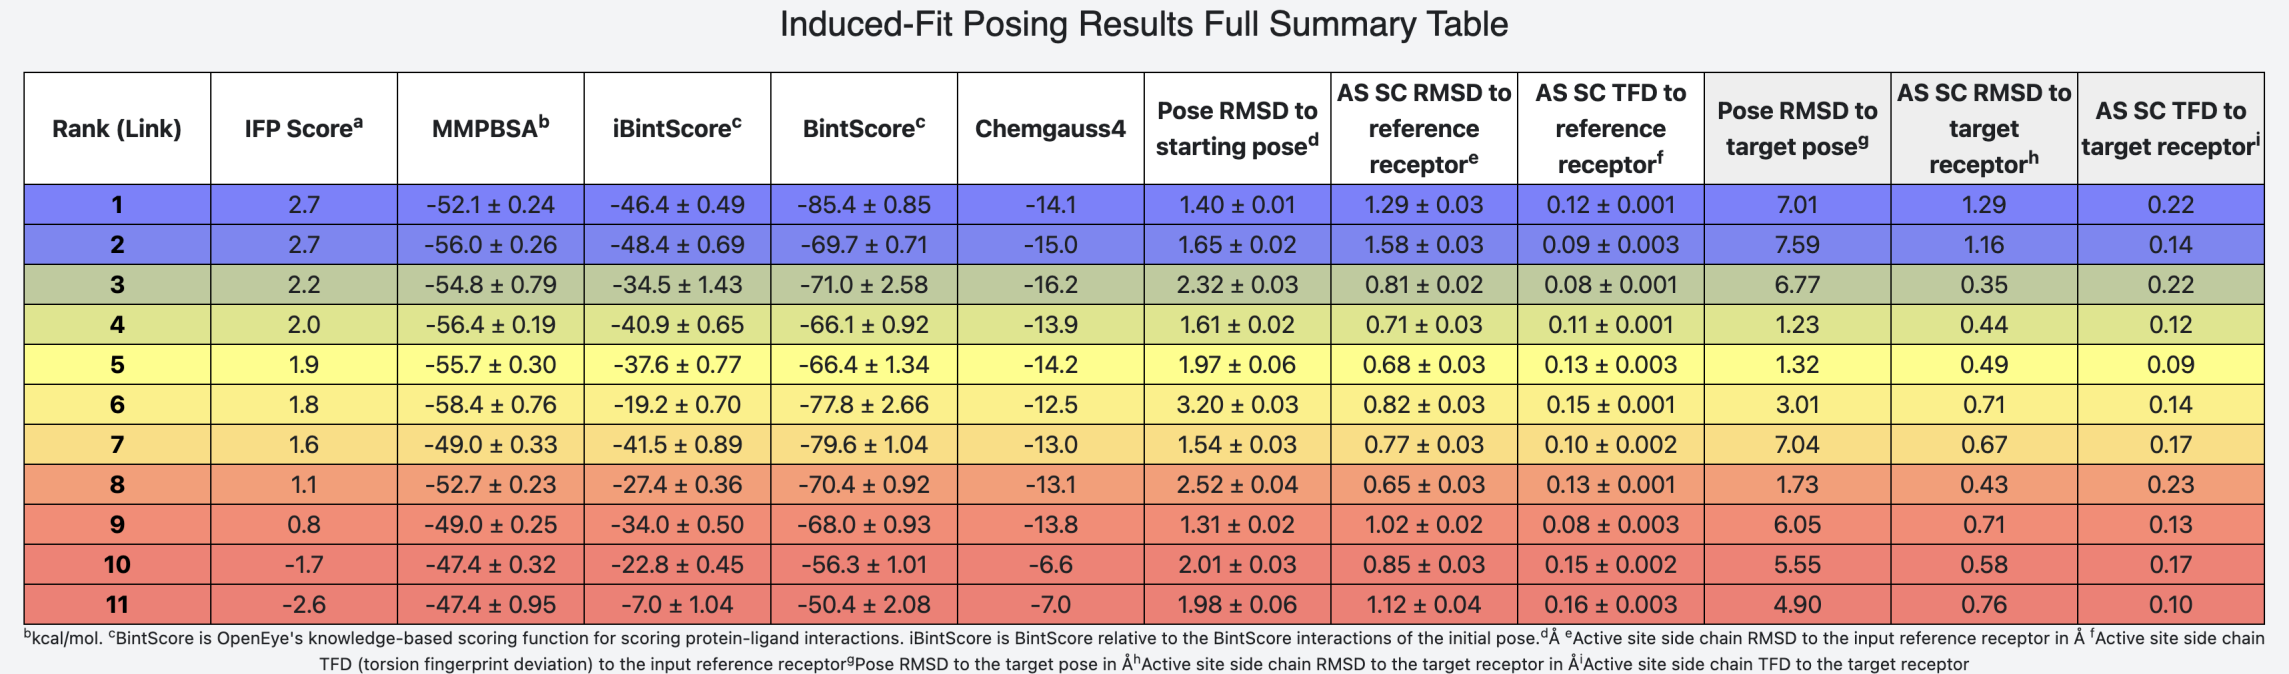
The table at the bottom of the main Floe report for this comparison is shown below in Fig. 22.
Figure 22: Bottom portion of the IFP Floe report for this PDE5 example; generated after running the
Compare IFP Results to Target Receptor Floe.
The third-last column in Fig. 22 (‘Pose RMSD to target pose’) reveals
that poses ranked #1, #2, and #3 are inconsistent with the crystallographic pose of this ligand bound to PDE5. However,
poses ranked #4, #5, and #8 are consistent with this ‘correct answer’, having RMSD’s < 2 Å. This type of
outcome is not uncommon for this implementation of IFP. Accurate poses are frequently included in the top-ranked 12
poses (frequently even in the top-ranked 5 poses), but these accurate poses are not always assigned the highest
IFP scores.
Note
An exercise left to the reader is to assess the poses more deeply via Orion’s 3D viewer and estimate whether
you would be capable in this case of discriminating the accurate poses from the decoy poses (using Fig. 22
for reference).
Step 7: Check that your Floe inputs meet these important requirements