Main Floes in the CSP Protocol
The first half of this tutorial uses the following Floes from the OpenEye Crystal Math Floes package:
Polymorph Search with IEFF Crystal Force Field (Part II of CSP Protocol: Generation and Filtering)
Loose Quantum Optimization of Crystal Structures (Part IIIA of CSP Protocol)
Quantum Optimization of Crystal Structures (Part IIIB of CSP Protocol)
Psi4 QM Conformer Ensemble (Part I of CSP Protocol)
Part I of the CSP protocol is the Psi4 QM Conformer Ensemble (Part I of CSP Protocol) Floe. Creating a conformer ensemble for benzoic acid will cost around $0.50. Alternatively, skip to the Analyze CSP Part I Results section below to analyze the provided output.
Run CSP Part I Floe
To run this Floe, search for “Psi4 QM Conformer Ensemble (Part I of CSP Protocol)” in the Product-based / Crystal Structure Prediction category path.
Note
All molecules used as input for this Floe will be included in the same energy landscape. Therefore, the input dataset should either have a single record or related molecules (i.e. tautomers or stereoisomers) that should be considered in the same crystal structure predictions.
This Floe takes any Orion dataset as input. The Floe pictured below shows it has two input fields: Input molecule and Input reference conformers. Input reference conformers parameter is optional, if provided the generated conformers are only saved if they are within the “Subsampling RMSD Threshold” of any references. This allows for multi-stage sampling which is not addressed directly in this tutorial.
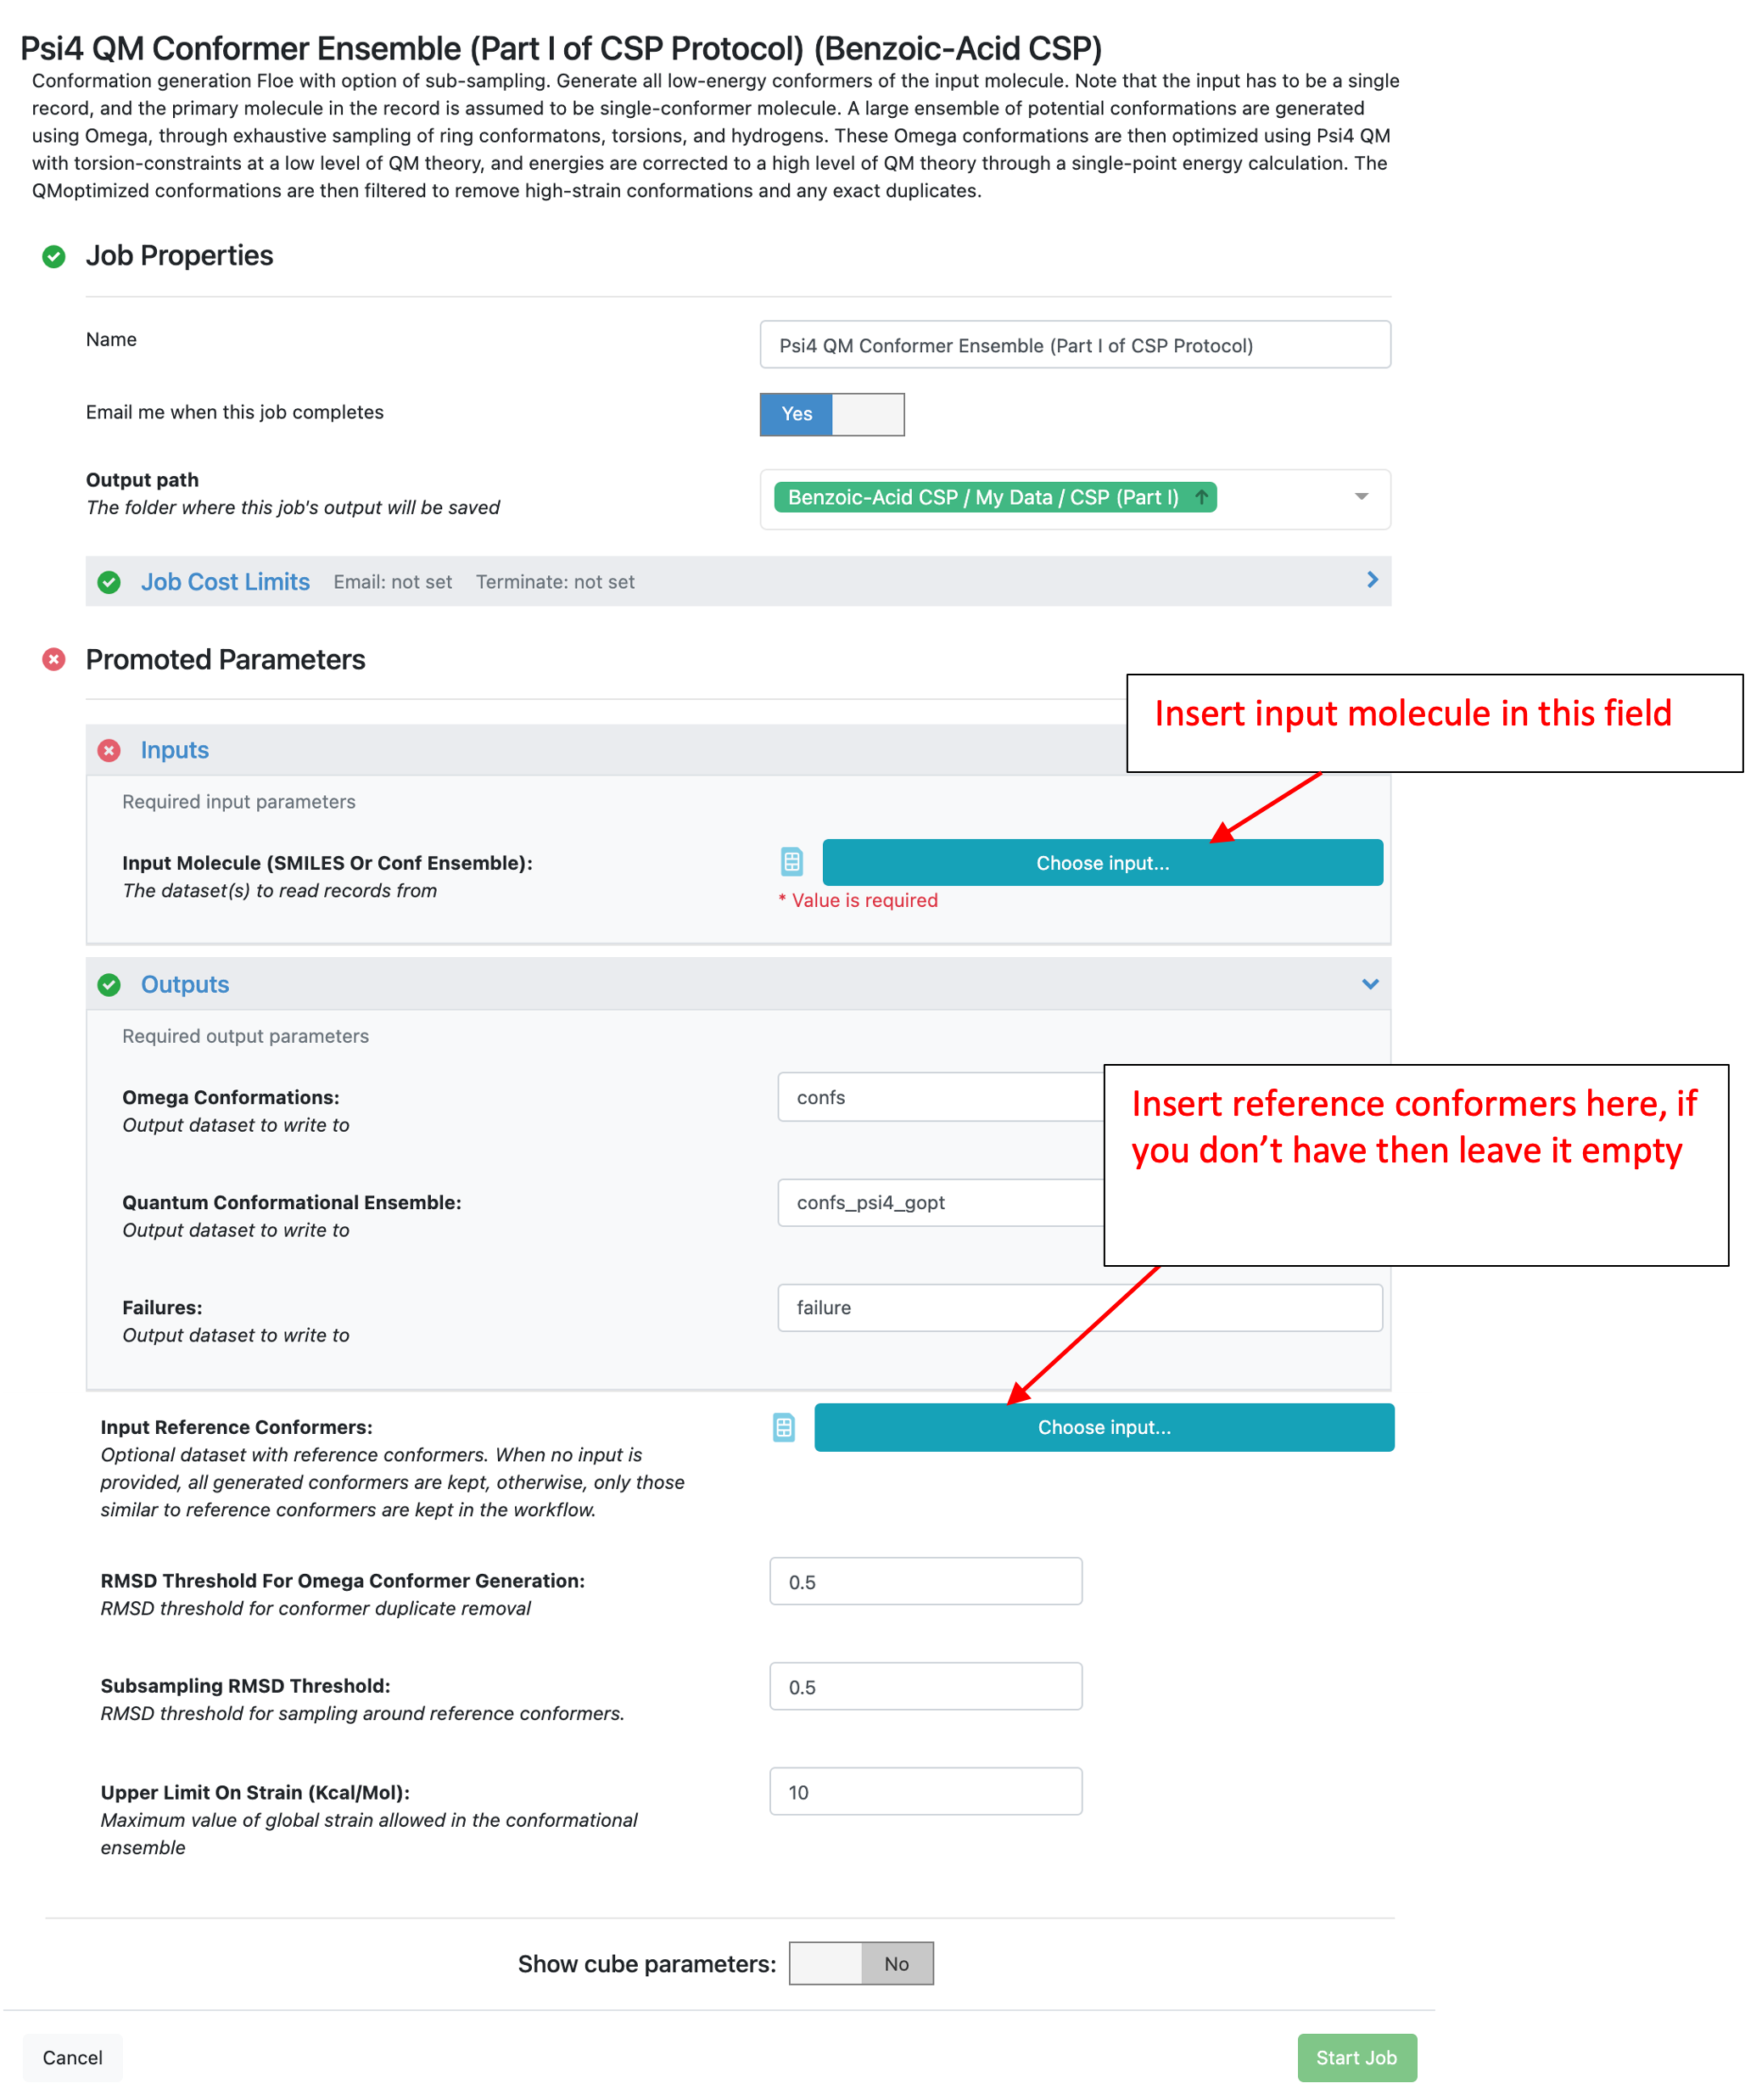
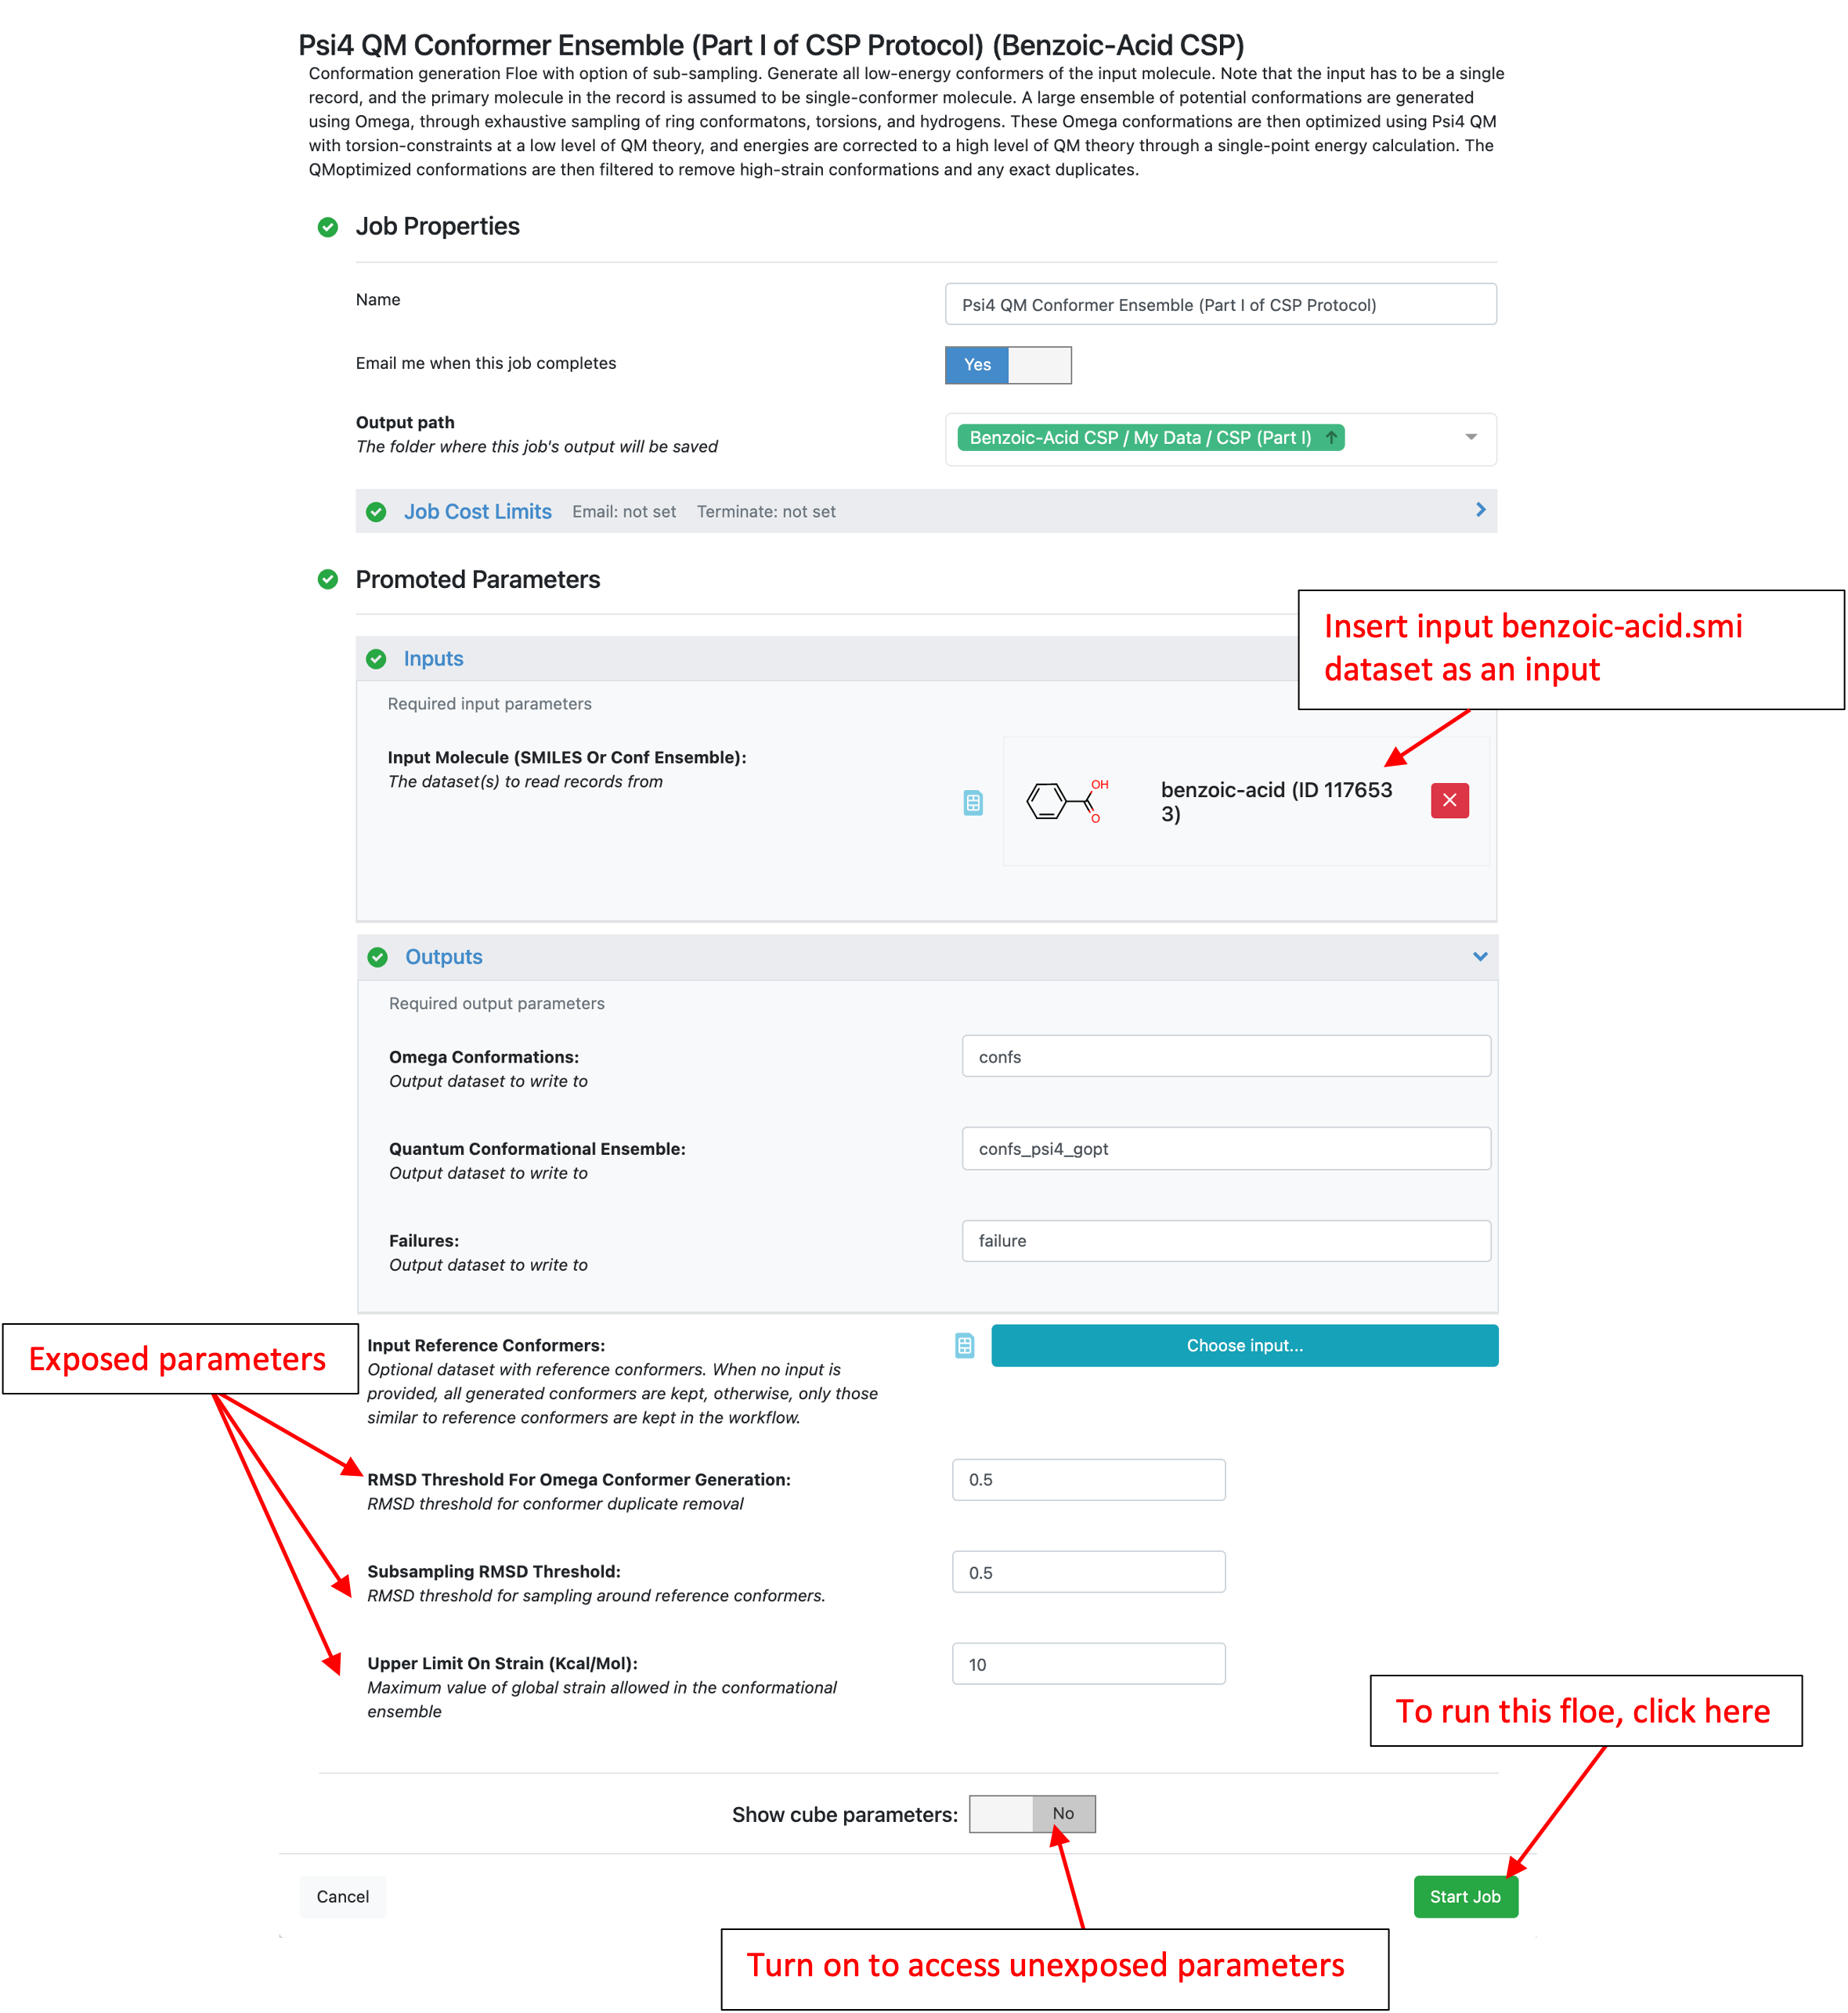
In this tutorial, the “benzoic-acid” dataset is used for the “Input Molecule (SMILES Or Conf Ensemble)” and the optional “Input Reference Conformers” is ignored. See Tutorial Data on Orion to access or create the benzoic-acid dataset. All other promoted (exposed) parameters will be left as the defaults. By default, this Floe uses an energy window of 10 kcal/mol and an RMSD threshold of 0.5 A for the Omega (force field) conformer generation step. A large ensemble of potential conformations is generated using the OpenEye Omega toolkit, through exhaustive sampling of ring conformations, torsions, and polar hydrogens. These conformers are then QM optimized at a low level of theory (HF-3c) with torsions around all rotatable bonds constrained. These energies are corrected to a higher level of theory (B3LYP-D3MBJ/6-31G*) through a single-point energy calculation. Finally, only conformers within the specified energy window are stored. These parameters can be changed as necessary, however be aware that changes could affect the cost of this and subsequent Floes.
Press the “Start Job” button when all parameters are set.
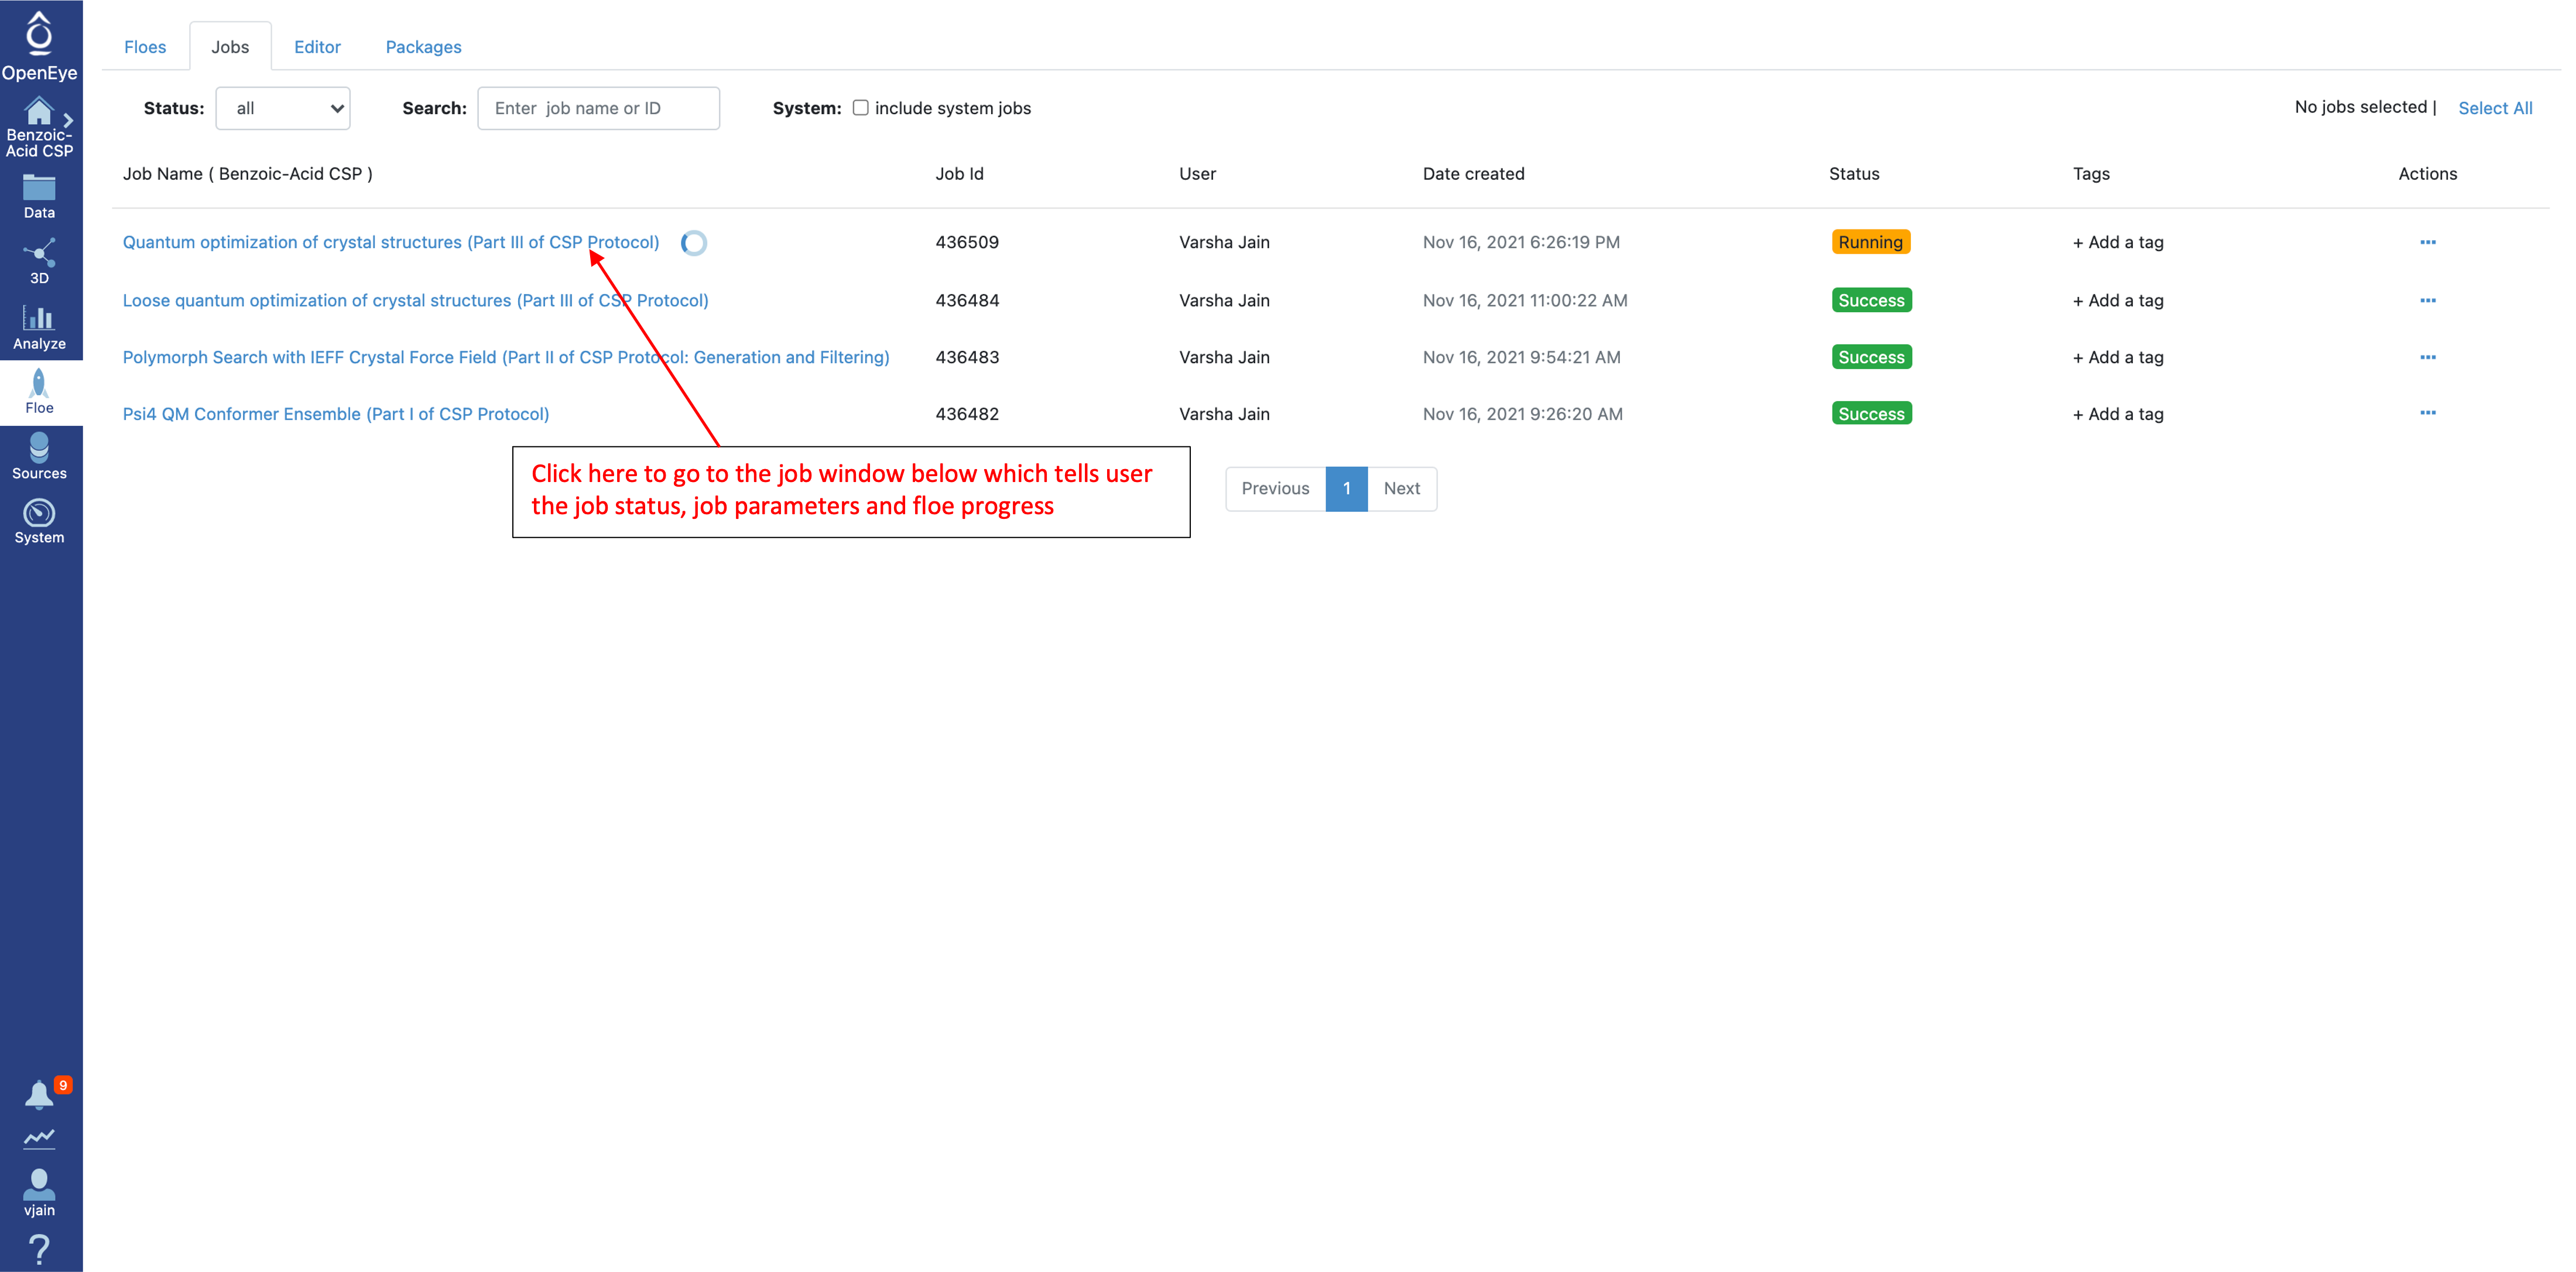
To check the status of a running job, select “Floe” from the left menu and go to the “Jobs” tab.
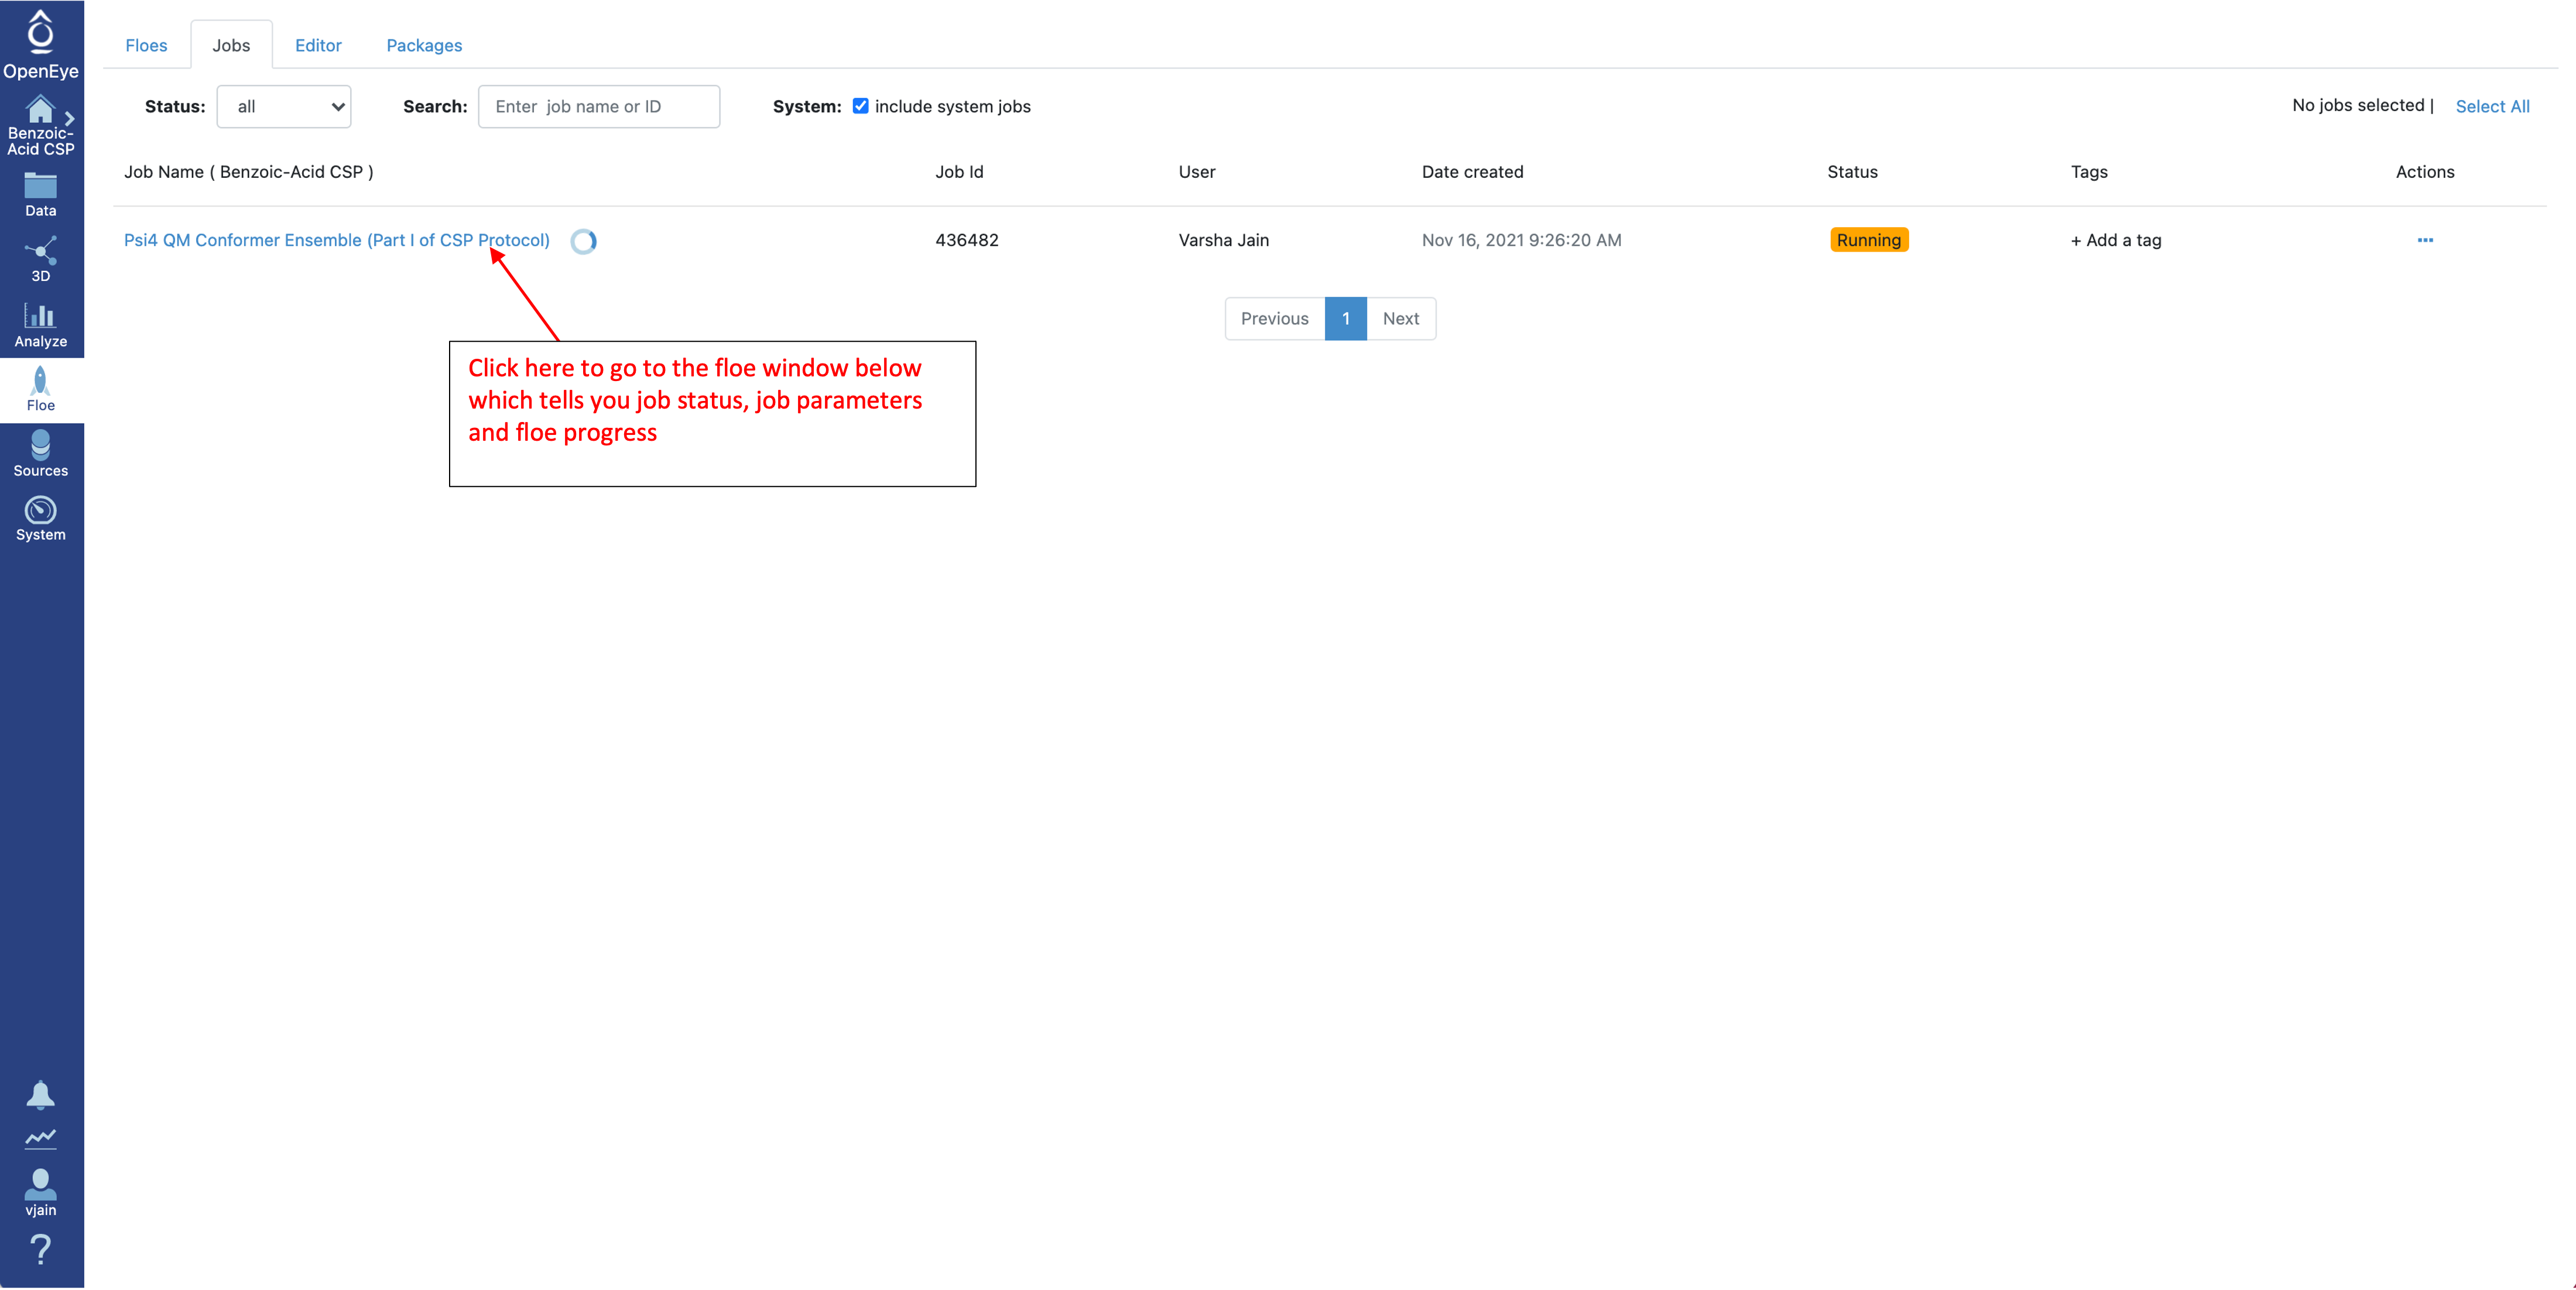
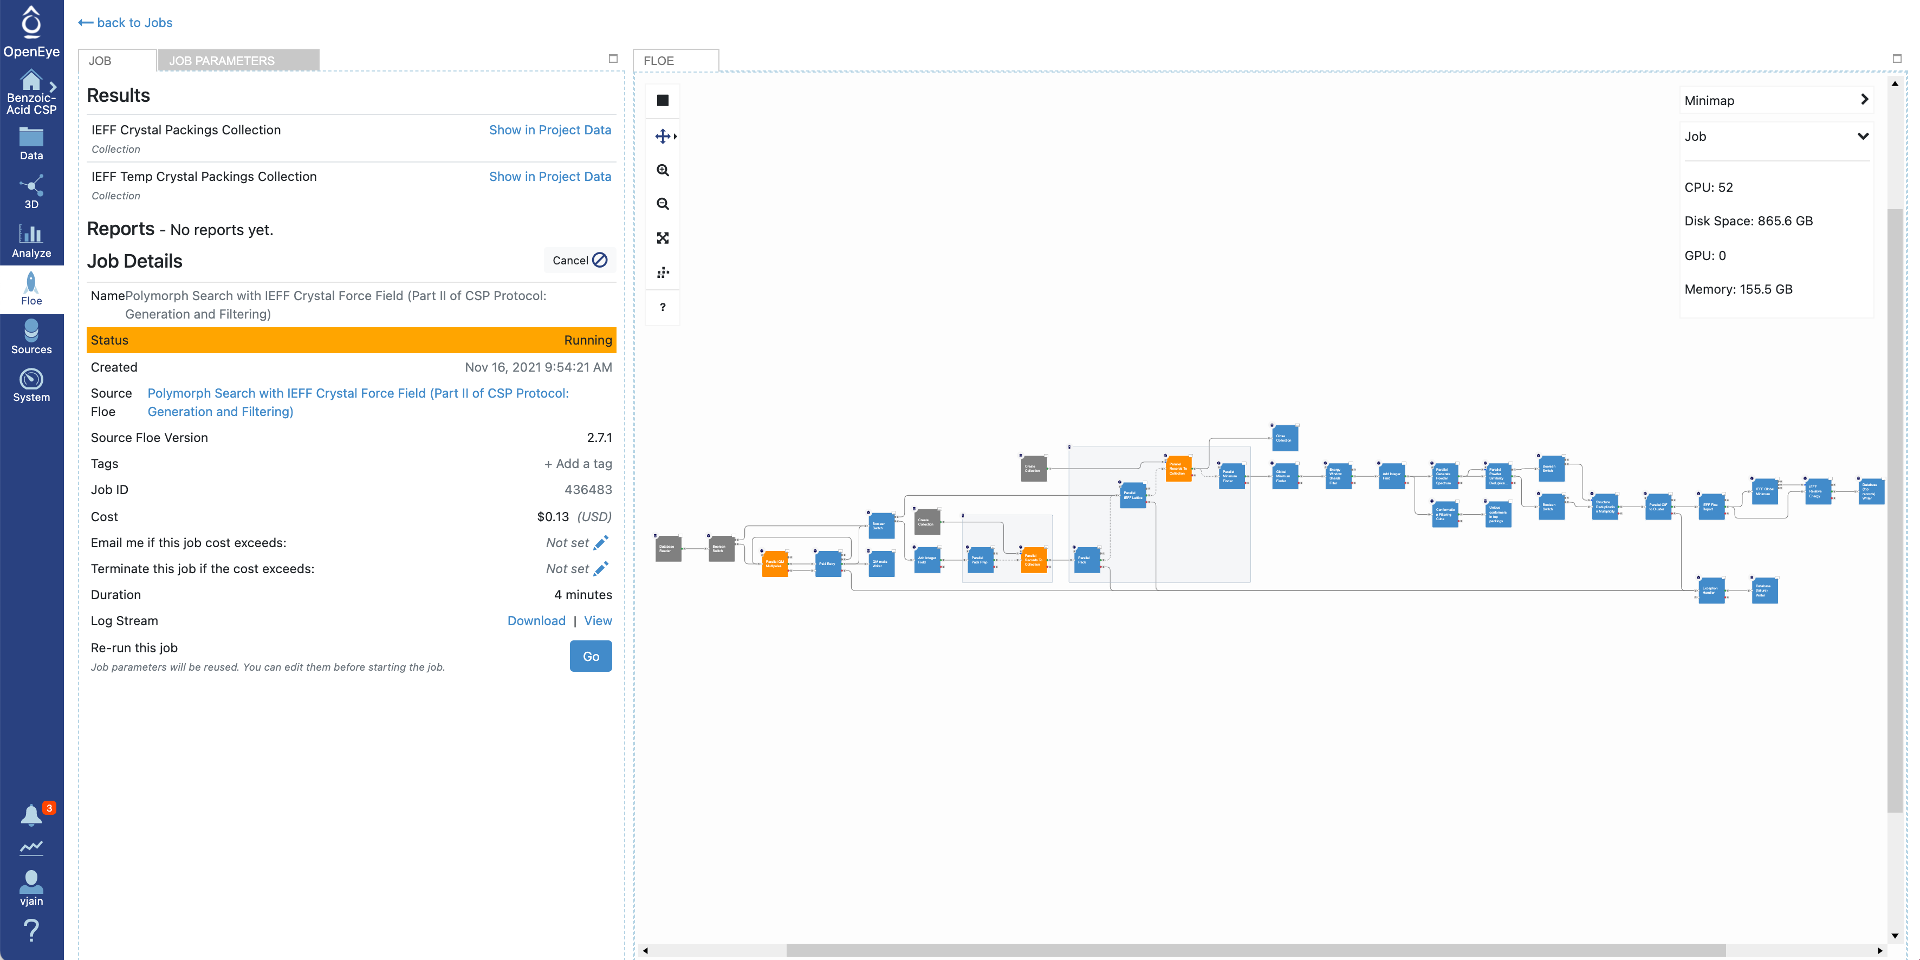
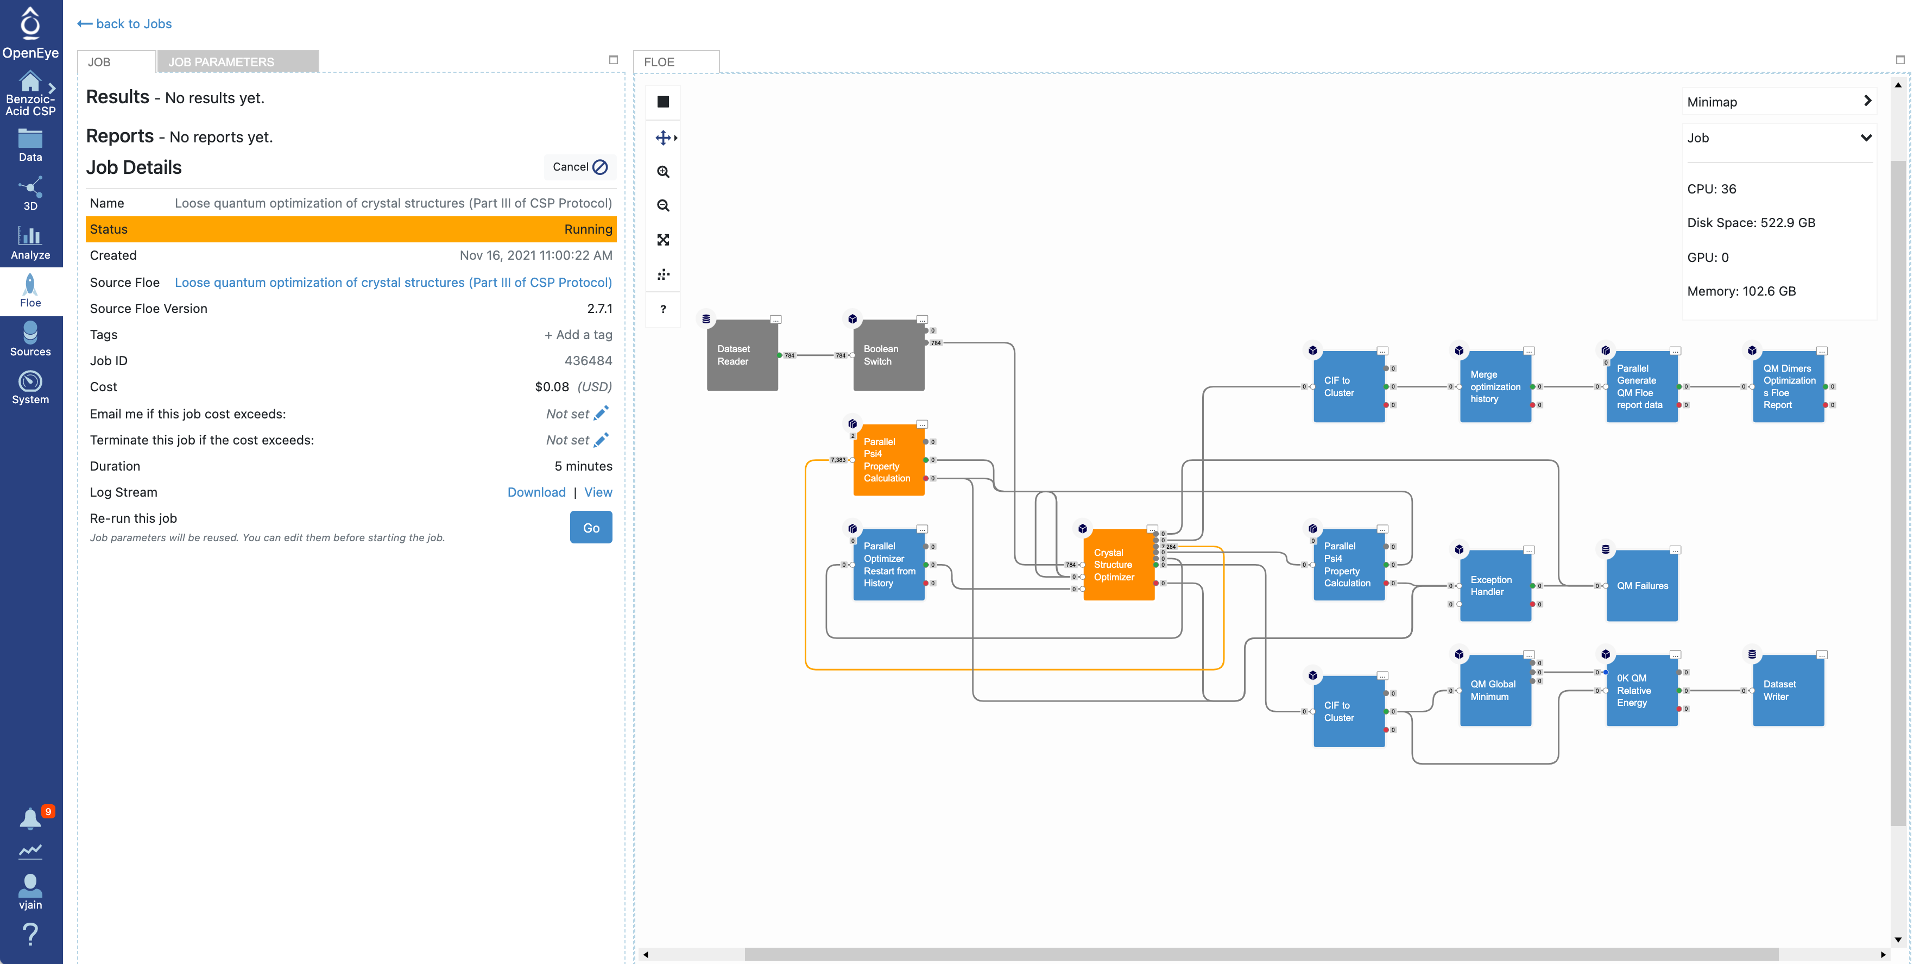
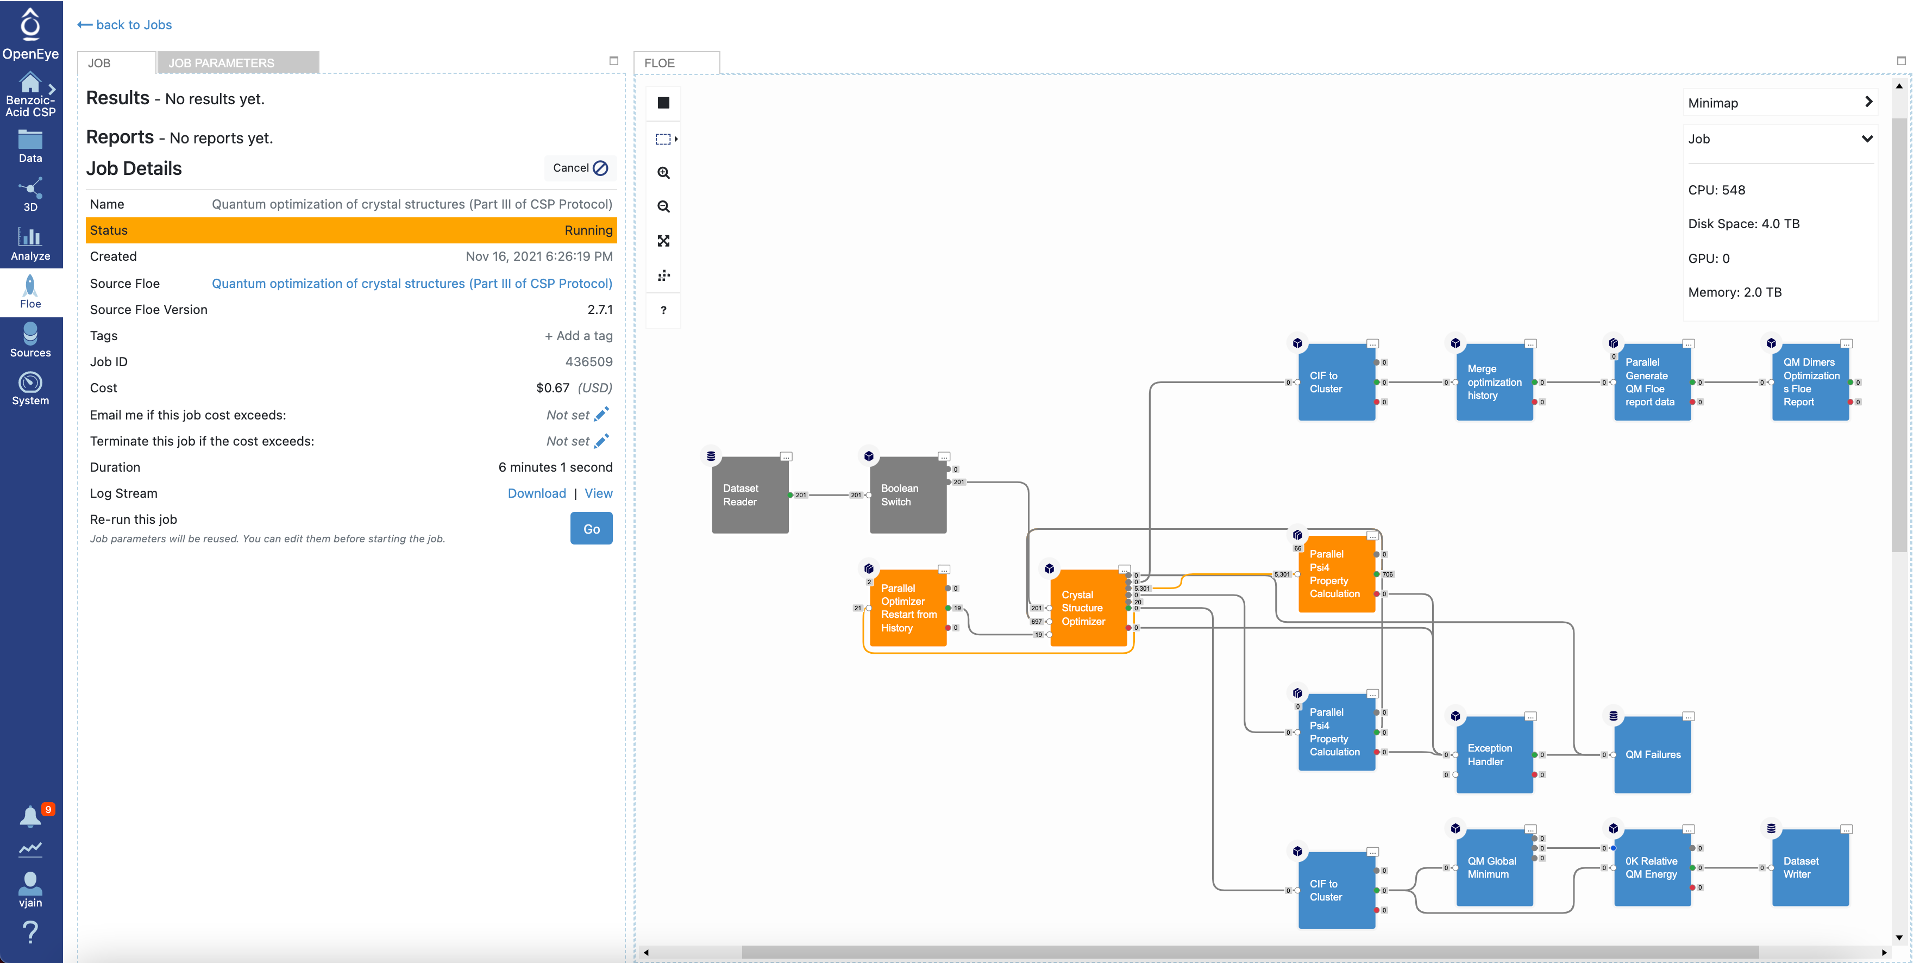
Click on that specific job to see the job details including current cost and any written datasets. Select the job parameters at the top to see changes to parameters in this job compared to Floe defaults. The diagram on the right shows progress in the Floe: grey, orange, and blue colors represent the executed, in progress and the pending Cubes, respectively.
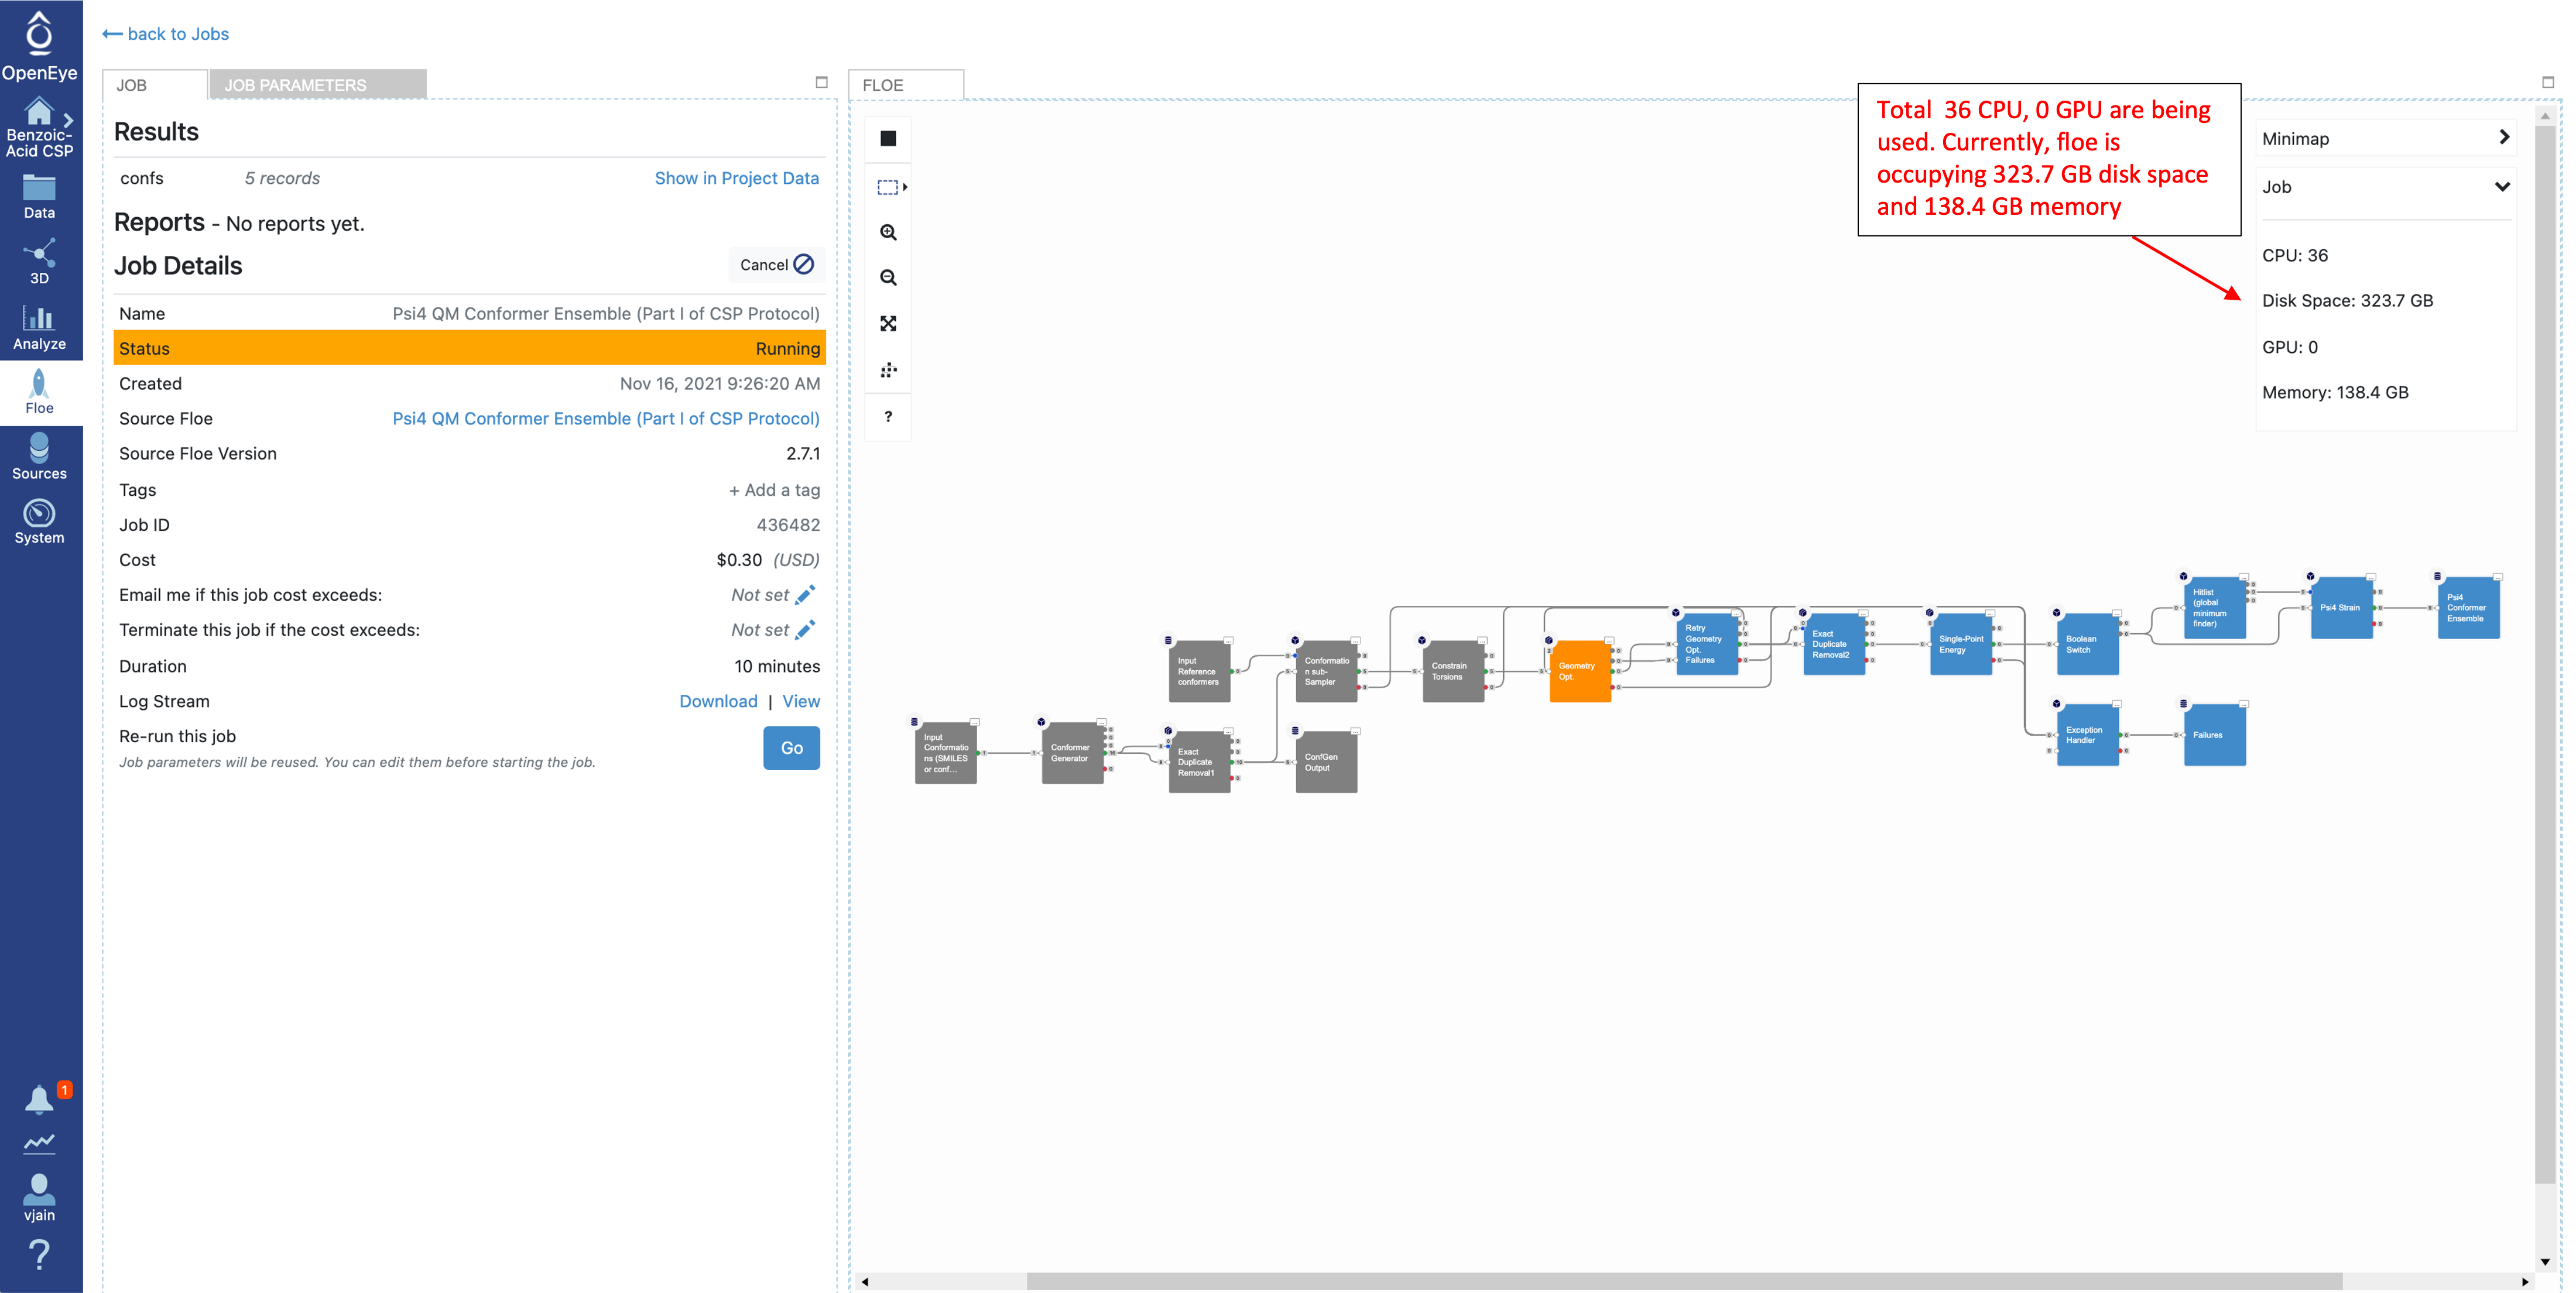
Once the job has finished, the details will show final cost and wall clock time. The results are also shown at the top. Click on the “Show in Project Data” link to be taken to the project data page.
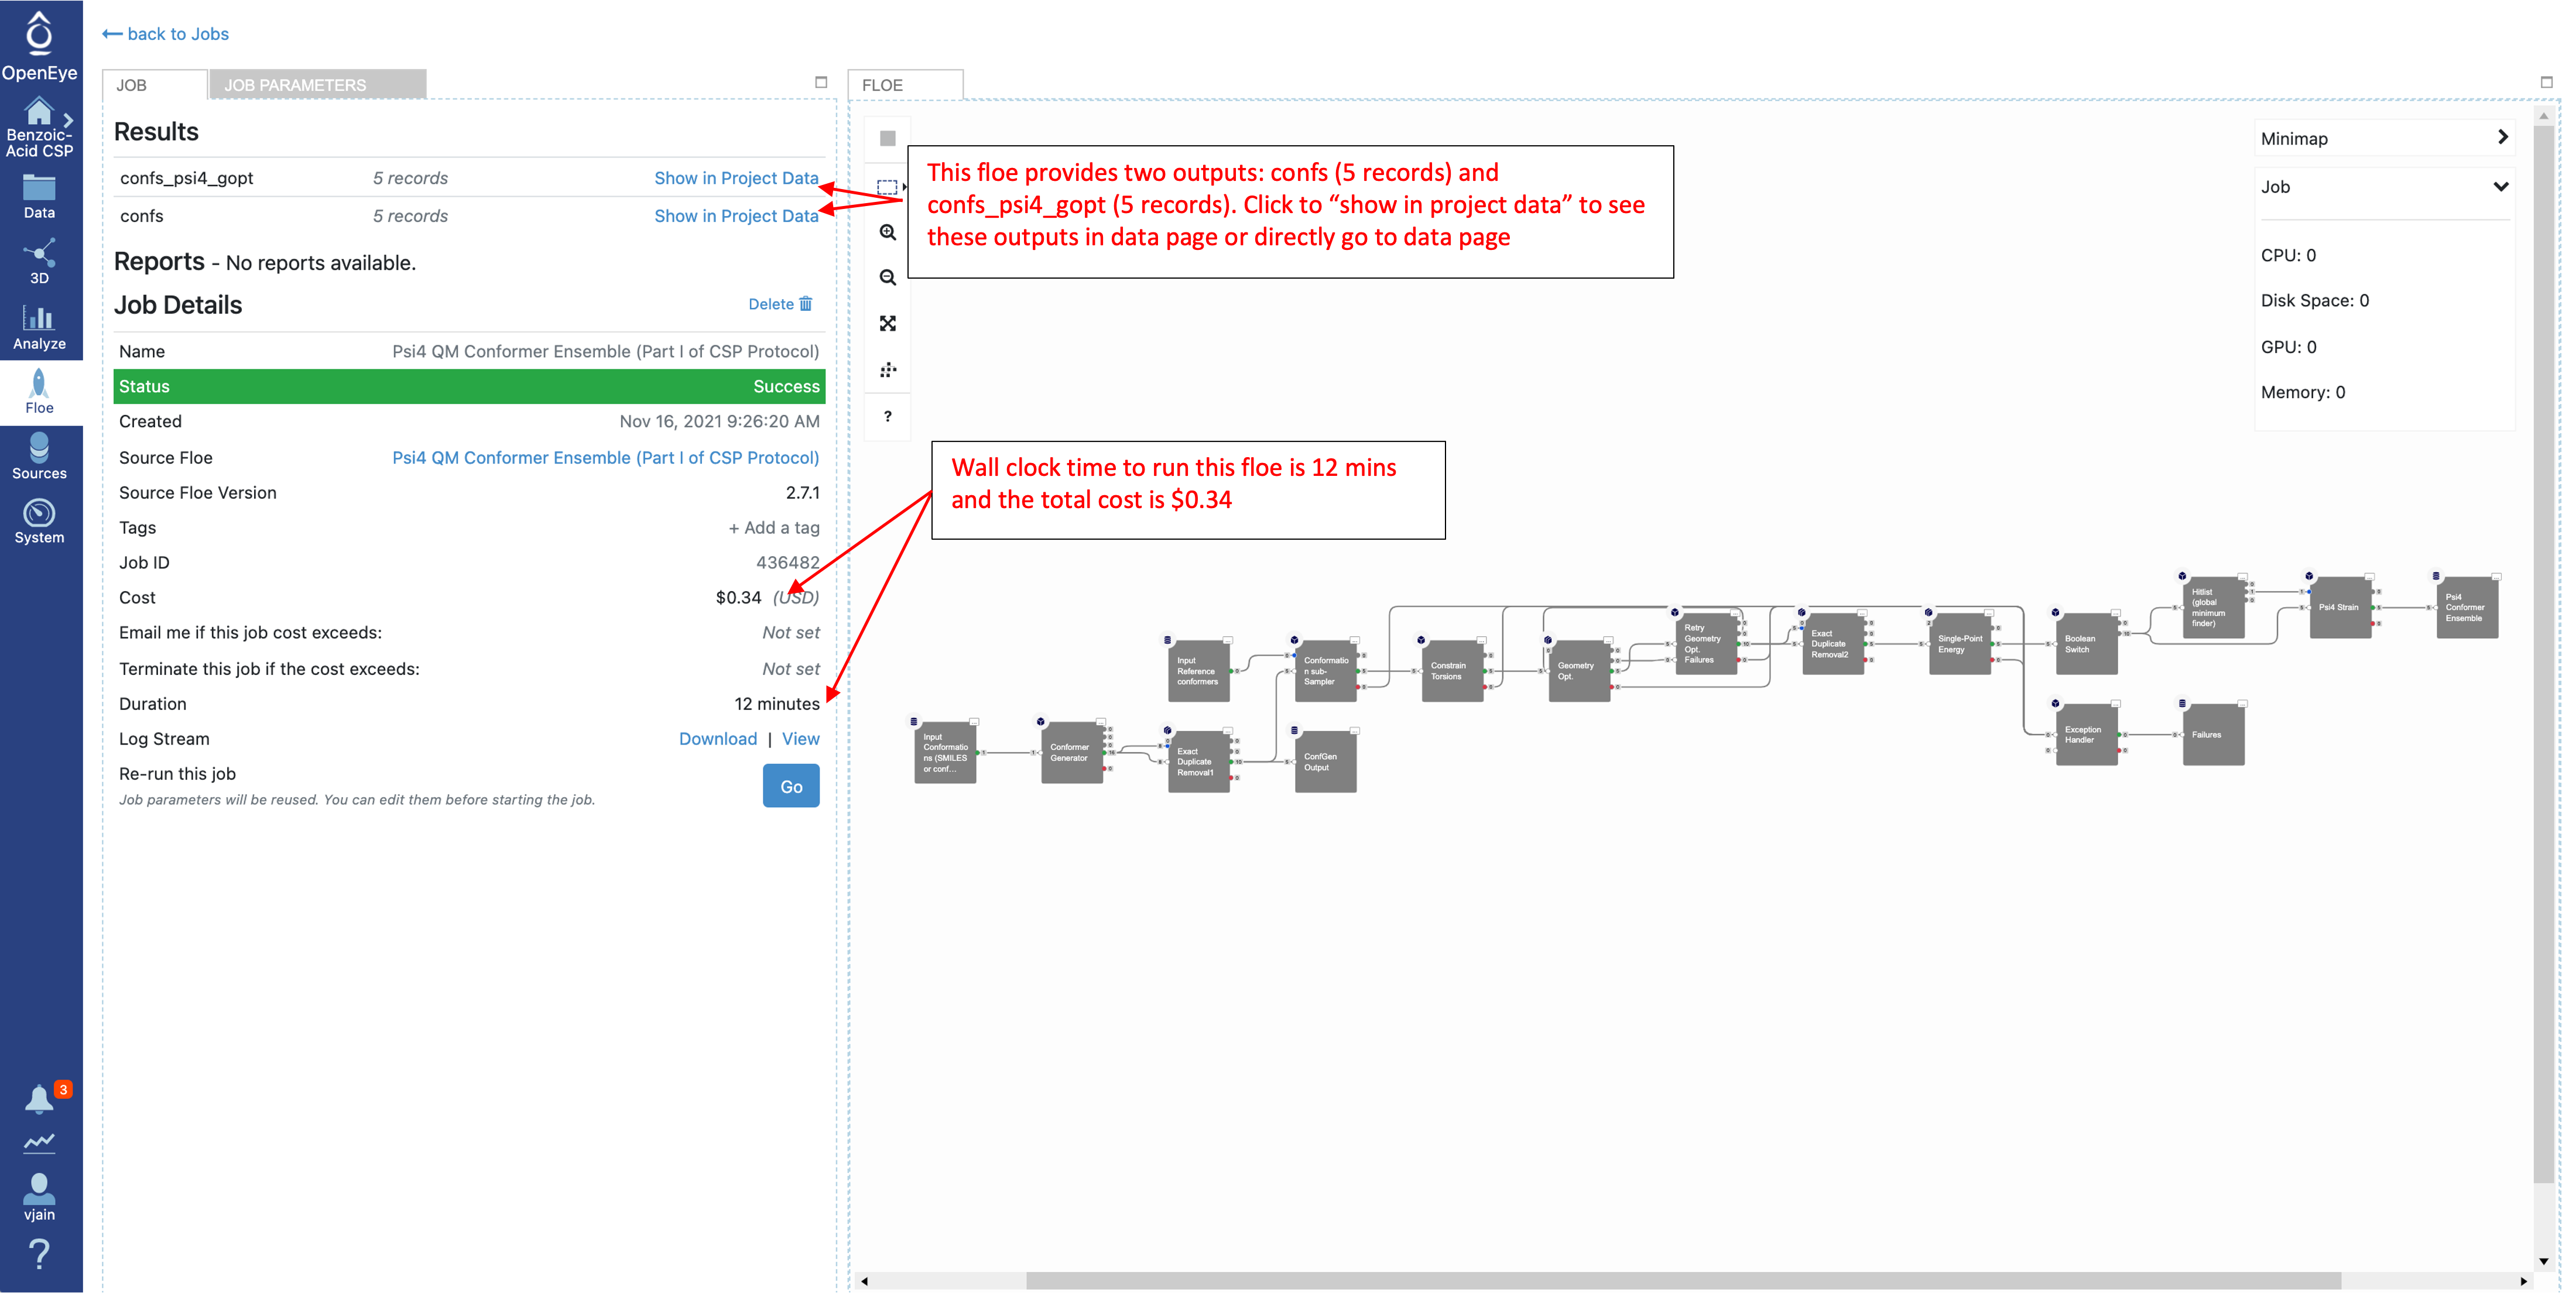
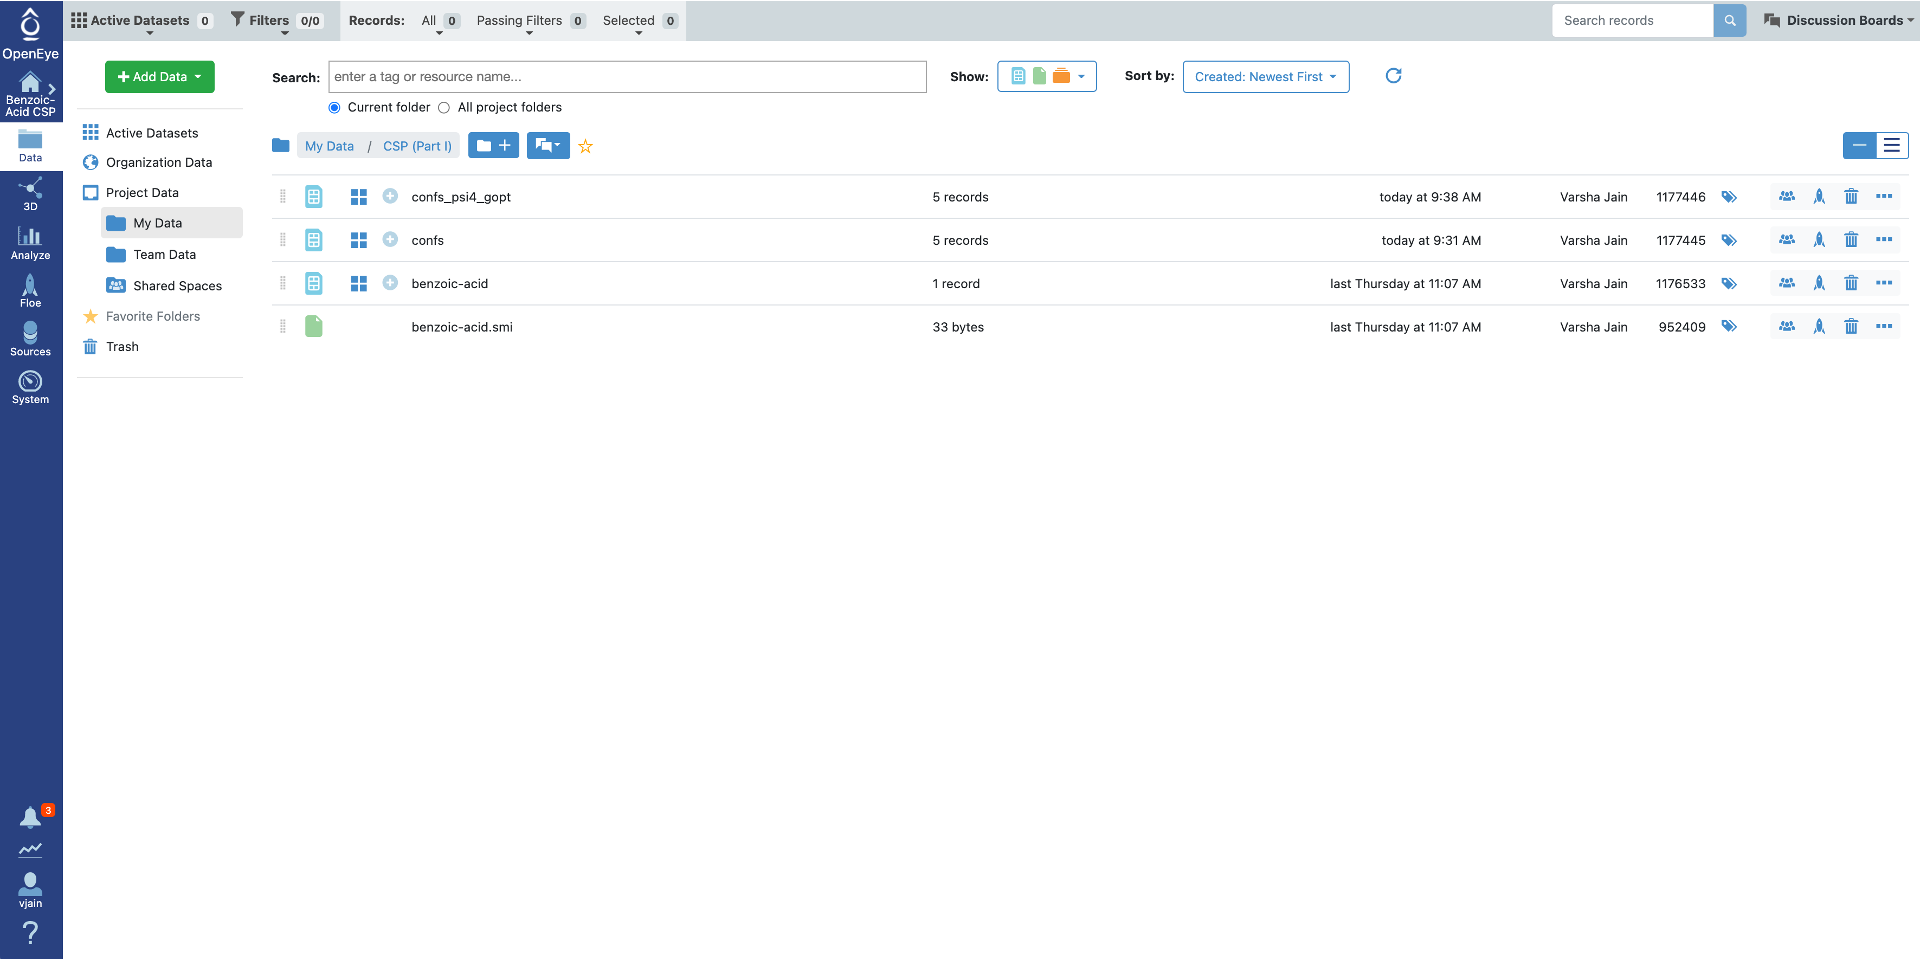
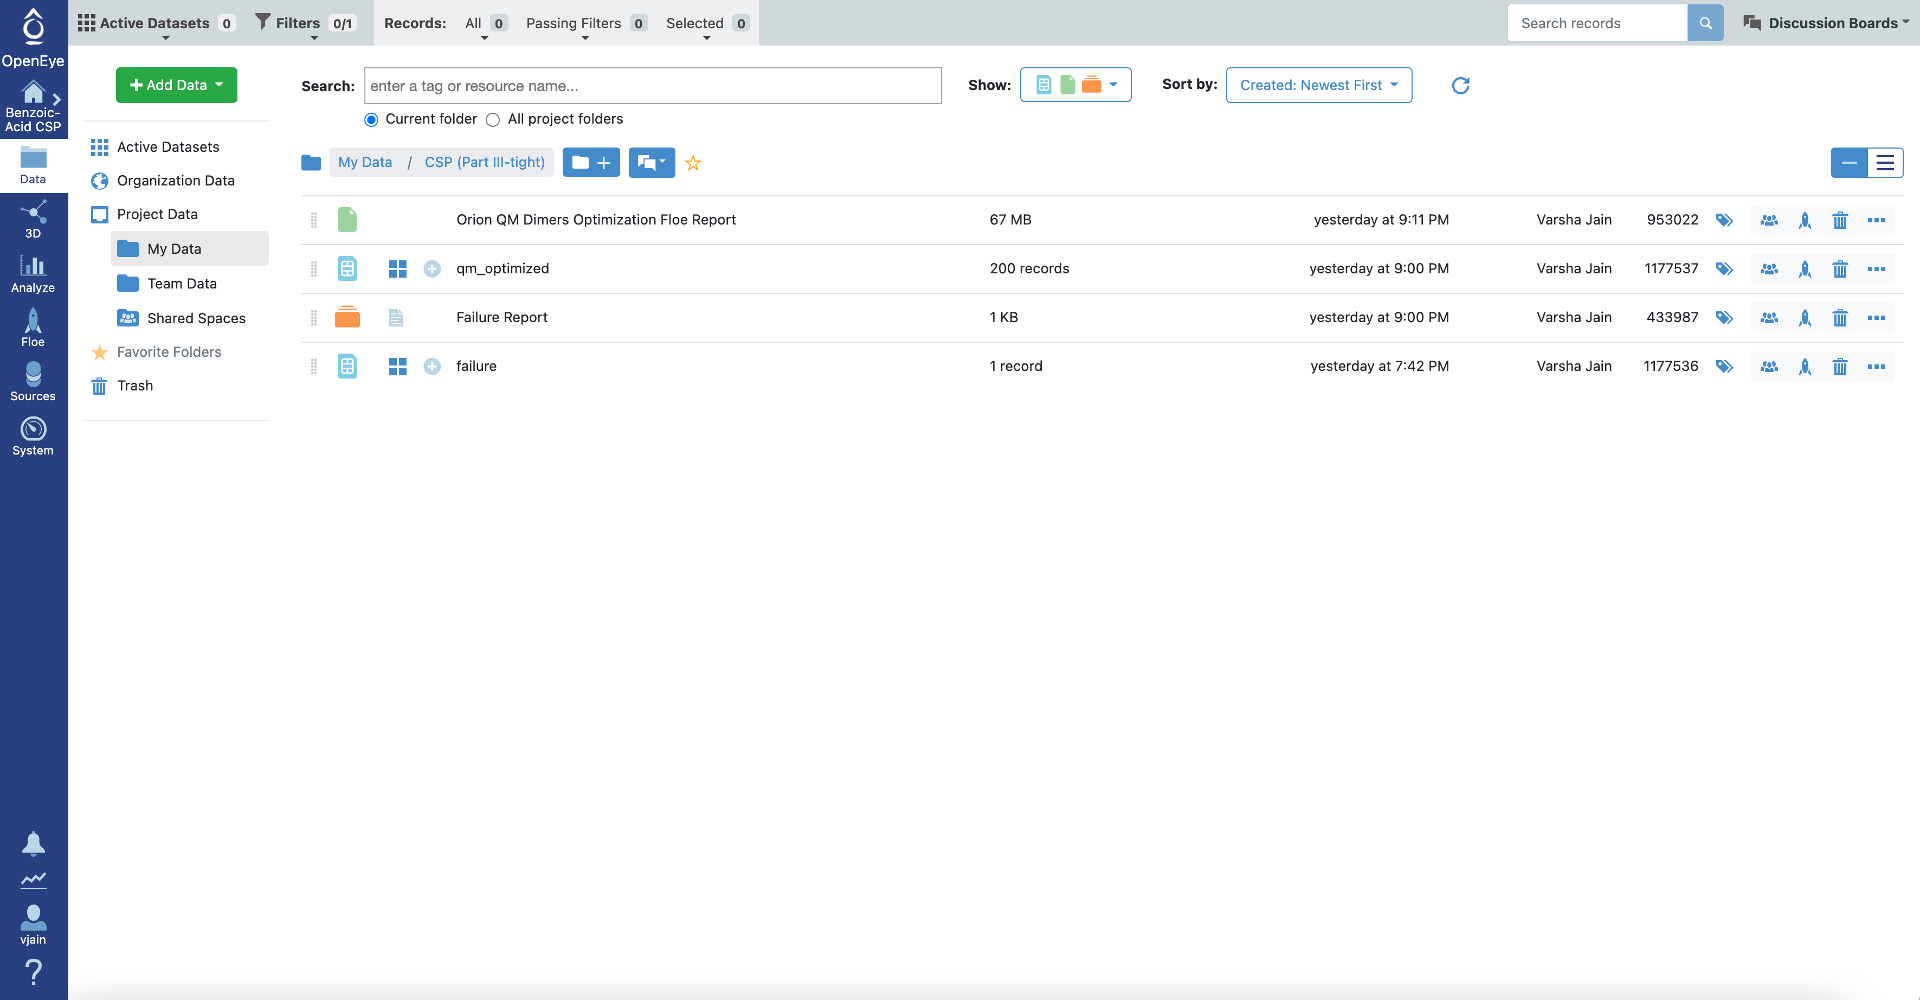
Click on “Show in Project Data” or go directly to data folder in Orion to see the output from this Floe. There will be up to four output datasets with these default names:
confs has all conformers generated with the Omega toolkit before optimization.
confs_psi4_gopt has only conformers in the specified energy window at the higher level of theory.
all_qm_geometries has all geometry optimized conformers with energies at the lower level of theory.
failure has any failures, including those conformers with energies above the specified cutoff.
Analyze CSP Part I Results
To locate example output for this Floe navigate to the “Psi4 QM Conformer Ensemble (Part I of CSP Protocol)” folder in the Crystal Math Floes tutorial data (for details about Tutorial Data on Orion).
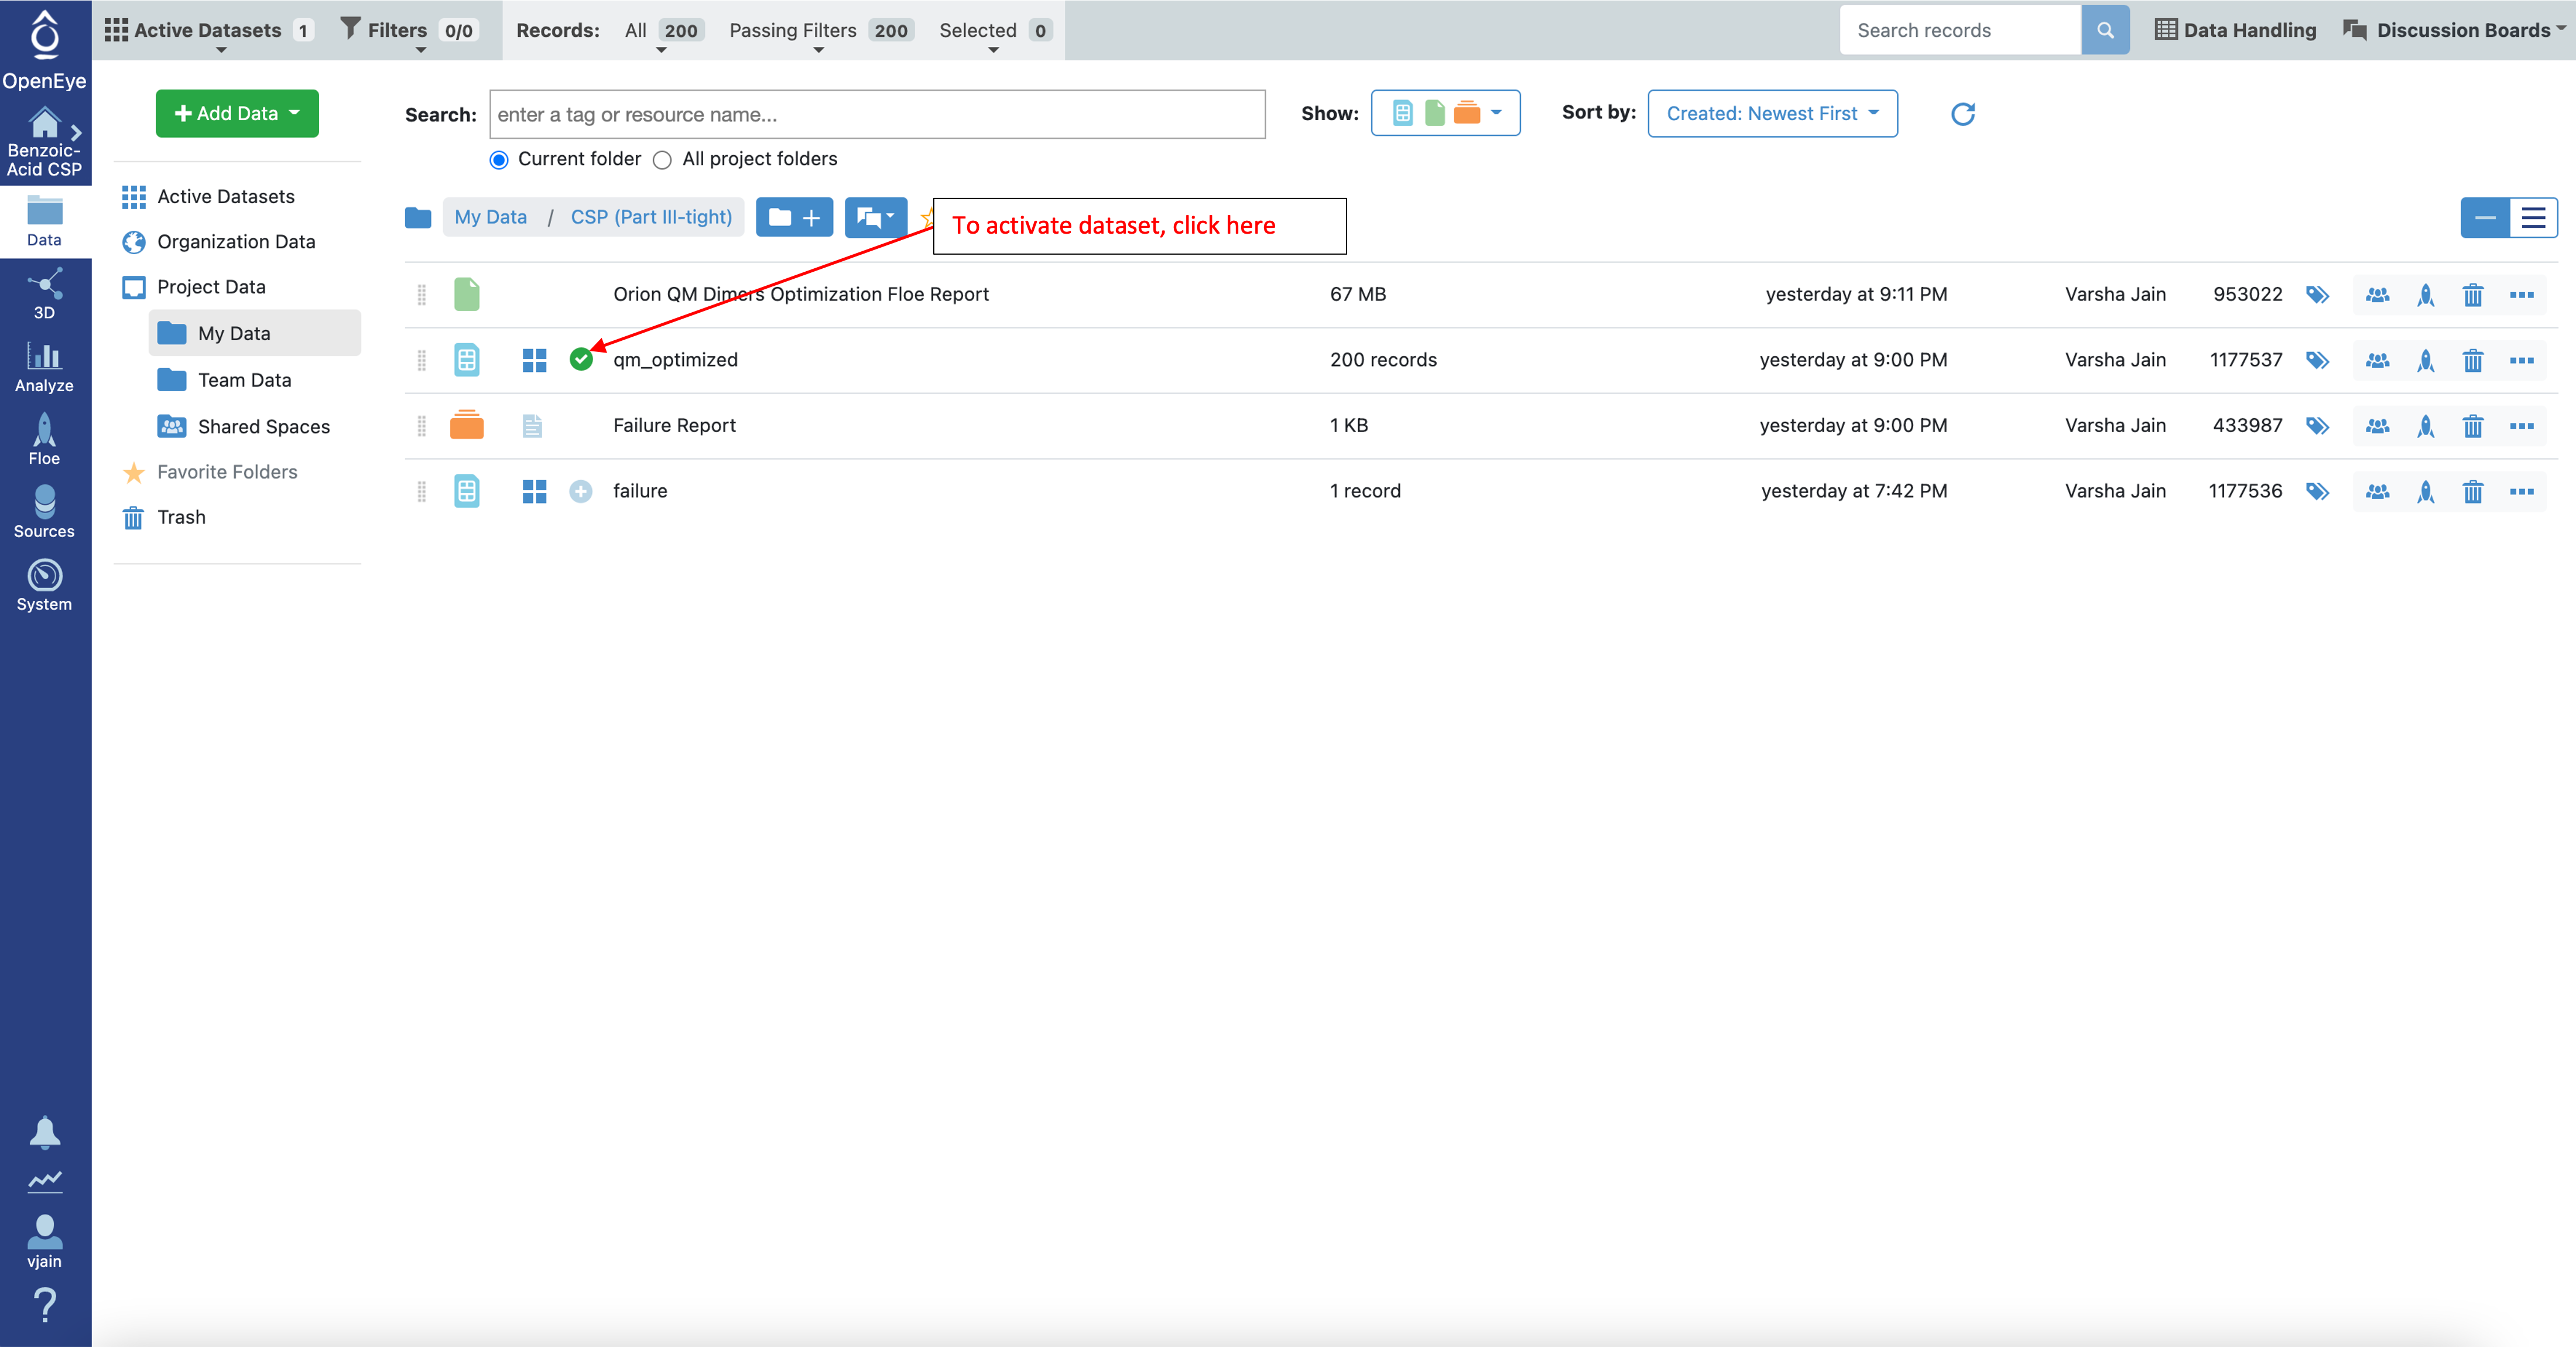
To look at these conformers in the 3D Viewer, make the conformer ensemble dataset (confs_psi4_gopt) active by clicking on the circle with the plus sign as shown below.
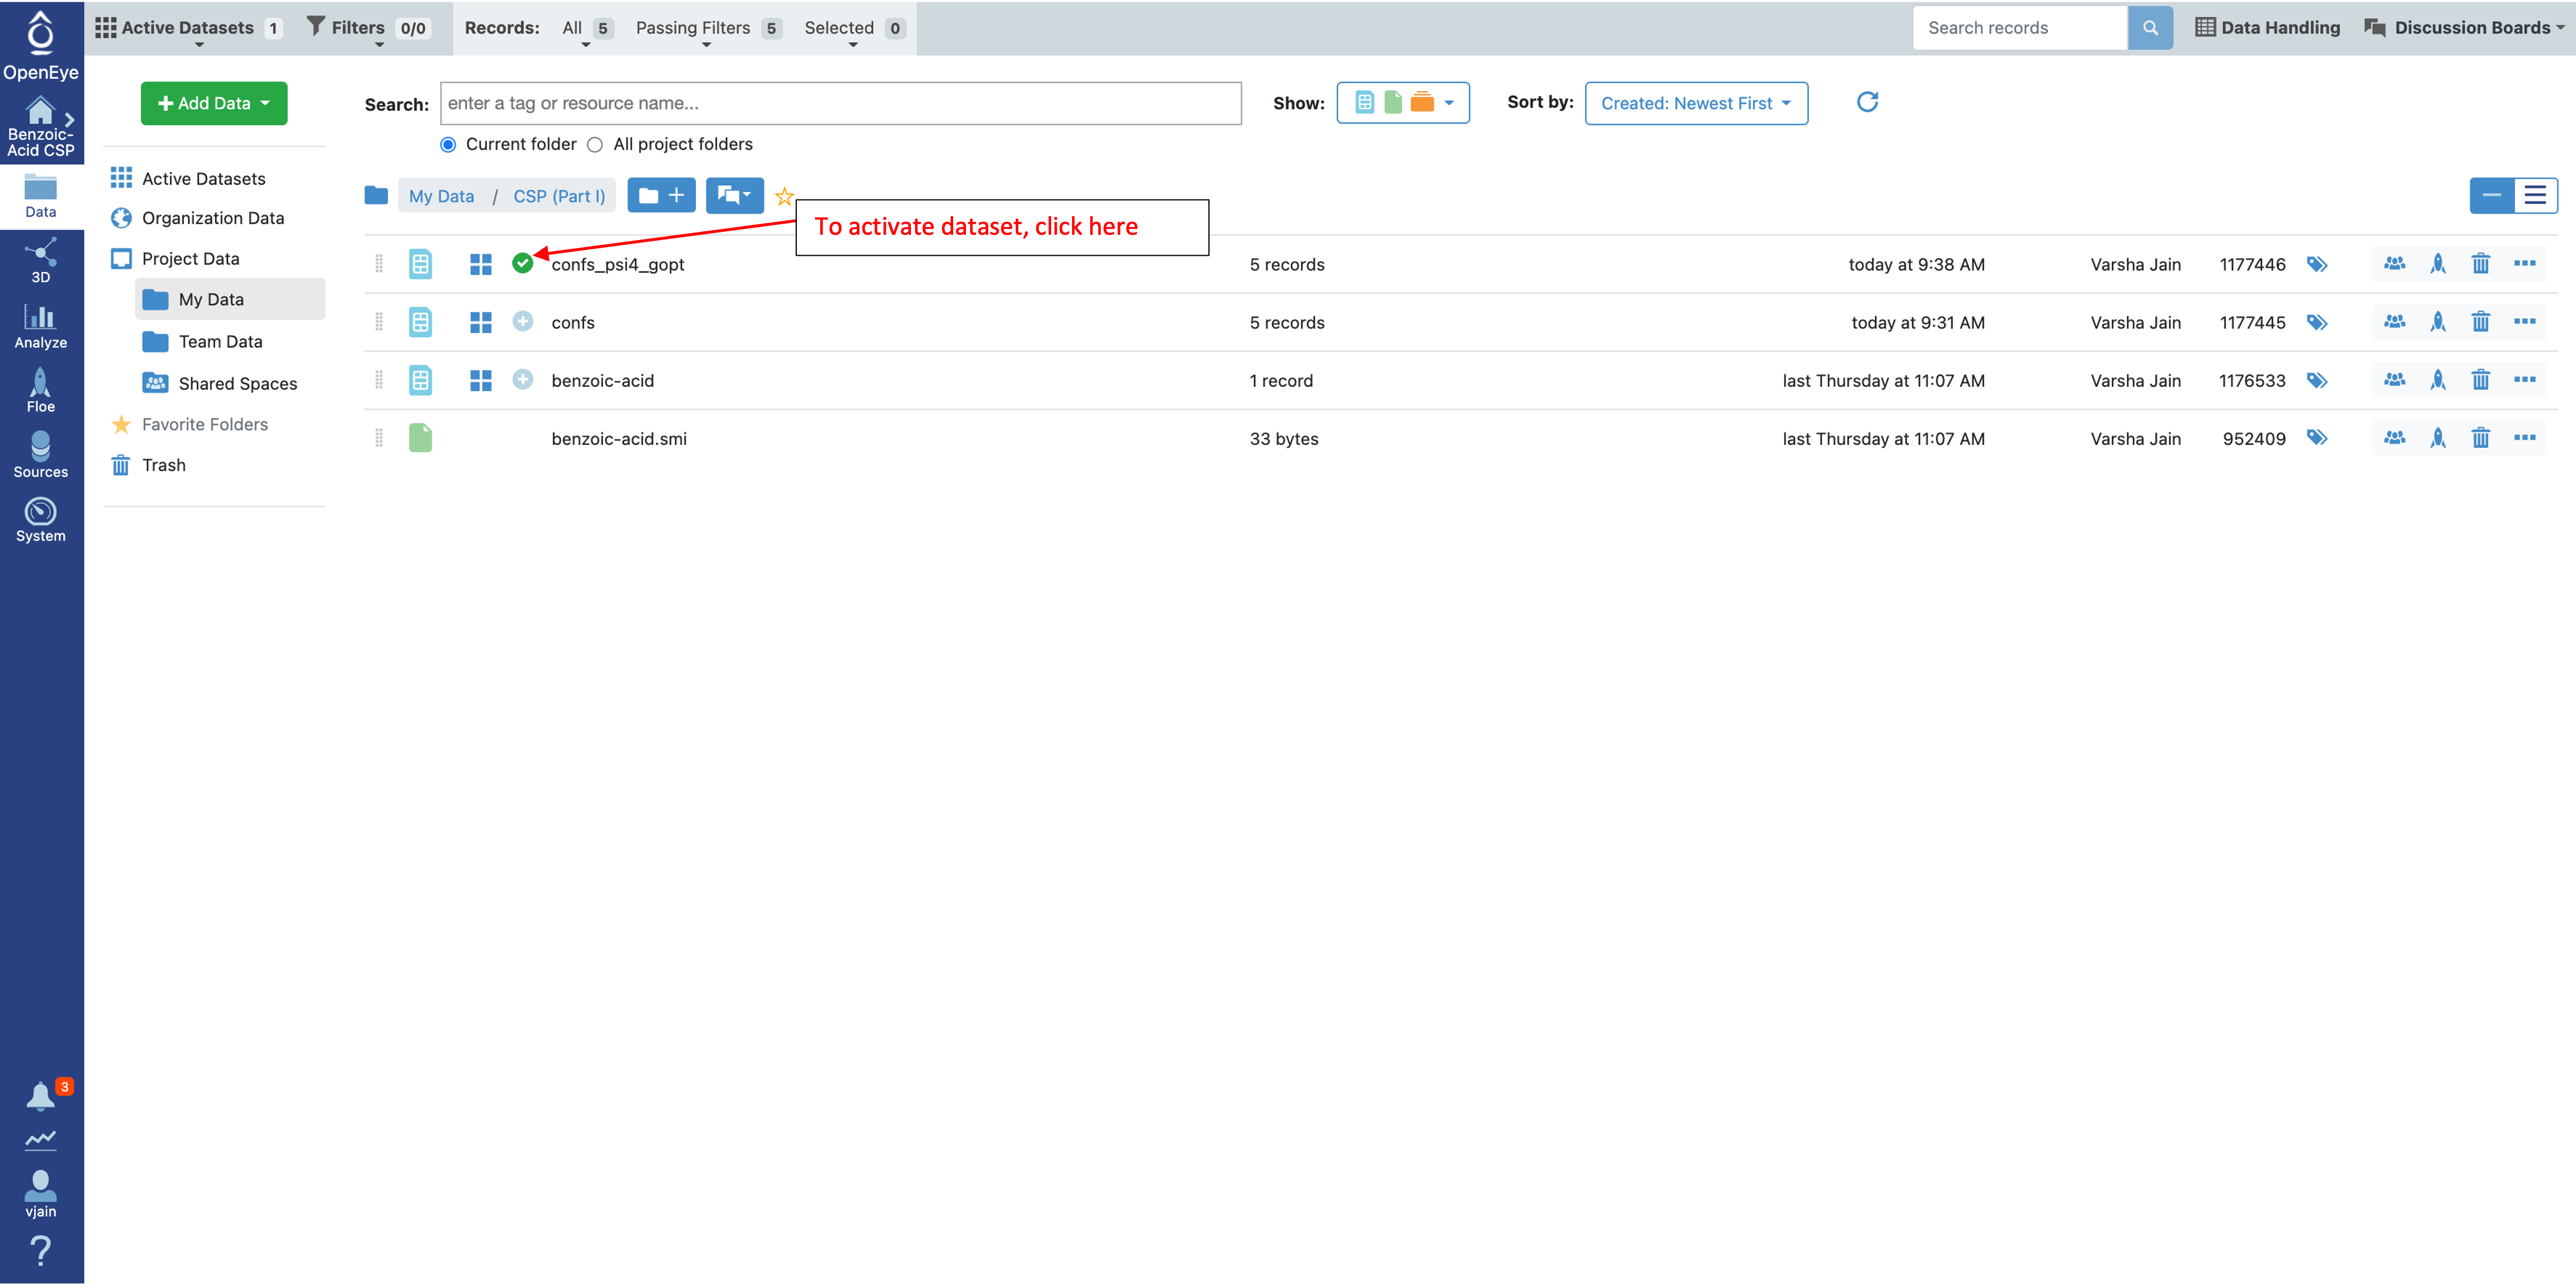
Once the “confs_psi4_gopt” dataset is selected, click on the 3D tab on the left.
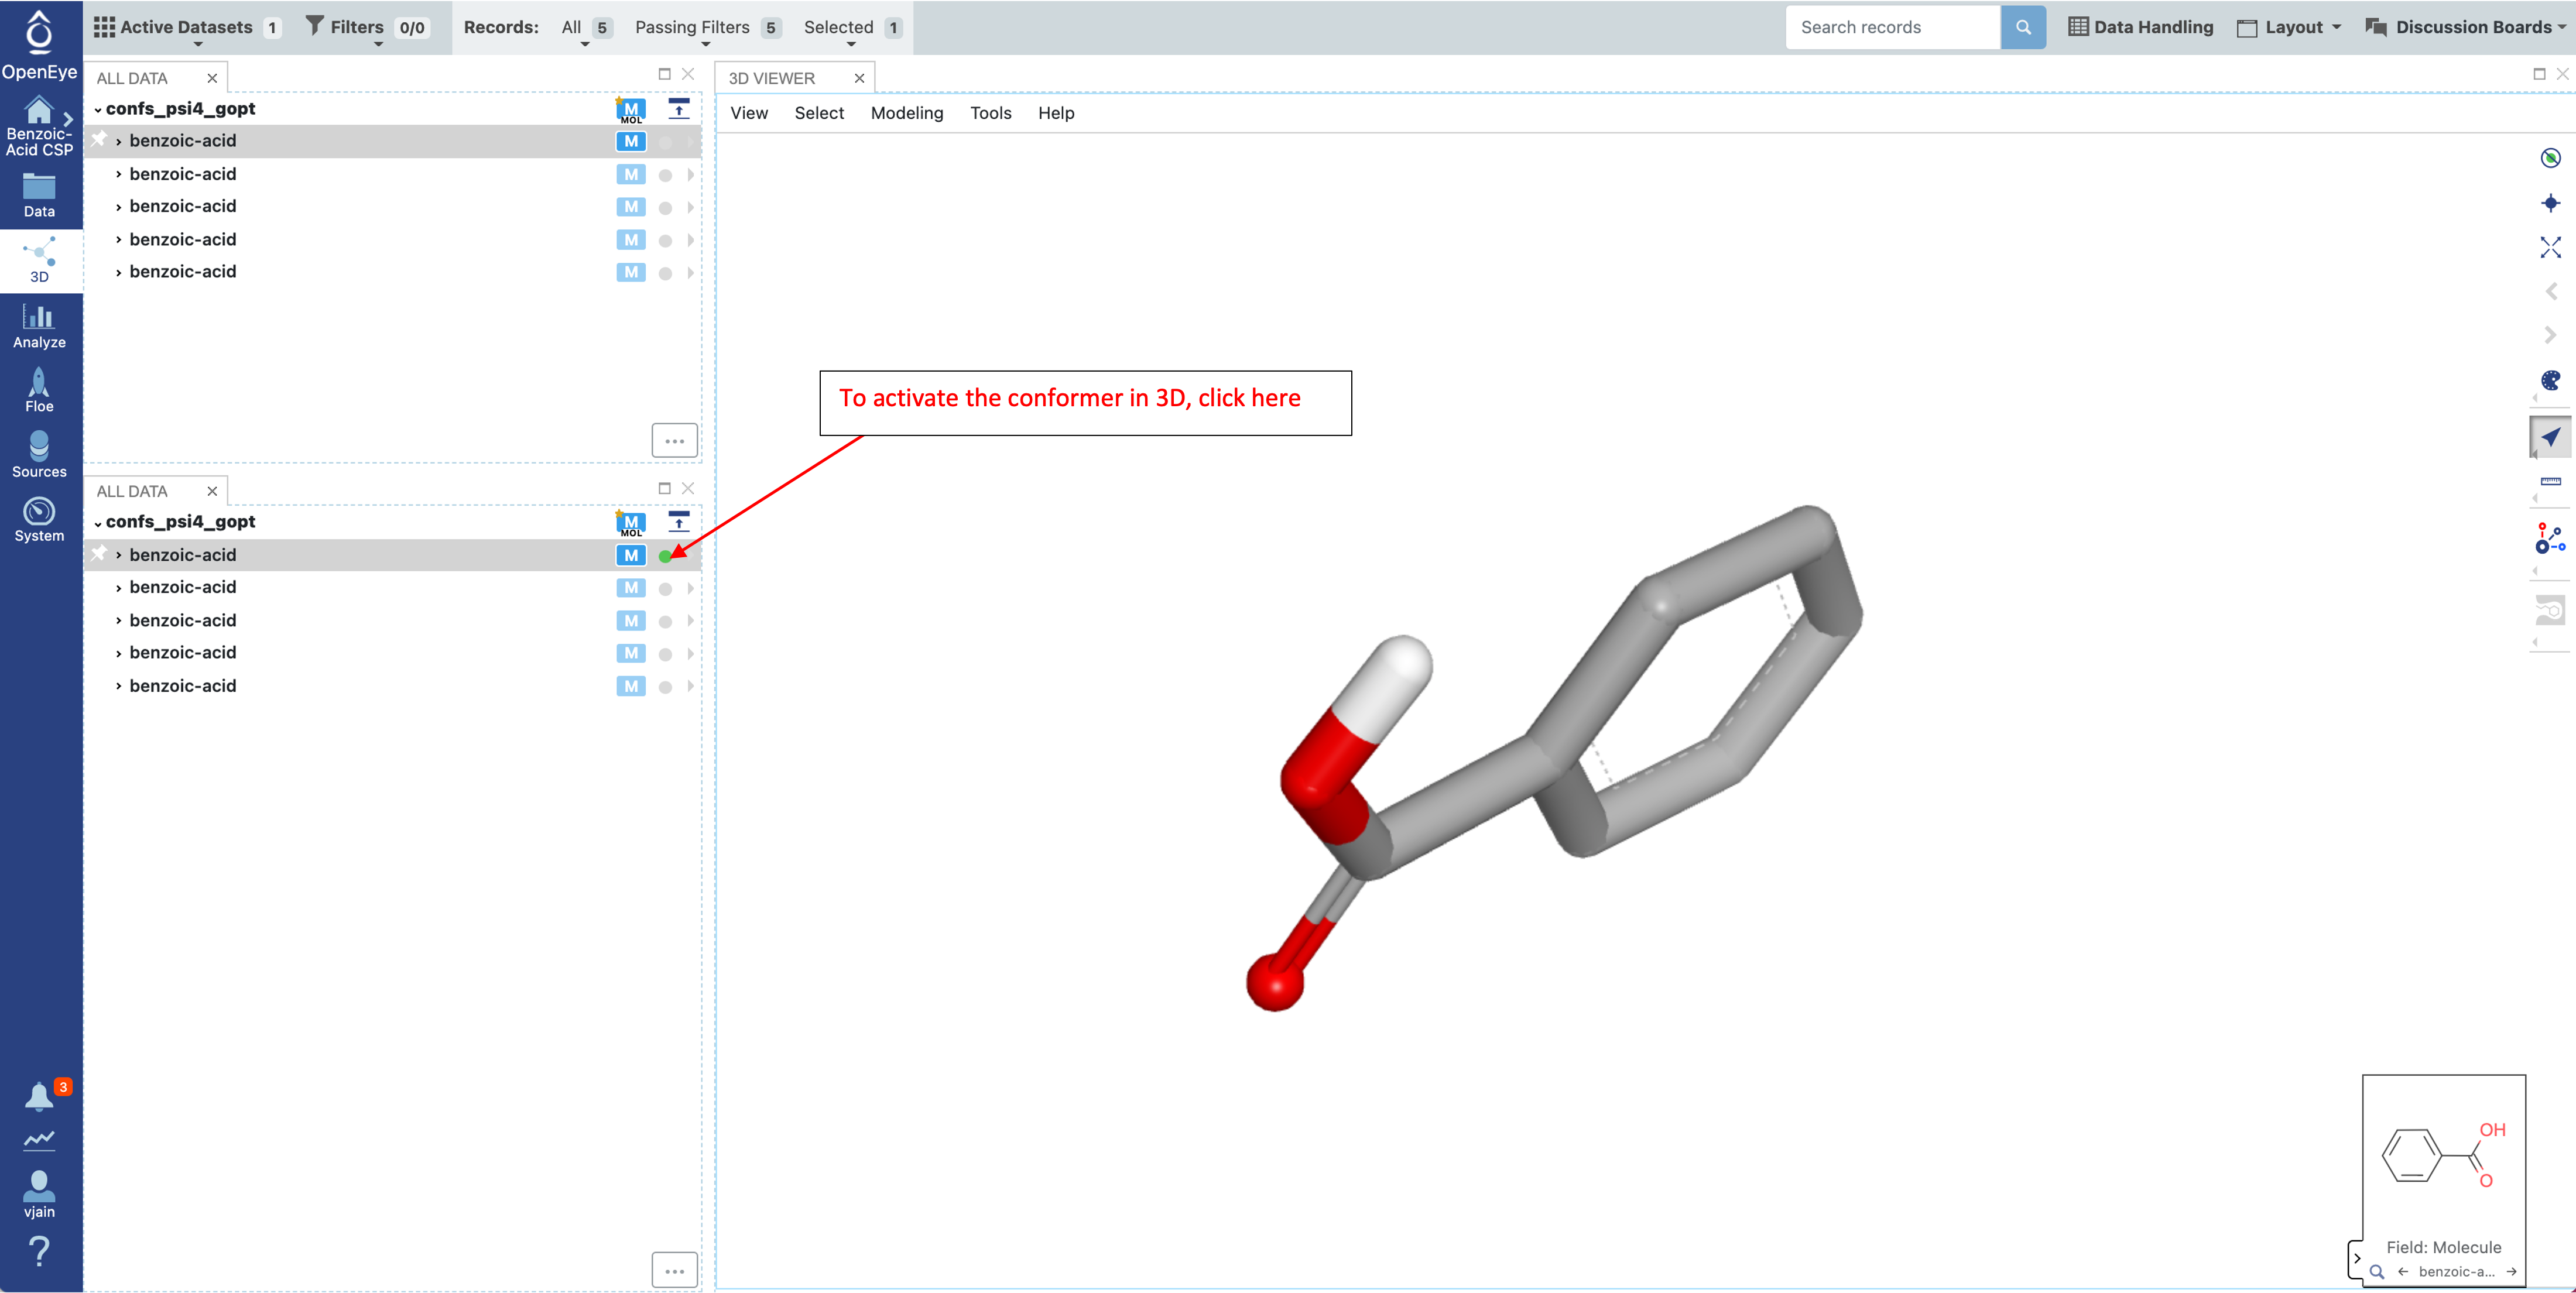
This dataset will have three fields describing the energy of each conformer. “Psi4 Opt Energies (kcal/mol)” is the total conformer energy after the constrained optimization – the HF-3c energy for each conformer. “Psi4 Energy (kcal/mol)” comes from the single point energy calculation, the B3LYP-D3MBJ/6-31G* energy. Finally the “Psi4 Strain Energy (kcal/mol)” field describes the relative single point energies compared to the lowest energy conformer. This relative energy will be used in the next Floe as the conformer strain contribution to the crystal stability.
Polymorph Search with IEFF Crystal Force Field (Part II of CSP Protocol: Generation and Filtering)
Part II of the CSP protocol is the Polymorph Search with IEFF Crystal Force Field (Part II of CSP Protocol: Generation and Filtering) Floe. In this tutorial, crystal structures are generated by packing all five conformers found in Part I in the top 10 most common space groups. Running this full Floe will cost about $4.00. For the Cost Saving Option,: follow the instructions below to generate crystal structures in only the experimental space group (14) which should reduce the cost to around $0.50. Alternatively, skip to the Analyze CSP Part II Results section below to analyze the provided output.
Run CSP Part II Floe
To run this Floe, search for “IEFF” or the full title in the Product-based / Crystal Structure Prediction category path.
This Floe requires only one input dataset, which is the confs_psi4_gopt dataset from Part I. By default, this Floe generates 10,000 crystal packings in the top 10 space groups (1,000 packing/space group) for each conformer. Space groups are ranked based on the frequency they appear in the Crystal Structure Database. This Floe filters the predicted structures based on energy, which is computed as the IEFF lattice energy plus the conformer strain energy (computed in Part I). By default, the energy window is set to 5 kcal/mol.
The parameter “Number Of Top Space Groups” can be used to specify the number of space groups sampled in this Floe. Then use the parameter “Space Group Choices” to choose to sample all space groups “SampleTopSpaceGroups” or only those with no inversion “SampleTopChiralSpaceGroups”. The latter is preferred if the molecule is a pure isomer of a chiral molecule. To sample a specific list of space groups, two parameters need to be changed:
“Space Group Choices” should be set to “SampleFromListOfSpaceGroups”
“List Of Spacegroups” should be a list of space groups separated by a space. The space groups should be specified as numbers (i.e. 2 not P-1).
Adjust any of the sampling parameters or energy windows accordingly, but remember that sampling more (or different) space groups could increase the cost of running the Floe.
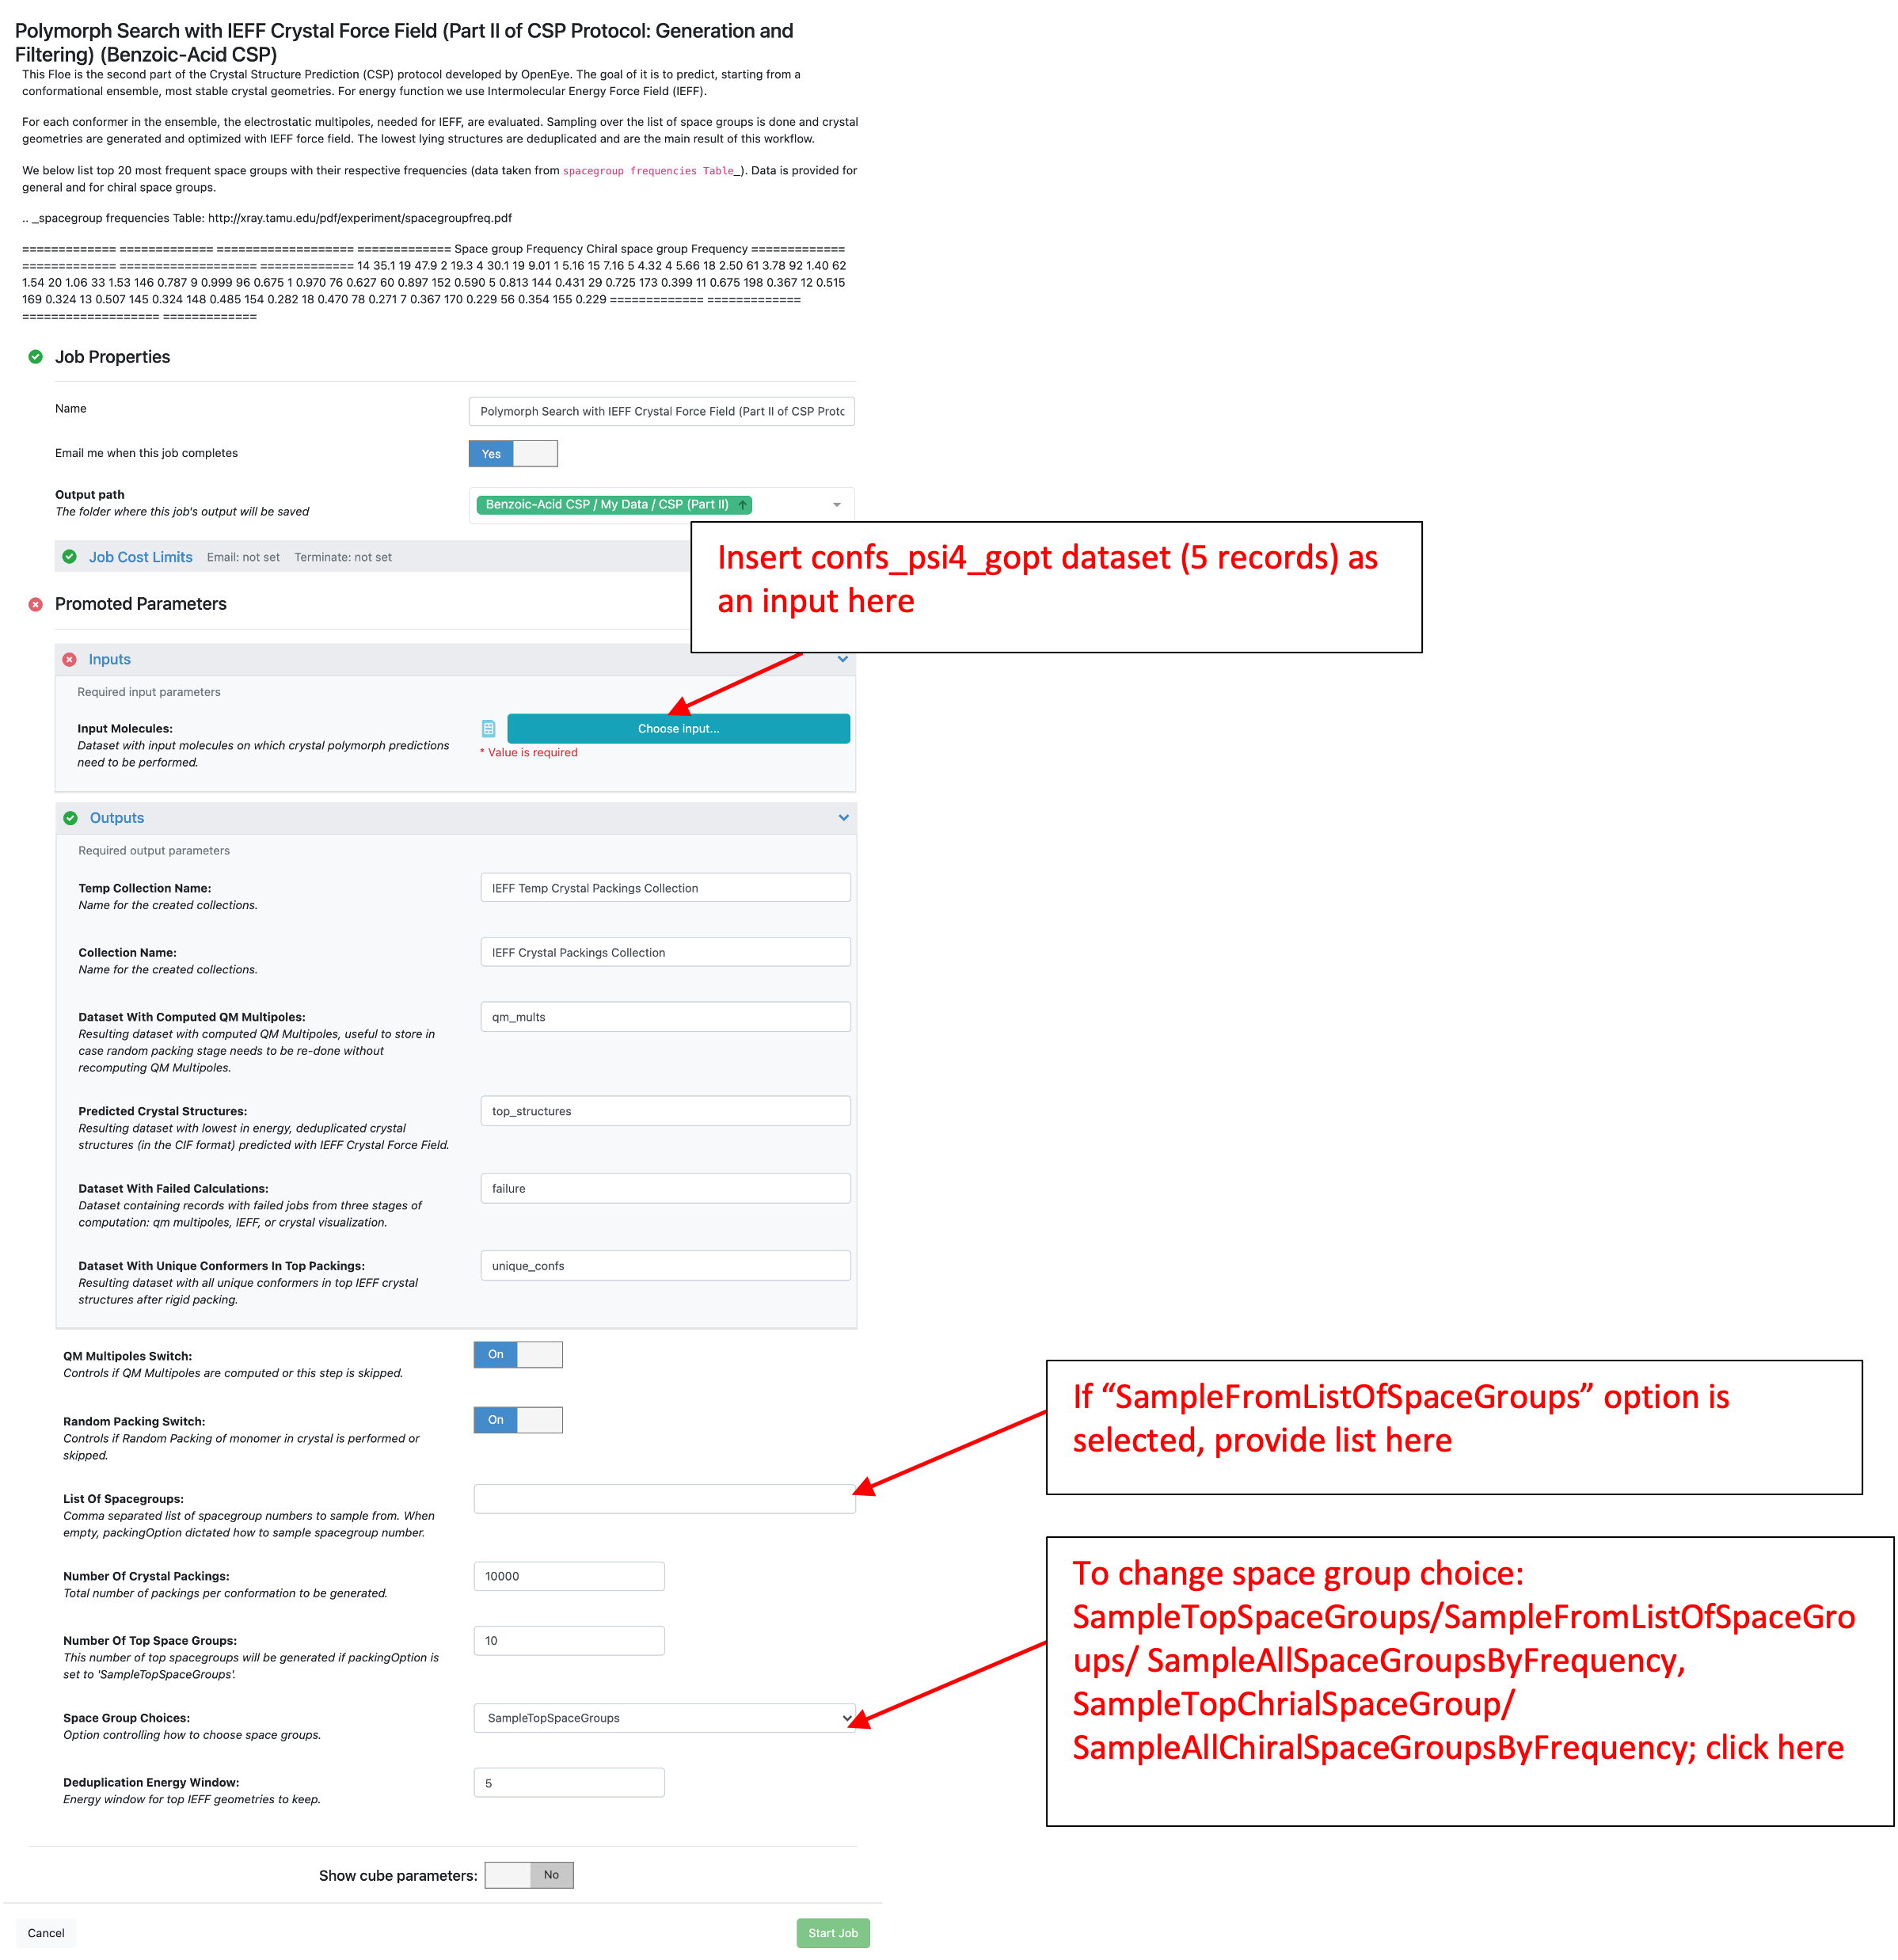
For benzoic acid, the “confs_psi4_gopt” created during Part I was used for “Input Molecules.” All other parameters were left as their defaults with the input form shown below.

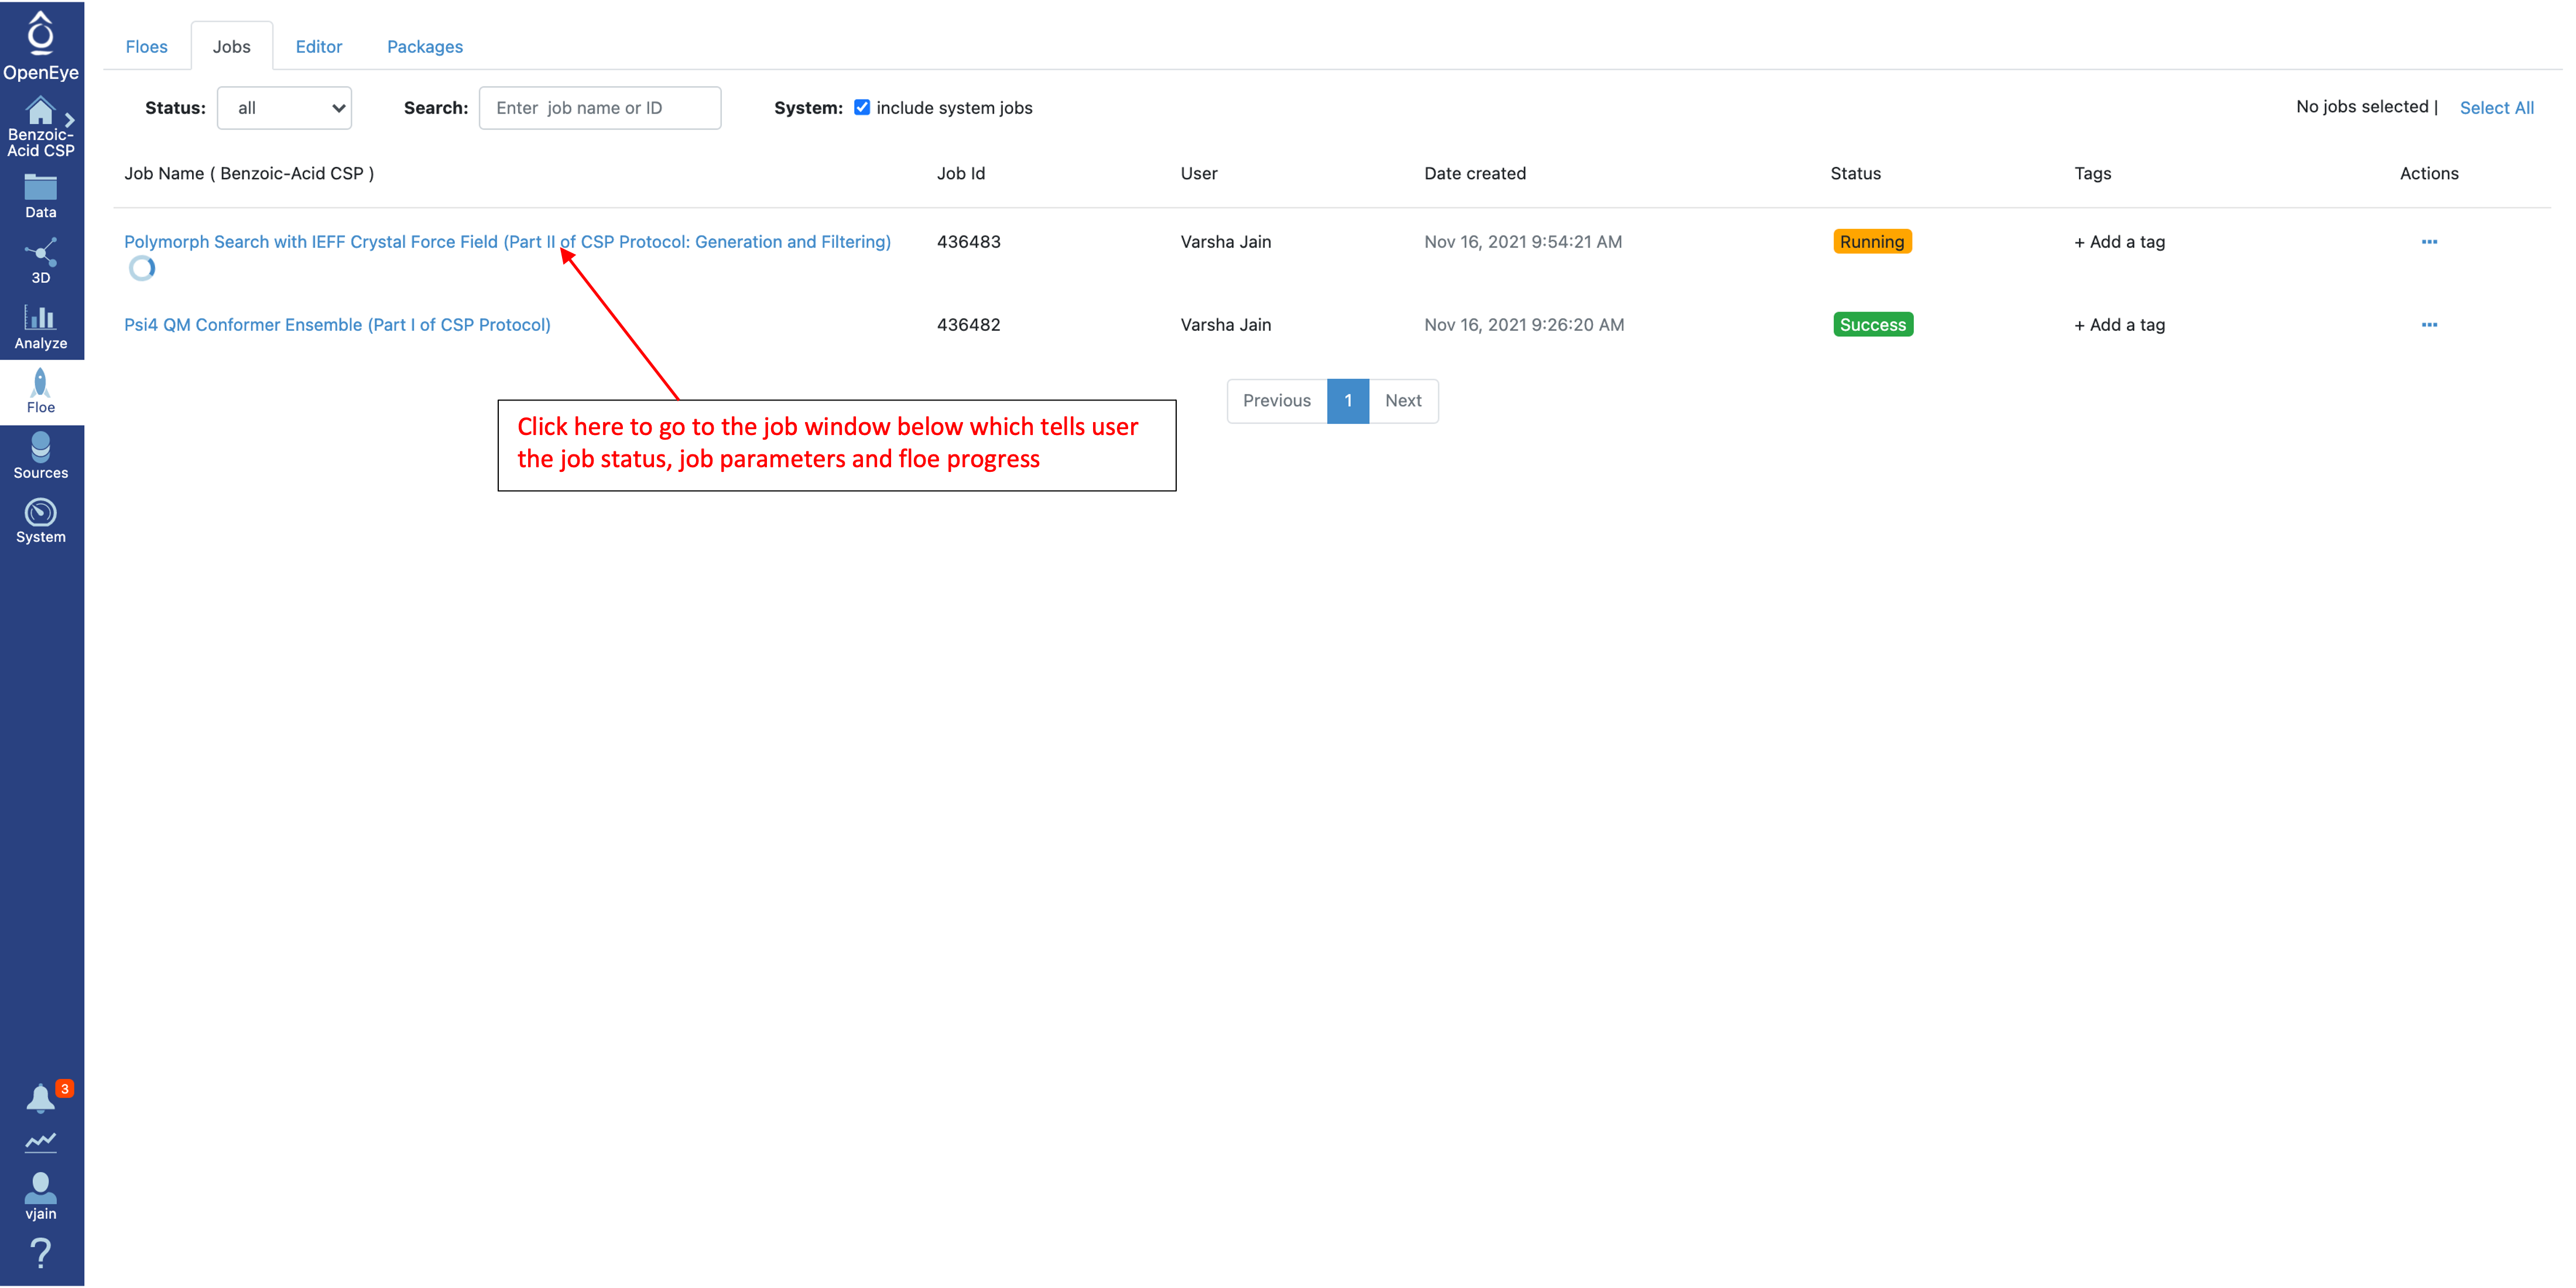
Once the job has started, check the Floe progress by navigating to the “Jobs” tab and selecting this Floe
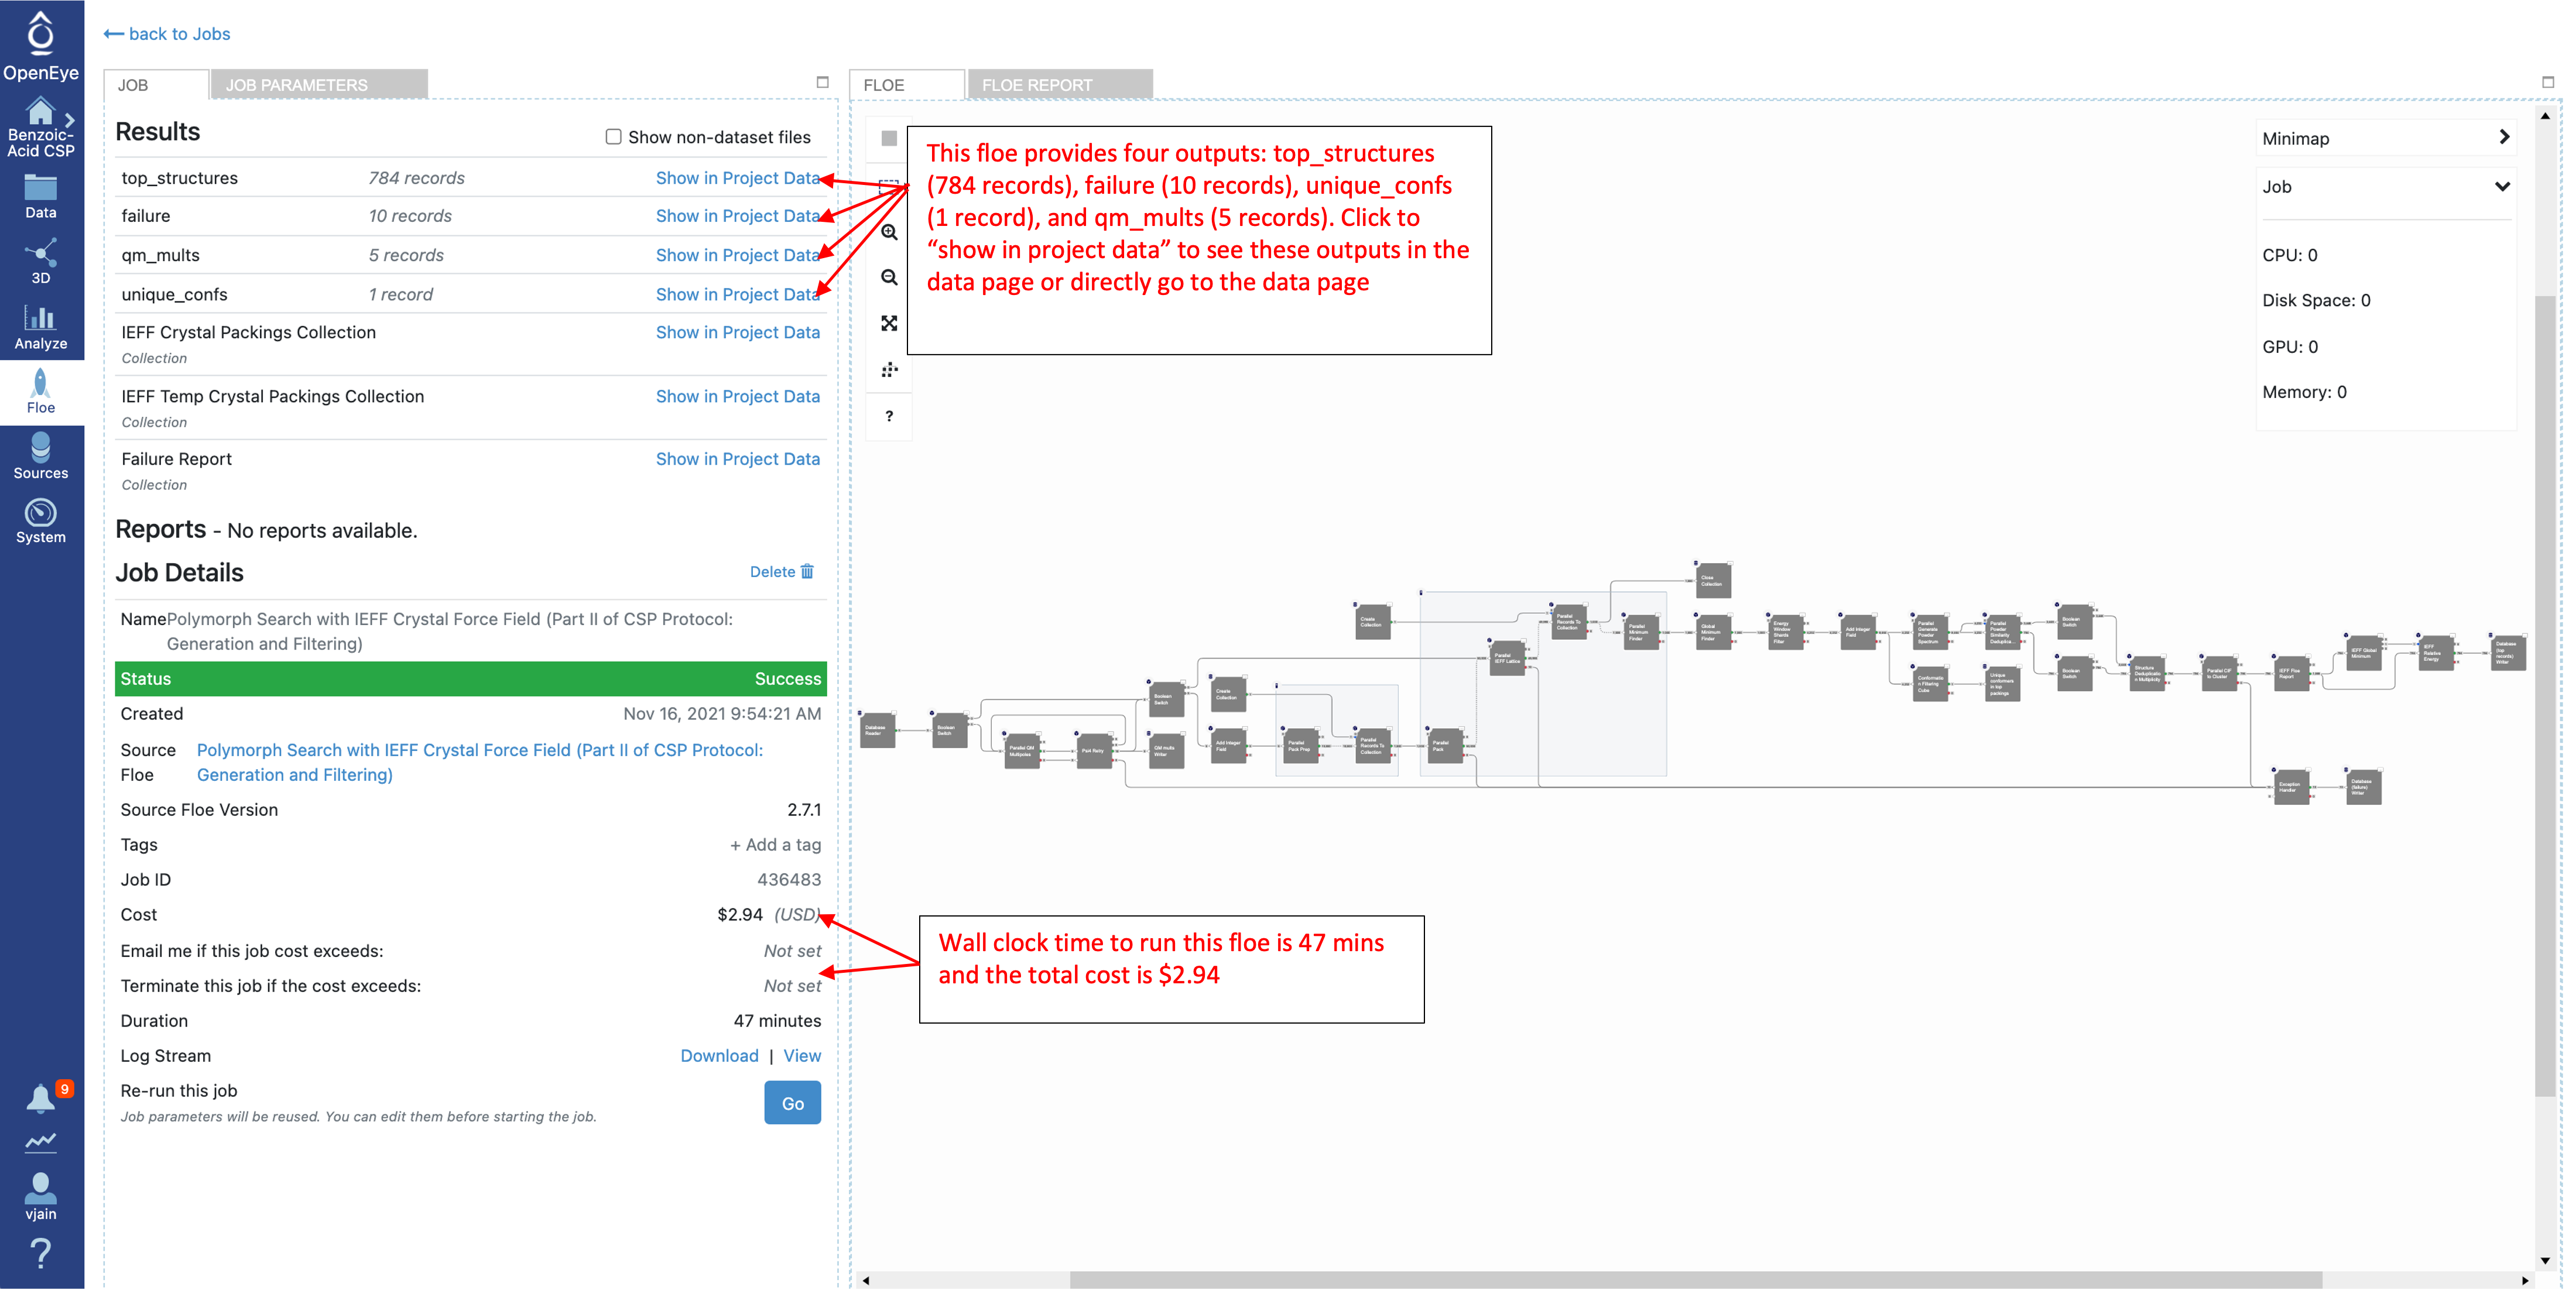
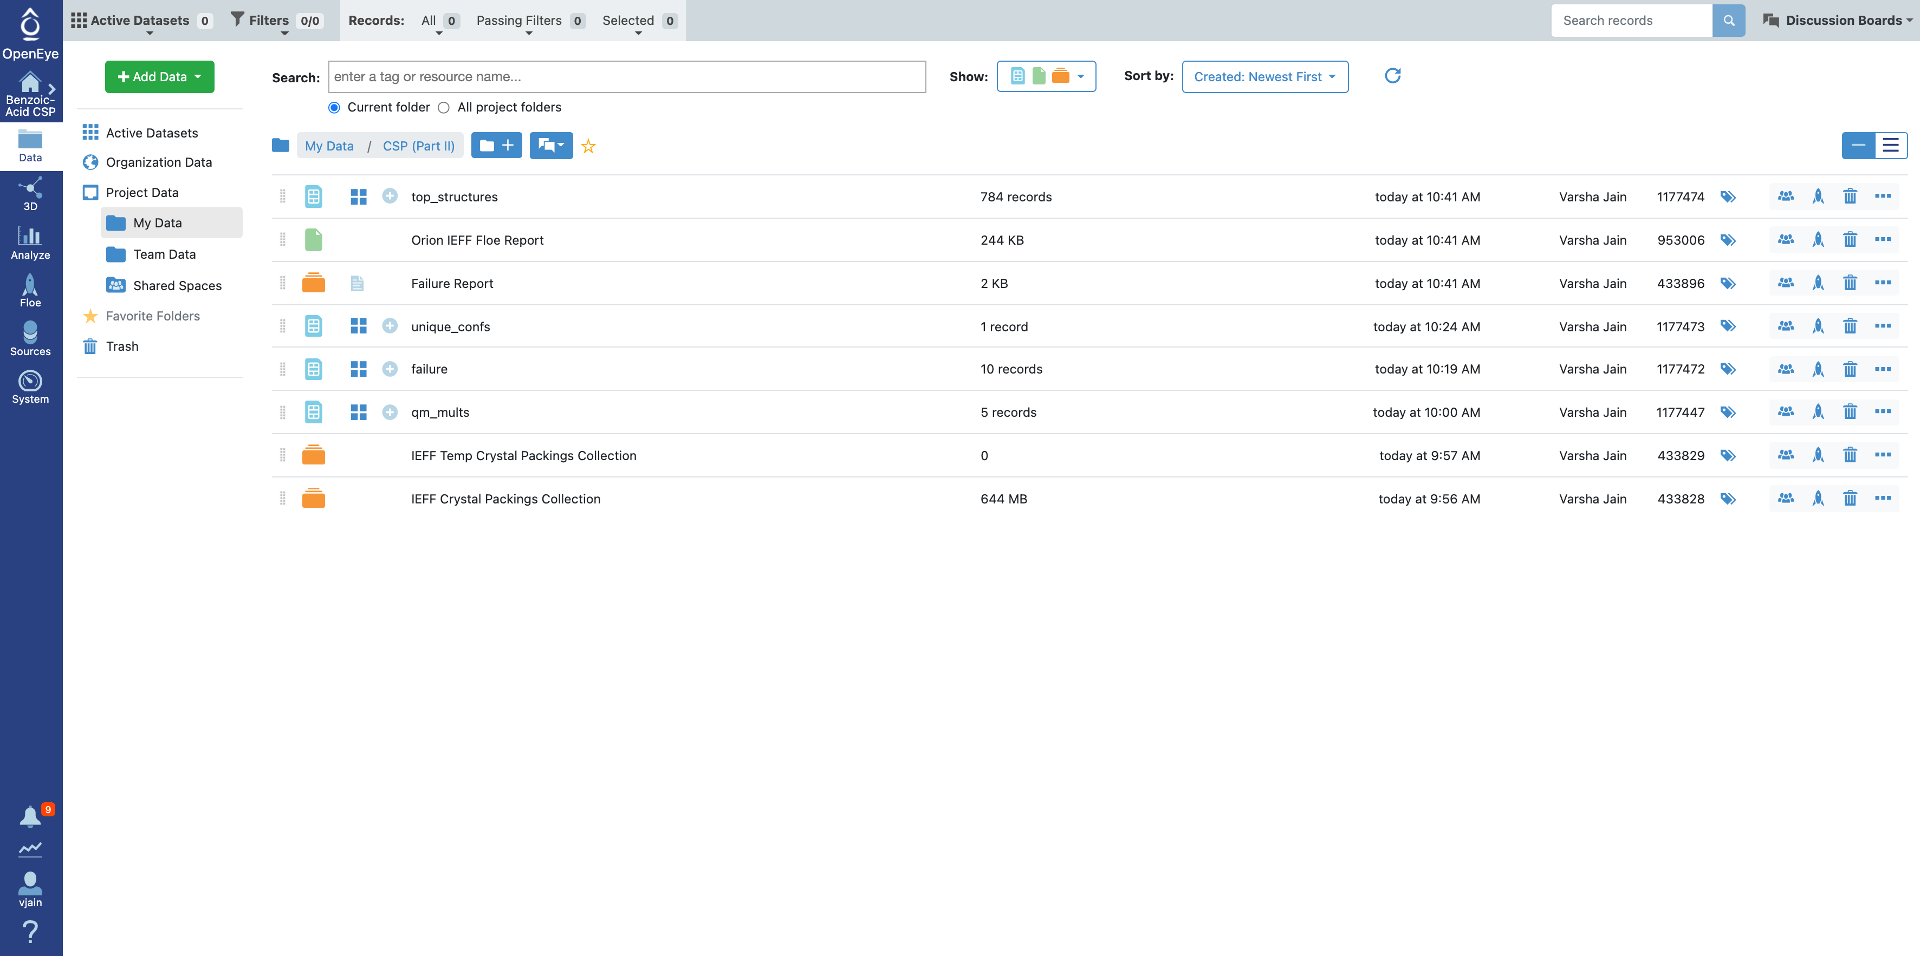
Once the job has finished, the results will be at the top of the job status page. Click on “Show in Project Data” or navigate to the Data tab. There are four output datasets and one collection generated by this Floe with default output names:
top_structures are the deduplicated predicted crystal structures that are within the specified energy window.
failure has records with any failures from the Floe, the most common failure is a very high energy packing that failed to optimize. These should only cause concern if the number if fairly large compared to the total number of packings generated (more than 10%).
unique_confs are the conformers found in the top crystal structure packings. When performing a multi-stage prediction they would be the reference input during conformer generation.
qm_mults are the input conformers with calculated multipoles, If the Floe needs to be repeated (i.e. to sample more space groups) This dataset can be used as input with the “QM Multipoles Switch” parameter set to off.
IEFF Crystal Packings Collection contains all the generated and IEFF optimized packings (10,000/conformer by default). It can be used as the input to refilter IEFF results with a new energy window if necessary.
This window also provides failure report and Orion IEFF Floe report as shown below. Failure report provides causes for failed calculations at IEFF level.
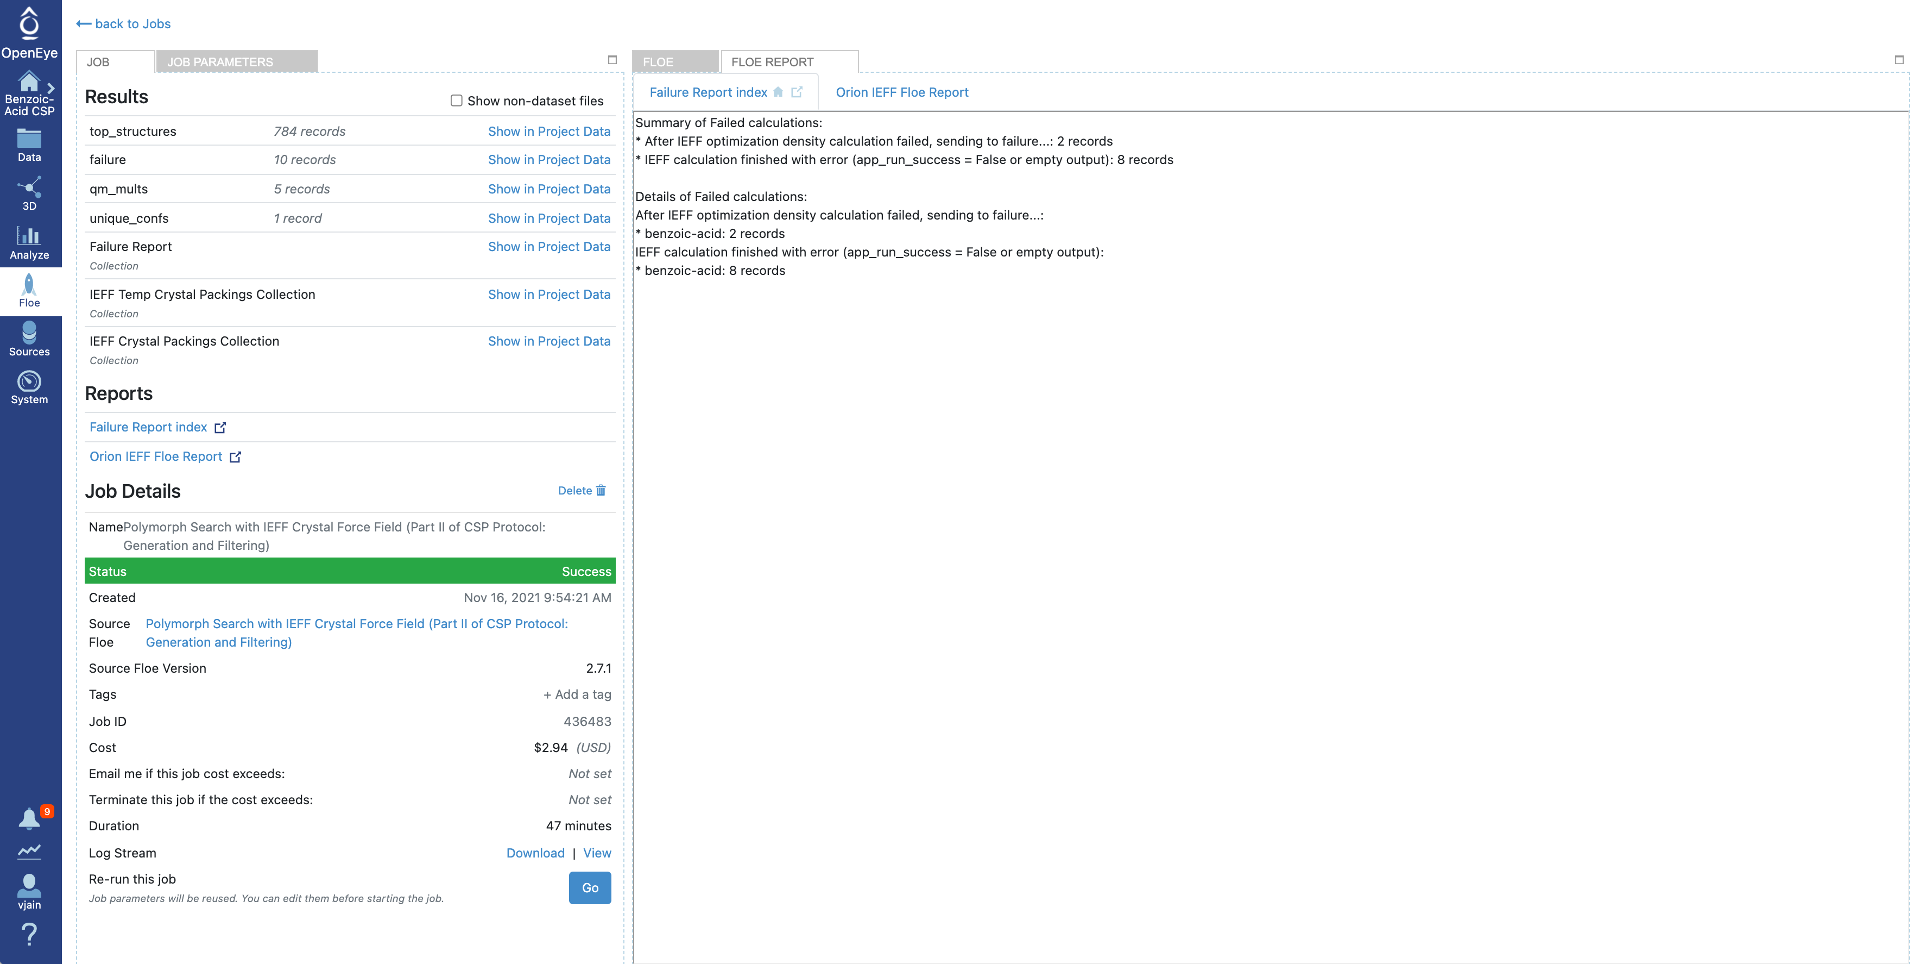
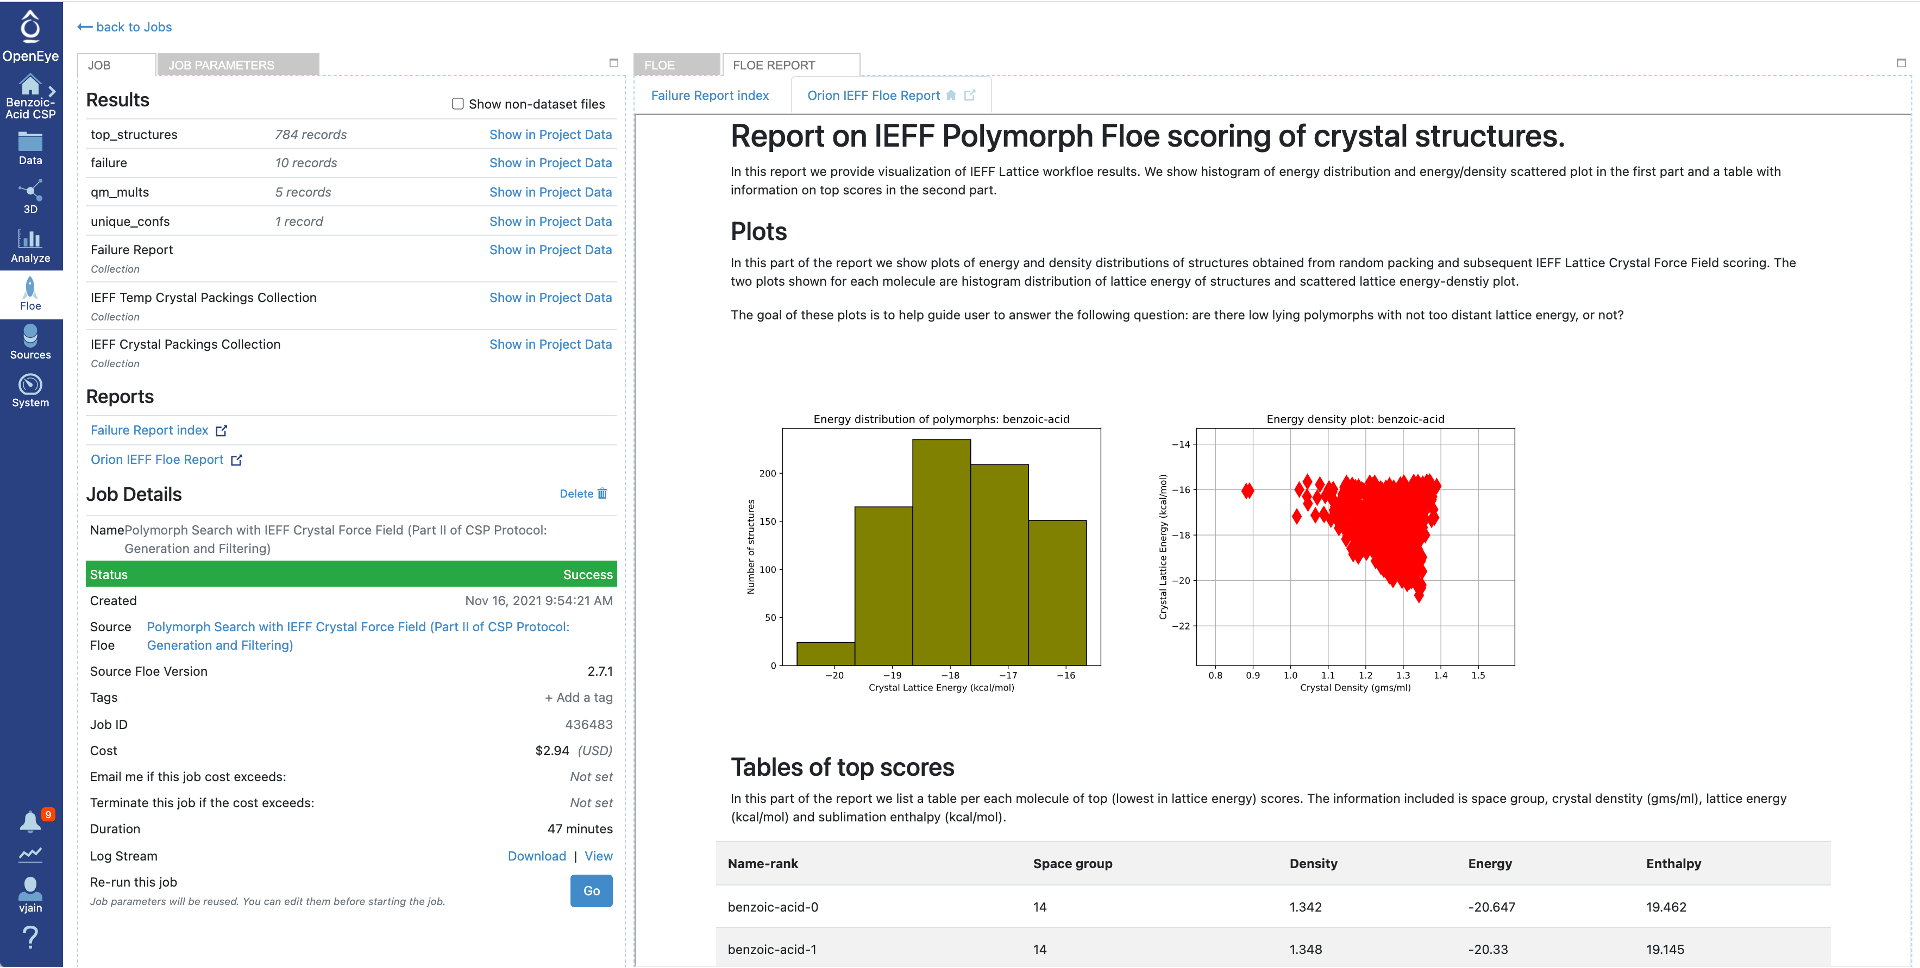
Orion IEFF Floe report contains the following two parts:
Plots summarizing the top structures: * a histogram of the energy distribution * an energy vs density scattered plot
A table of top scoring structures (default: 100) with detailed information for each.
After running the Floe, both reports are also available in the data folder as collections or Files and can be downloaded as html if needed. Unfortunately, these cannot be provided in the Organization Data, but can be created using the Polymorph Filtering based on IEFF Energies (Part II’ of CSP Protocol: Filtering) Floe with the provided collection.
Benzoic acid gives a total of 784 top structures (due to the random packing protocol this number may vary slightly) with one unique conformer and five QM multipoles as shown below. During our running of the Floe there were a total of six failure records.
Analyze CSP Part II Results
To locate example output for this Floe navigate to the “Polymorph Search with IEFF Crystal Force Field (Part II …)” folder in the Crystal Math Floes tutorial data (for details about Tutorial Data on Orion).
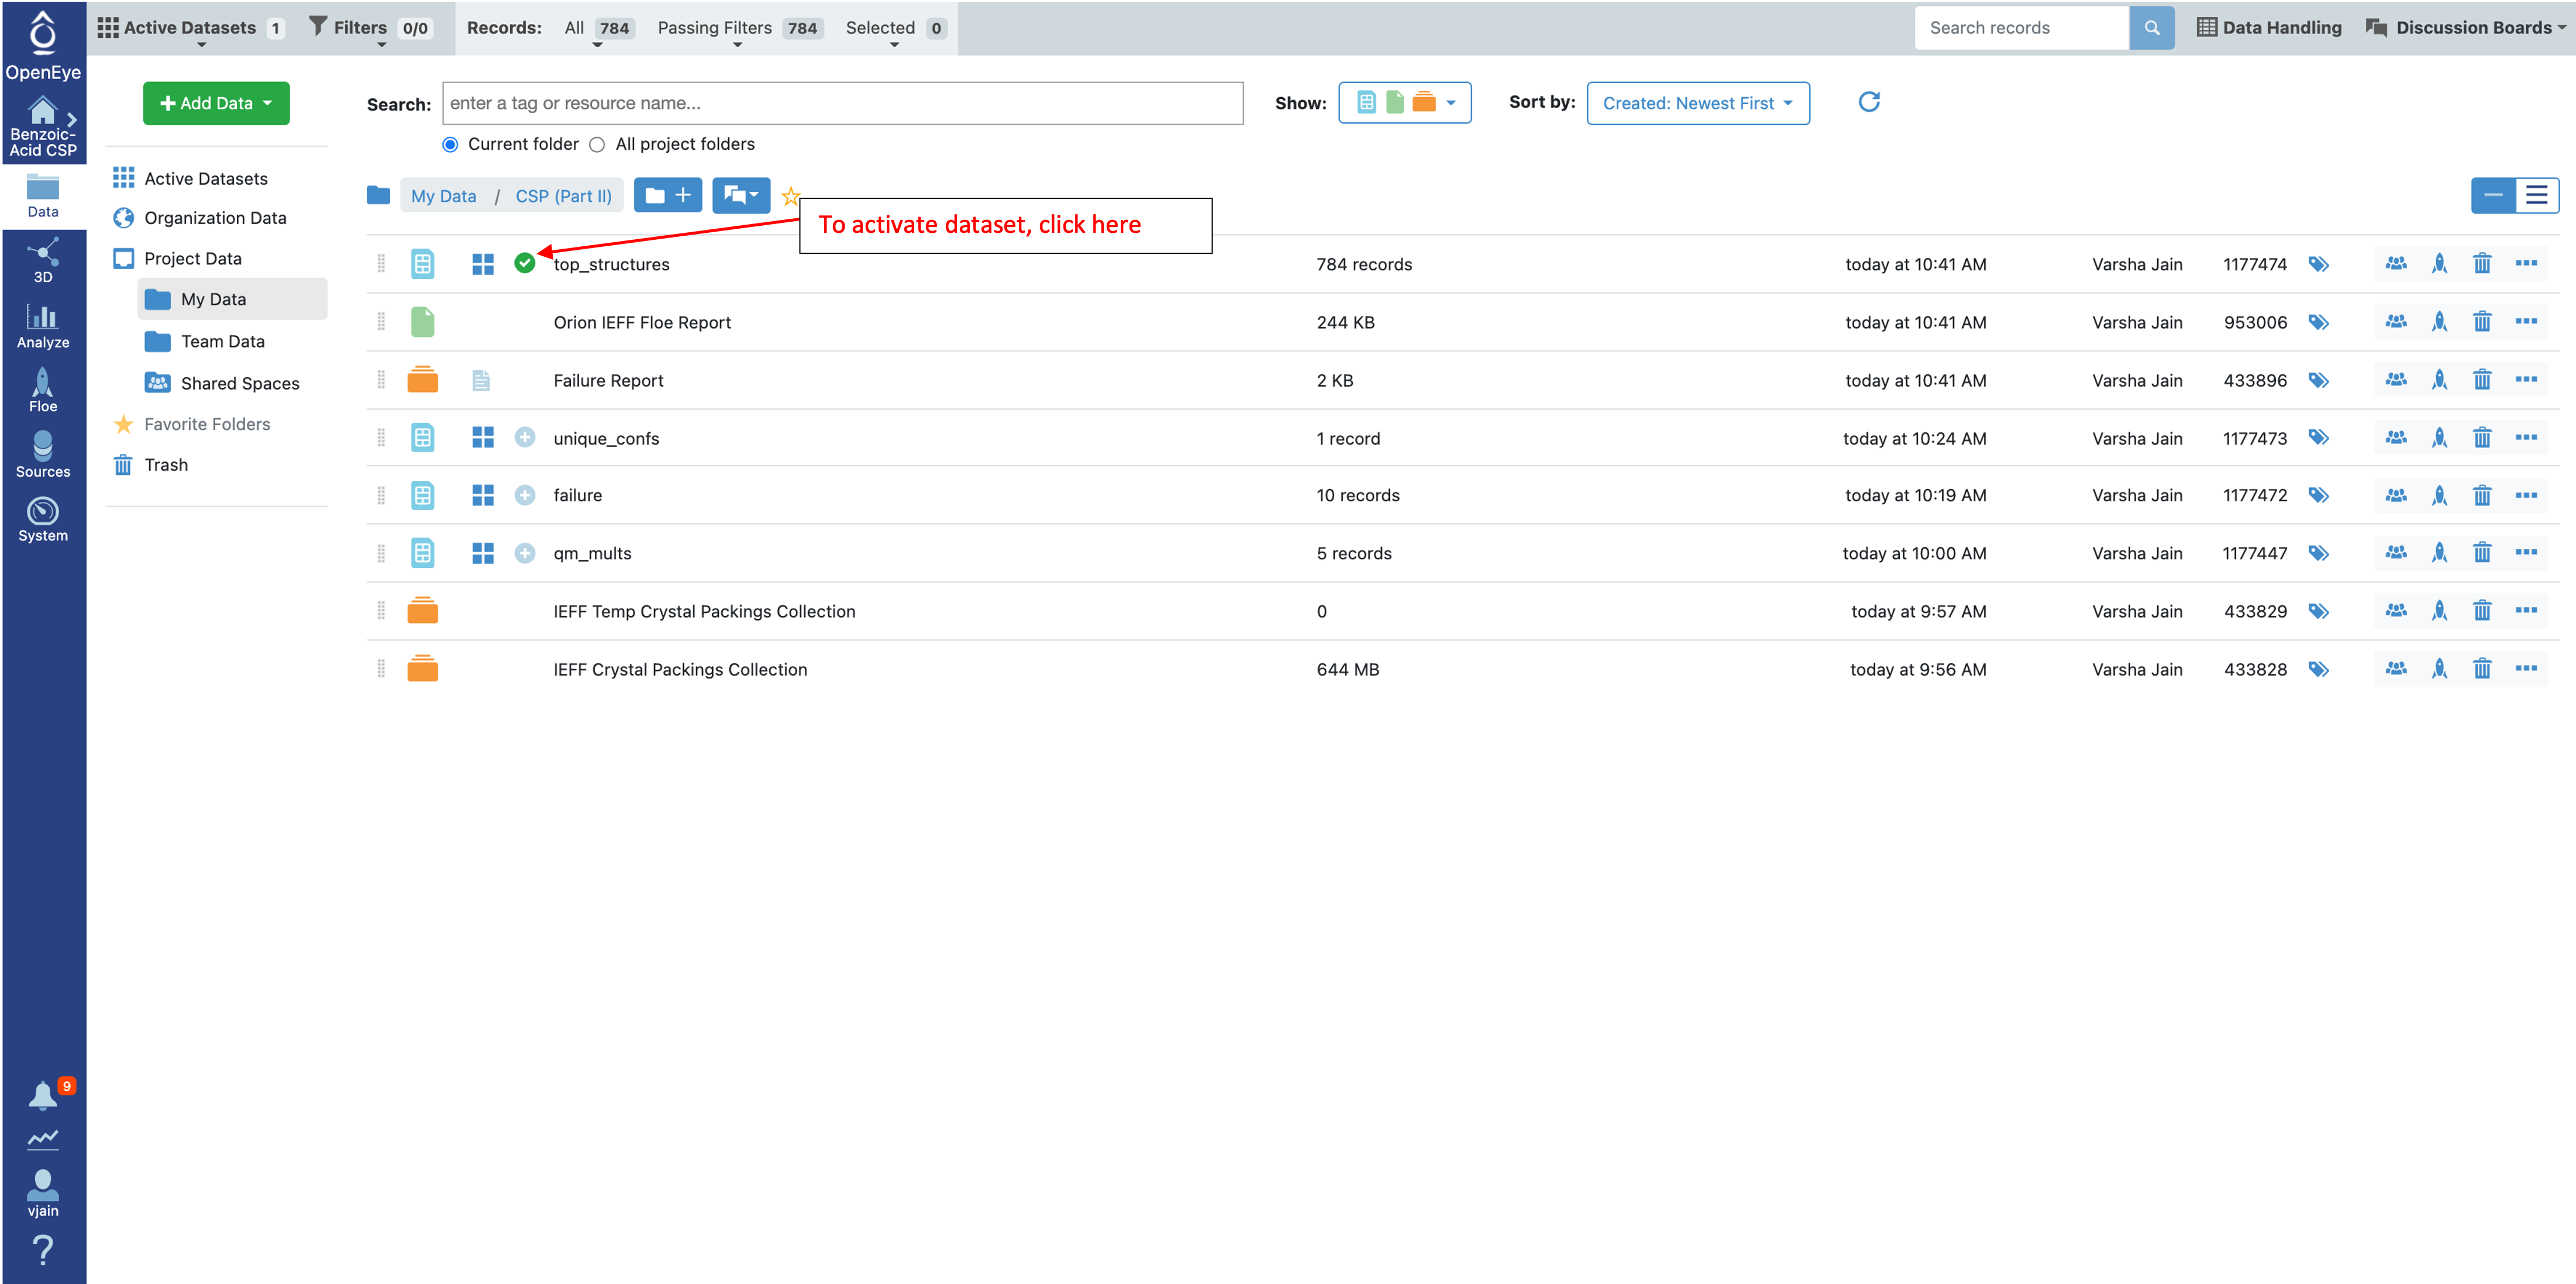
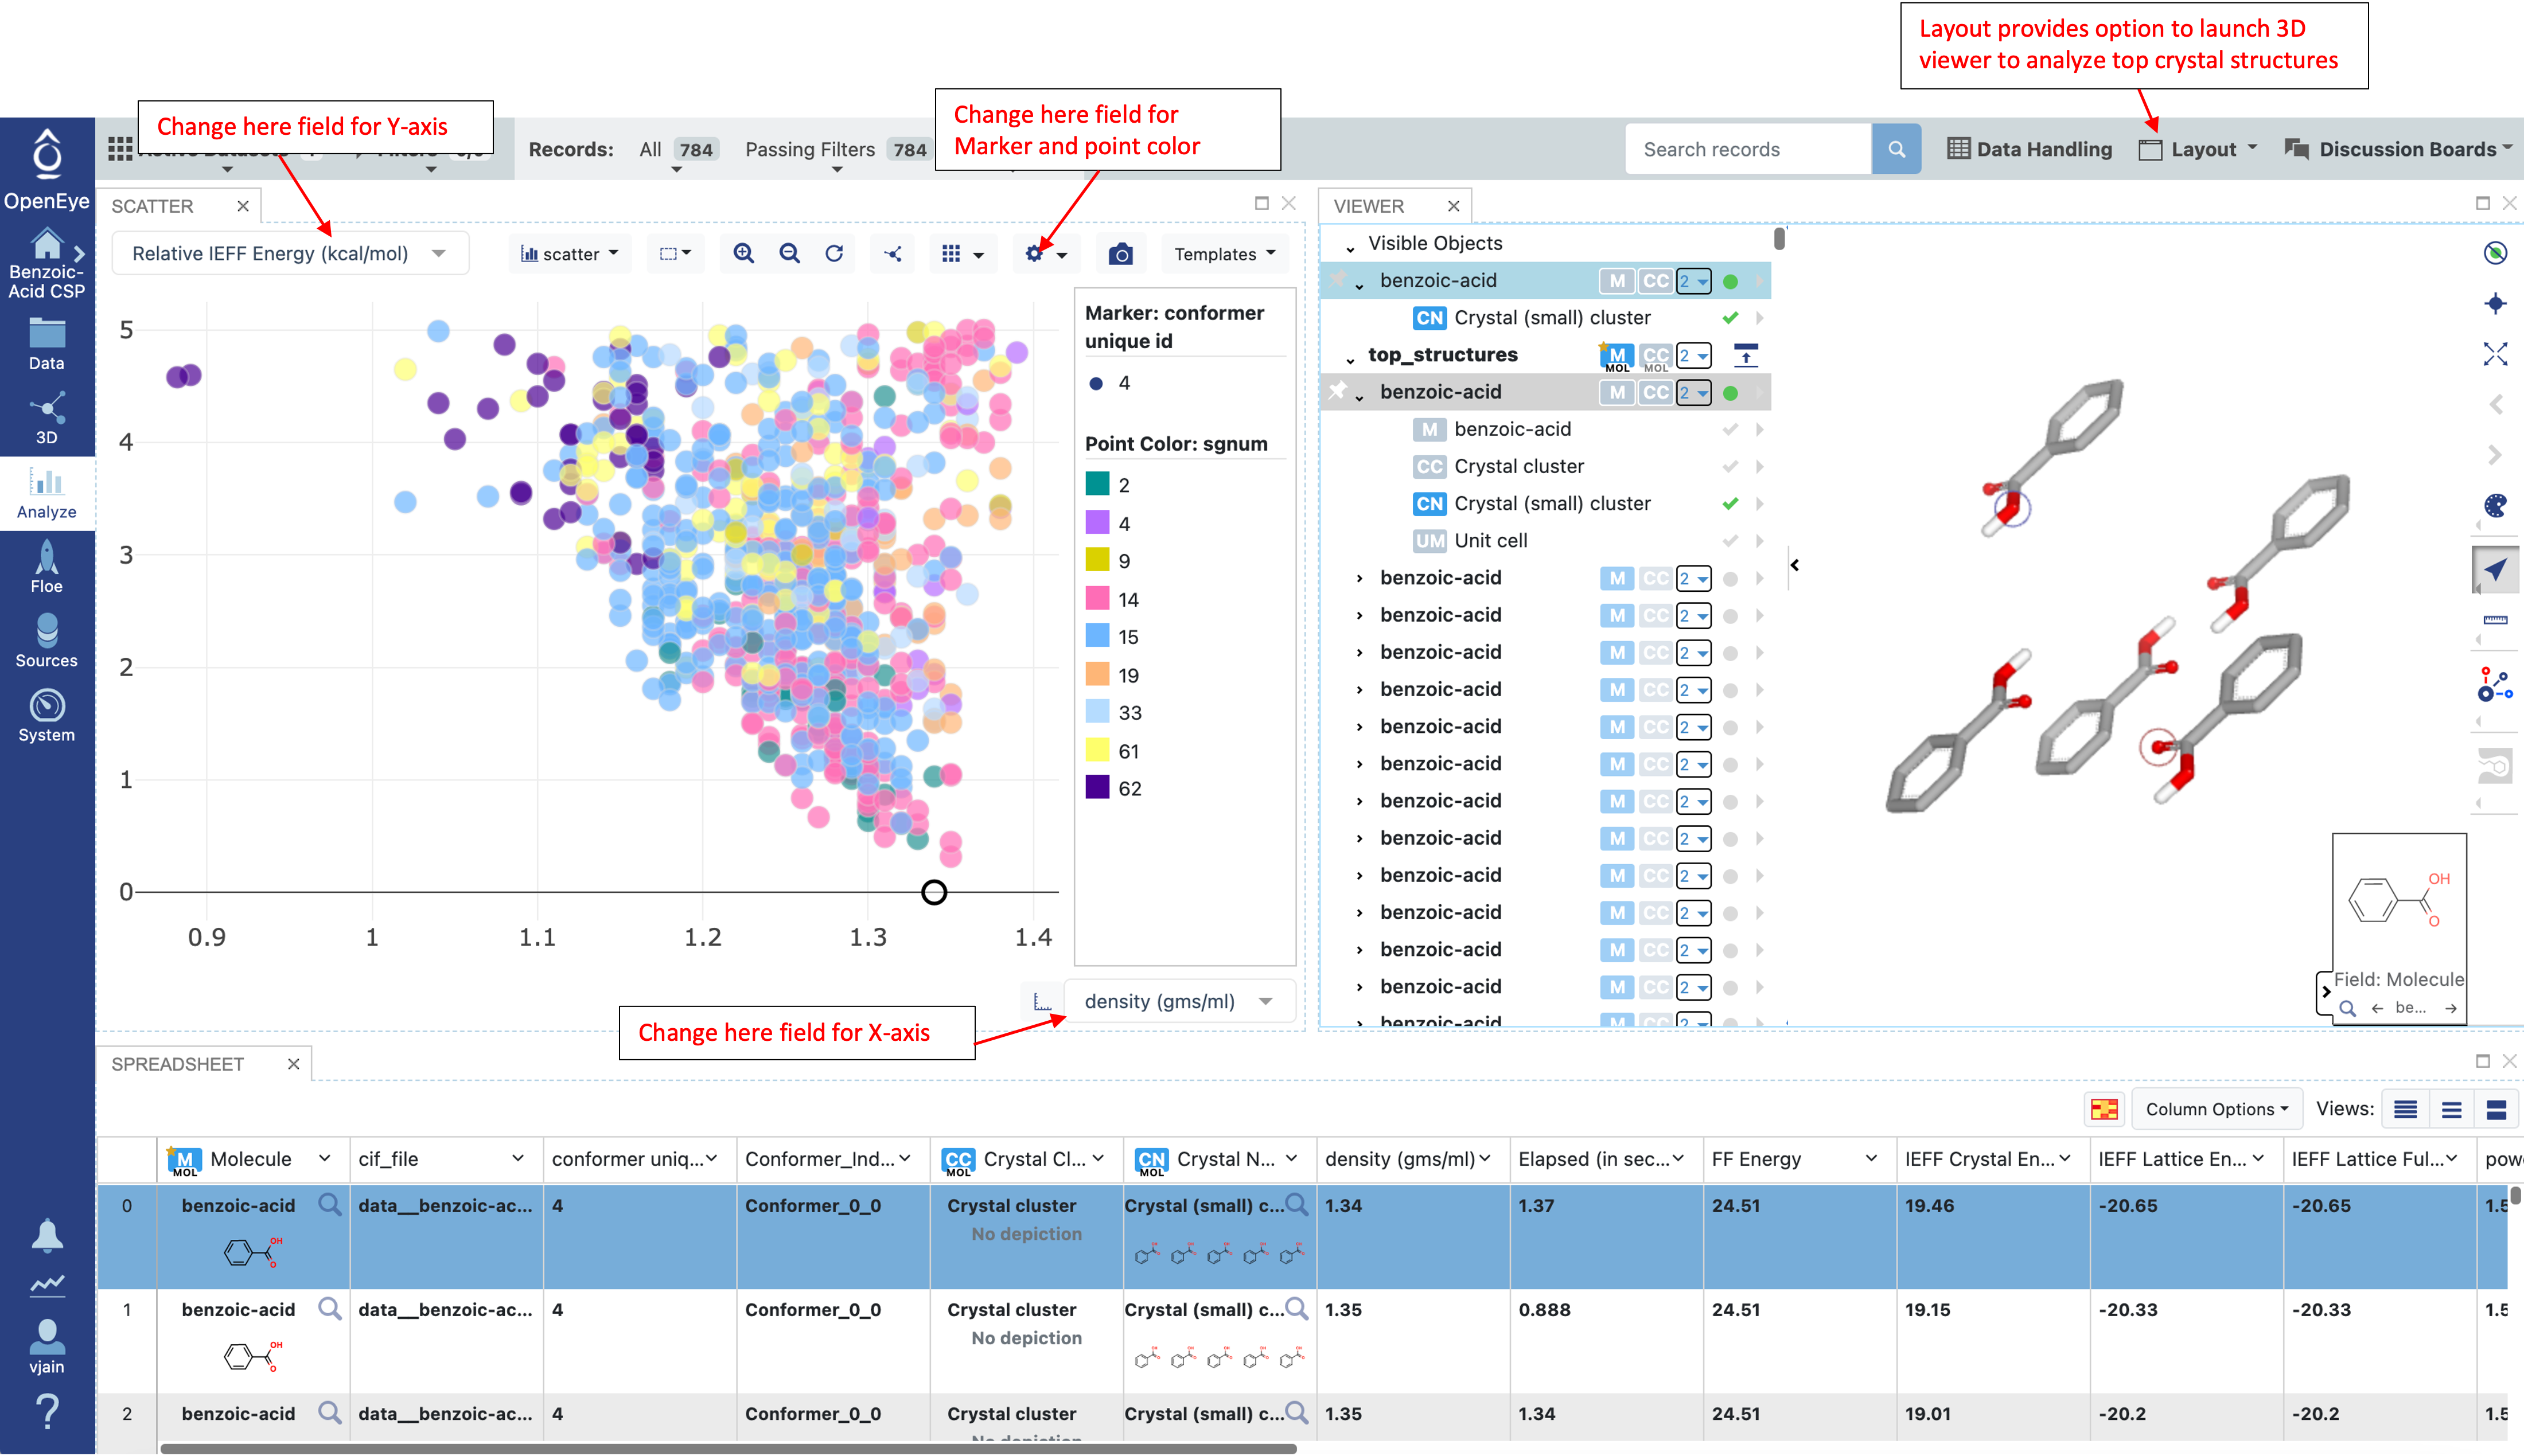
To investigate these structures in the Analyze page and further look at the 3D Viewer, make the top_structures dataset active by clicking on the plus sign.
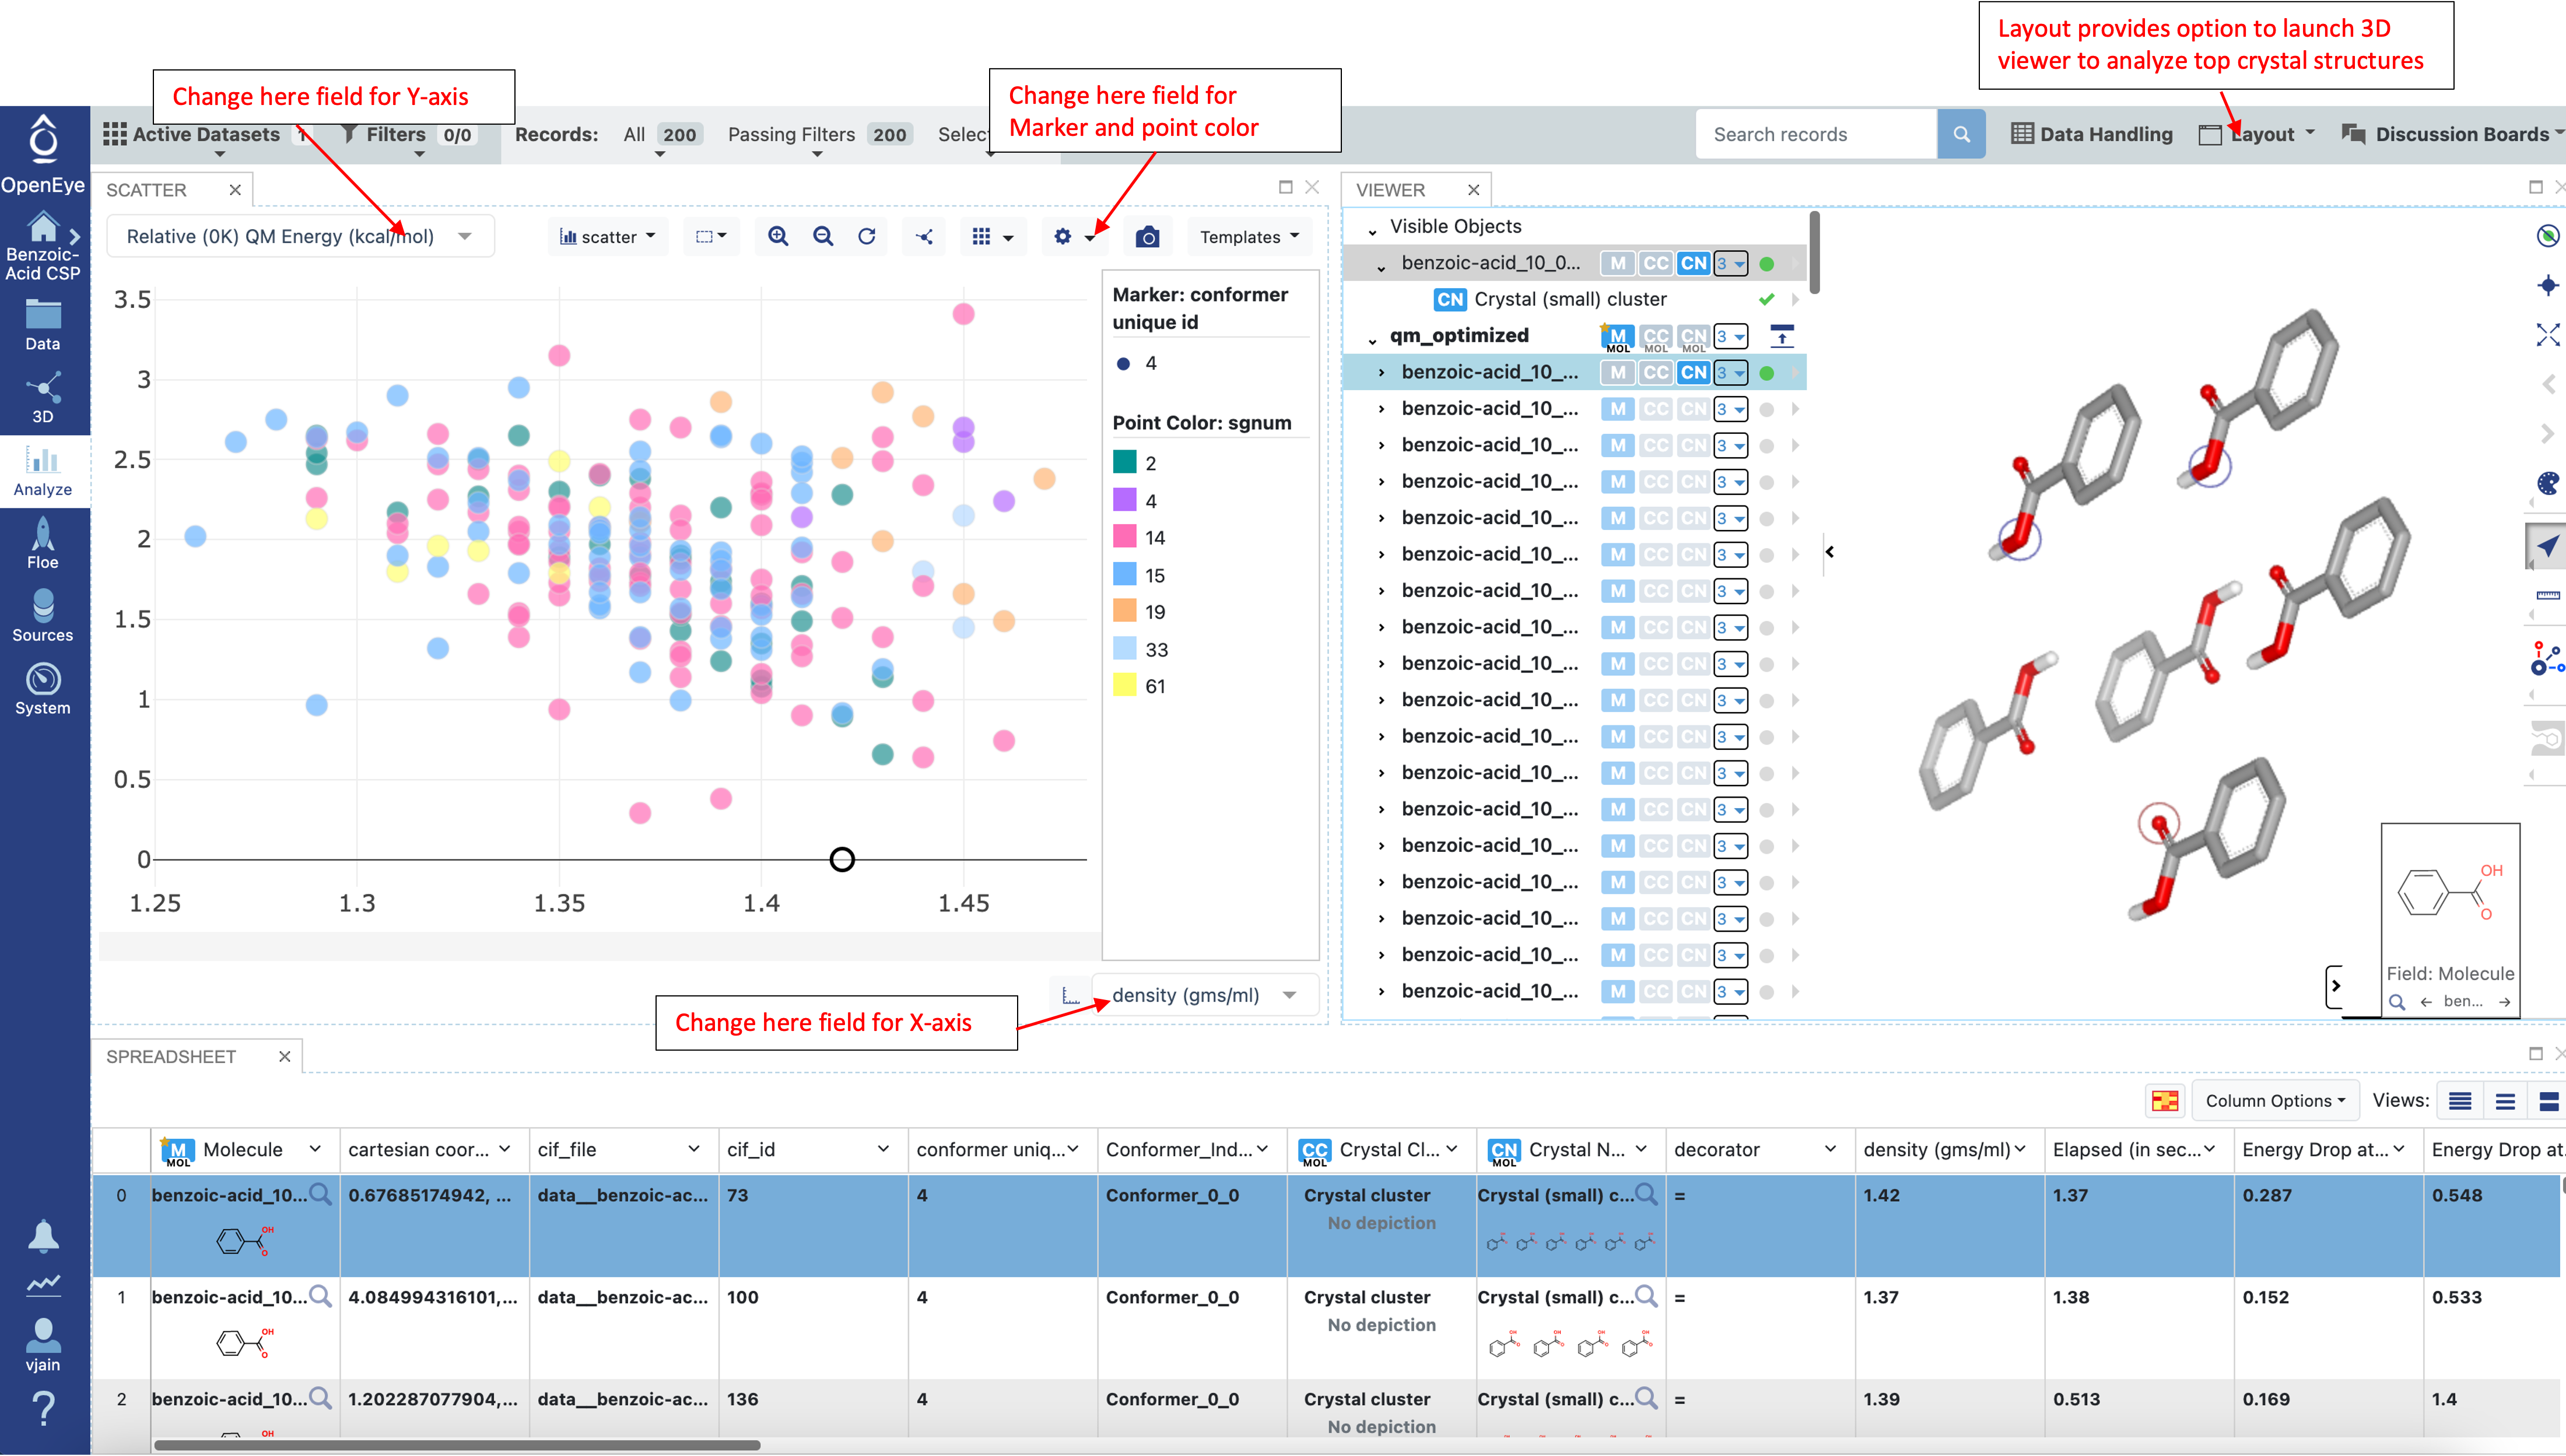
In the Analyze page, choose “Analyze with 3D” from the “Layout” drop down menu in the top right to see the scatter plot, spreadsheet, and 3D window. To mimic the plot below, choose the fields “density (gms/ml)” and “Relative IEFF Energy (kcal/mol)” for the X and Y-axis respectively. Choose a point in the scatter plot to show that record in the 3D viewer. Then select both the “benzoic-acid” and “Crystal (small) cluster” to see a snapshot of the crystal. If desired, the plot, spreadsheet, or 3D window can be closed with the x in the top right of any subsection.
At the IEFF level it is important to examine results before continuing to Part IIIA. Below is a list of things to consider:
Consider the energy landscape by comparing the Relative IEFF Energy (IEFF lattice energy + conformer strain energy) vs Density. Do the densities seem reasonable (usually greater than 1 and less than 1.5 gms/ml). Alternative, consider comparing other combinations of density, IEFF Lattice Energy (does not include conformer strain energy), or Psi4 Strain Energy (kcal/mol) (does not include lattice energy).
Look at the 3D viewer, especially for the low energy structures. Do these structures have interactions expected for this molecule, such as Hydrogen-bonding, pi-stacking or other polar interactions?
Consider the total number of packings. If there is a tight budget for Part IIIA, consider filtering structures based on energy or other criteria.
Loose Quantum Optimization of Crystal Structures (Part IIIA of CSP Protocol)
The first step in Part IIIA is to run the Loose Quantum Optimization of Crystal Structures (Part IIIA of CSP Protocol)
Floe. In this step, the top IEFF crystal structures are loosely optimized using a low level of theory (HF-3c by default) and only a small number of optimization steps. The loose QM optimizations allow more packings from Part II to be QM optimized before re-filtering and performing the more expensive tight QM optimization calculation.
The cost of running this Floe is around $652, which accounts for optimizing all structures from Part II. A Cost Saving Option is to reduce the number of structures optimized. The cost of optimizing 10 structures will be around $9.00. The Crystal RMSD Floe can be run to make sure this subset includes a packing close to the experimental structure. Alternatively, skip to the Analyze CSP Part IIIA Loose Optimization Results section below to analyze the provided output.
Run CSP Part IIIA Loose Optimization
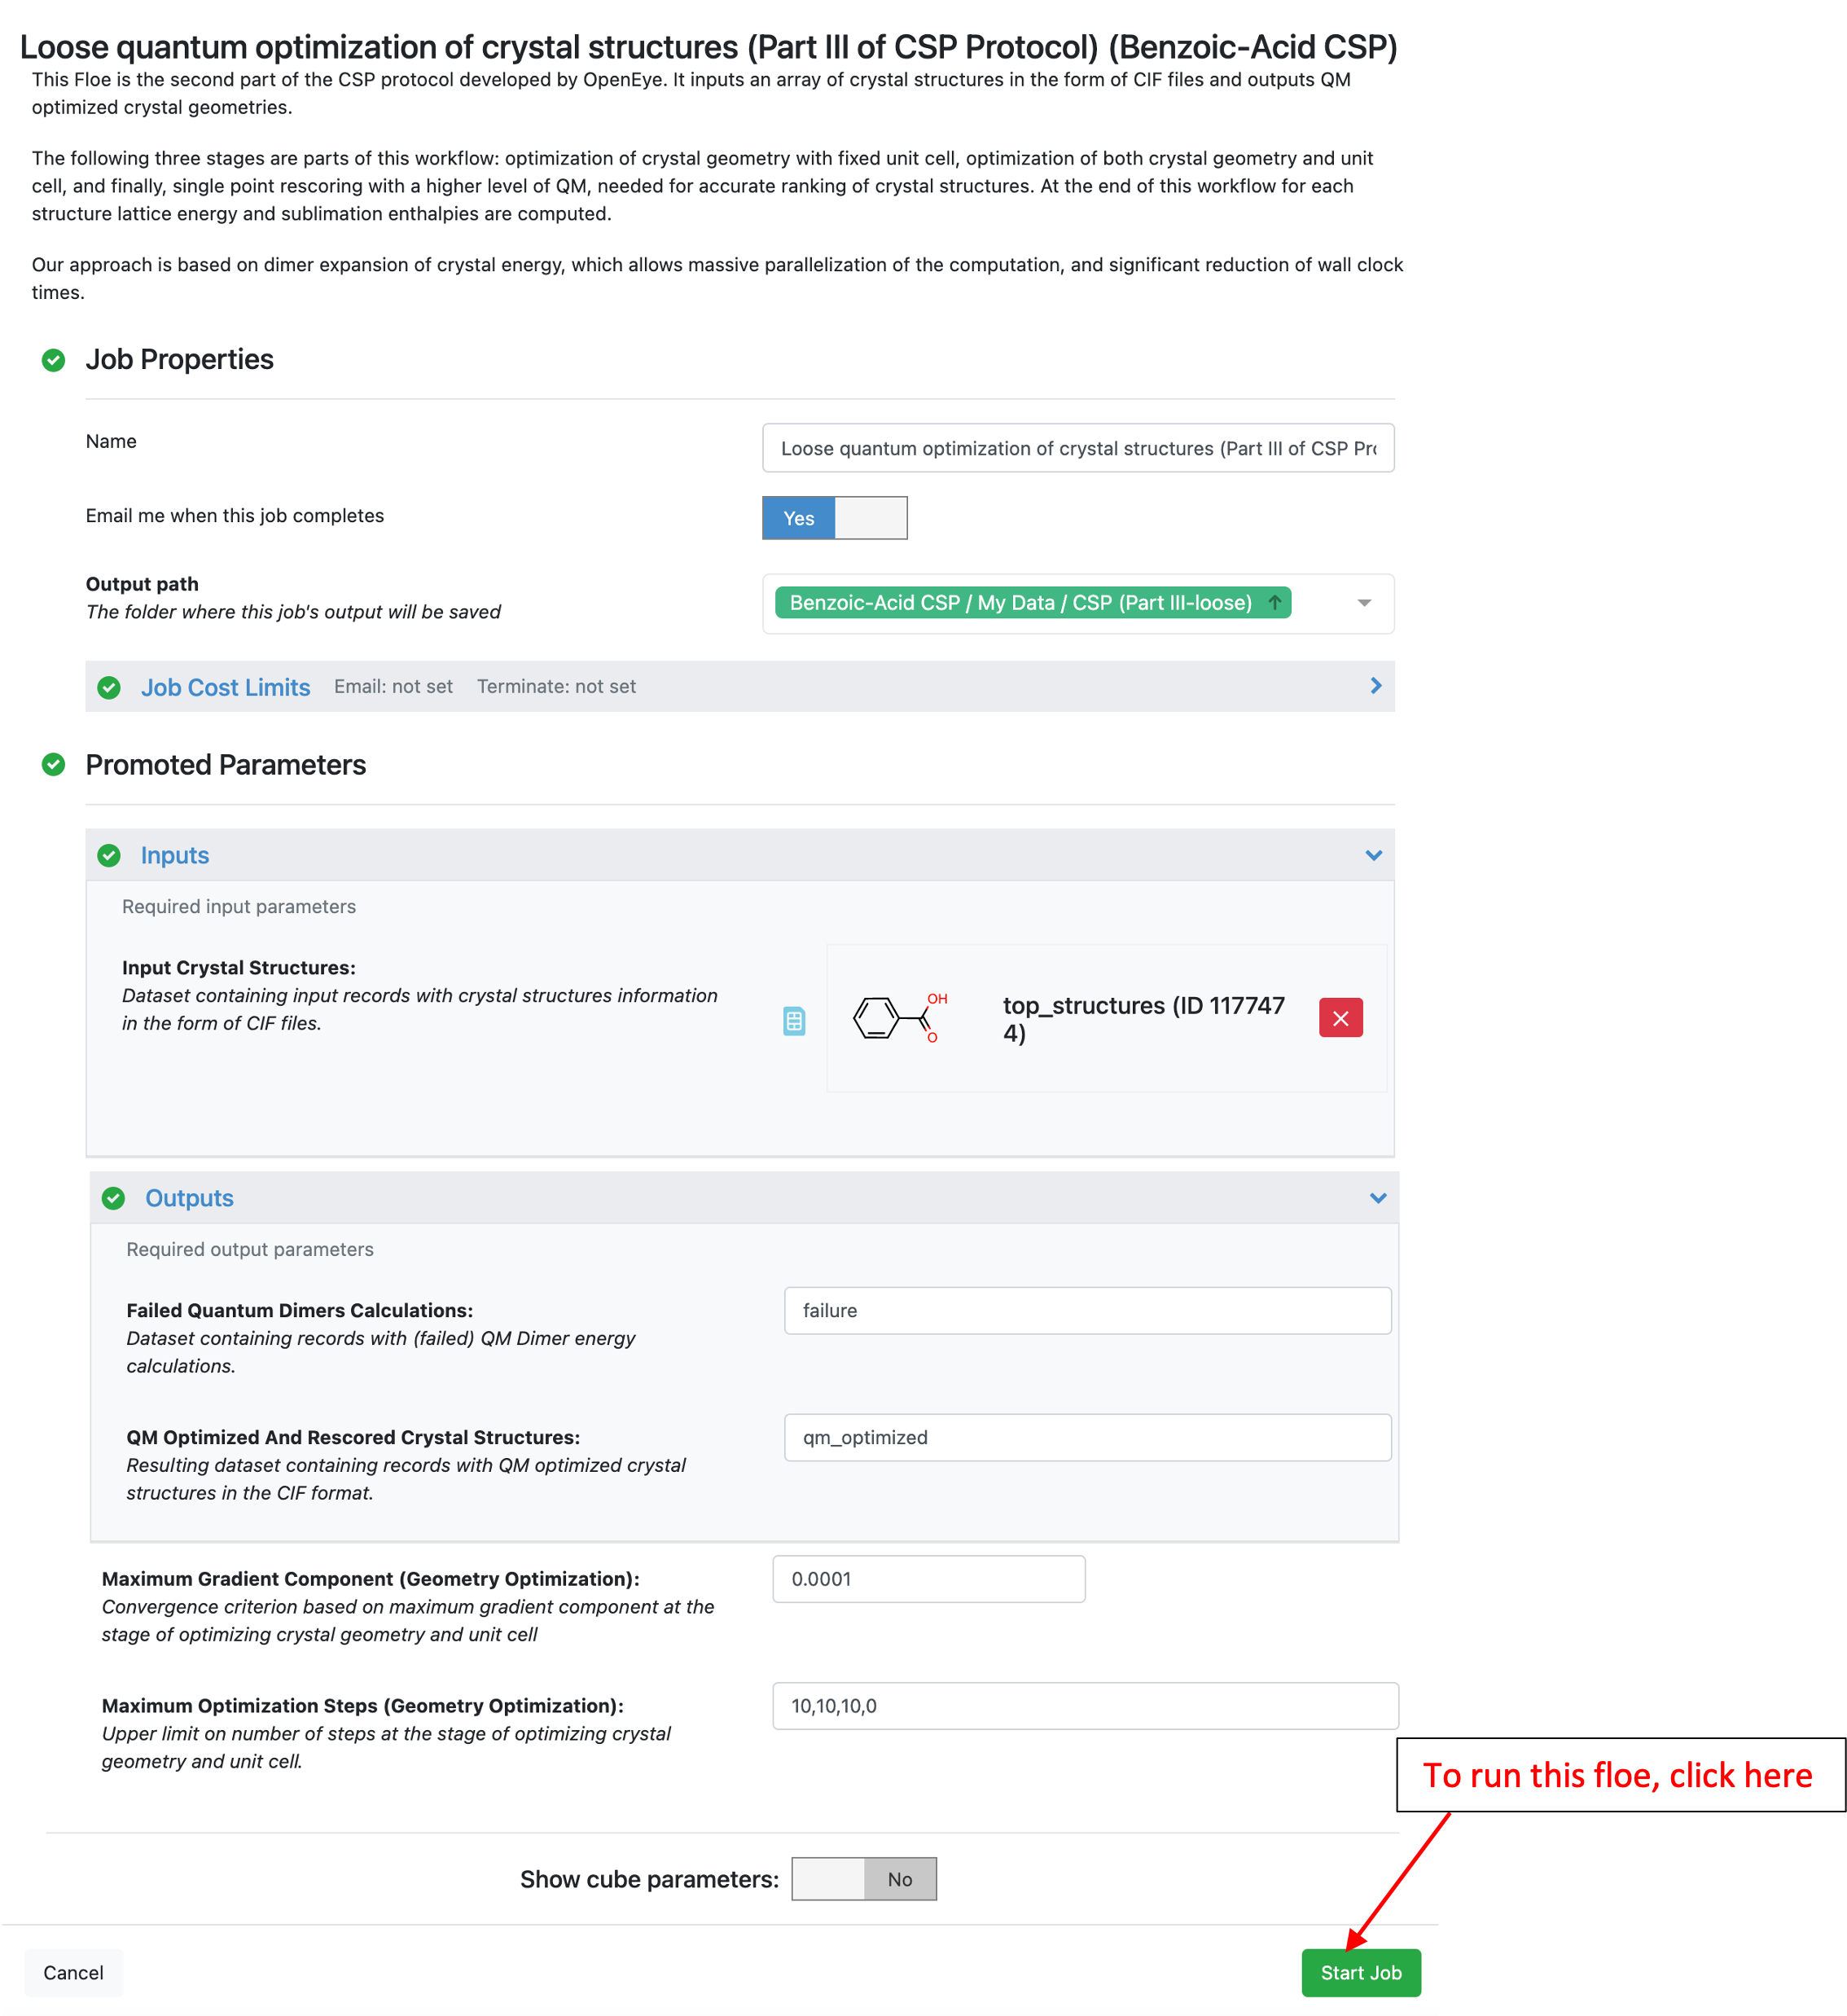
To run the loose optimization Floe search for “loose” or the full title in the Product-based / Crystal Structure Prediction category path.
This Floe uses OpenEye’s dimer expansion approach to loosely optimize the crystal structures. By default, this Floe uses HF-3c for optimizing crystal geometries with unit cell parameters and the energy of the final crystal structures are reported at the same level of theory. By default, 10 optimization steps are performed.
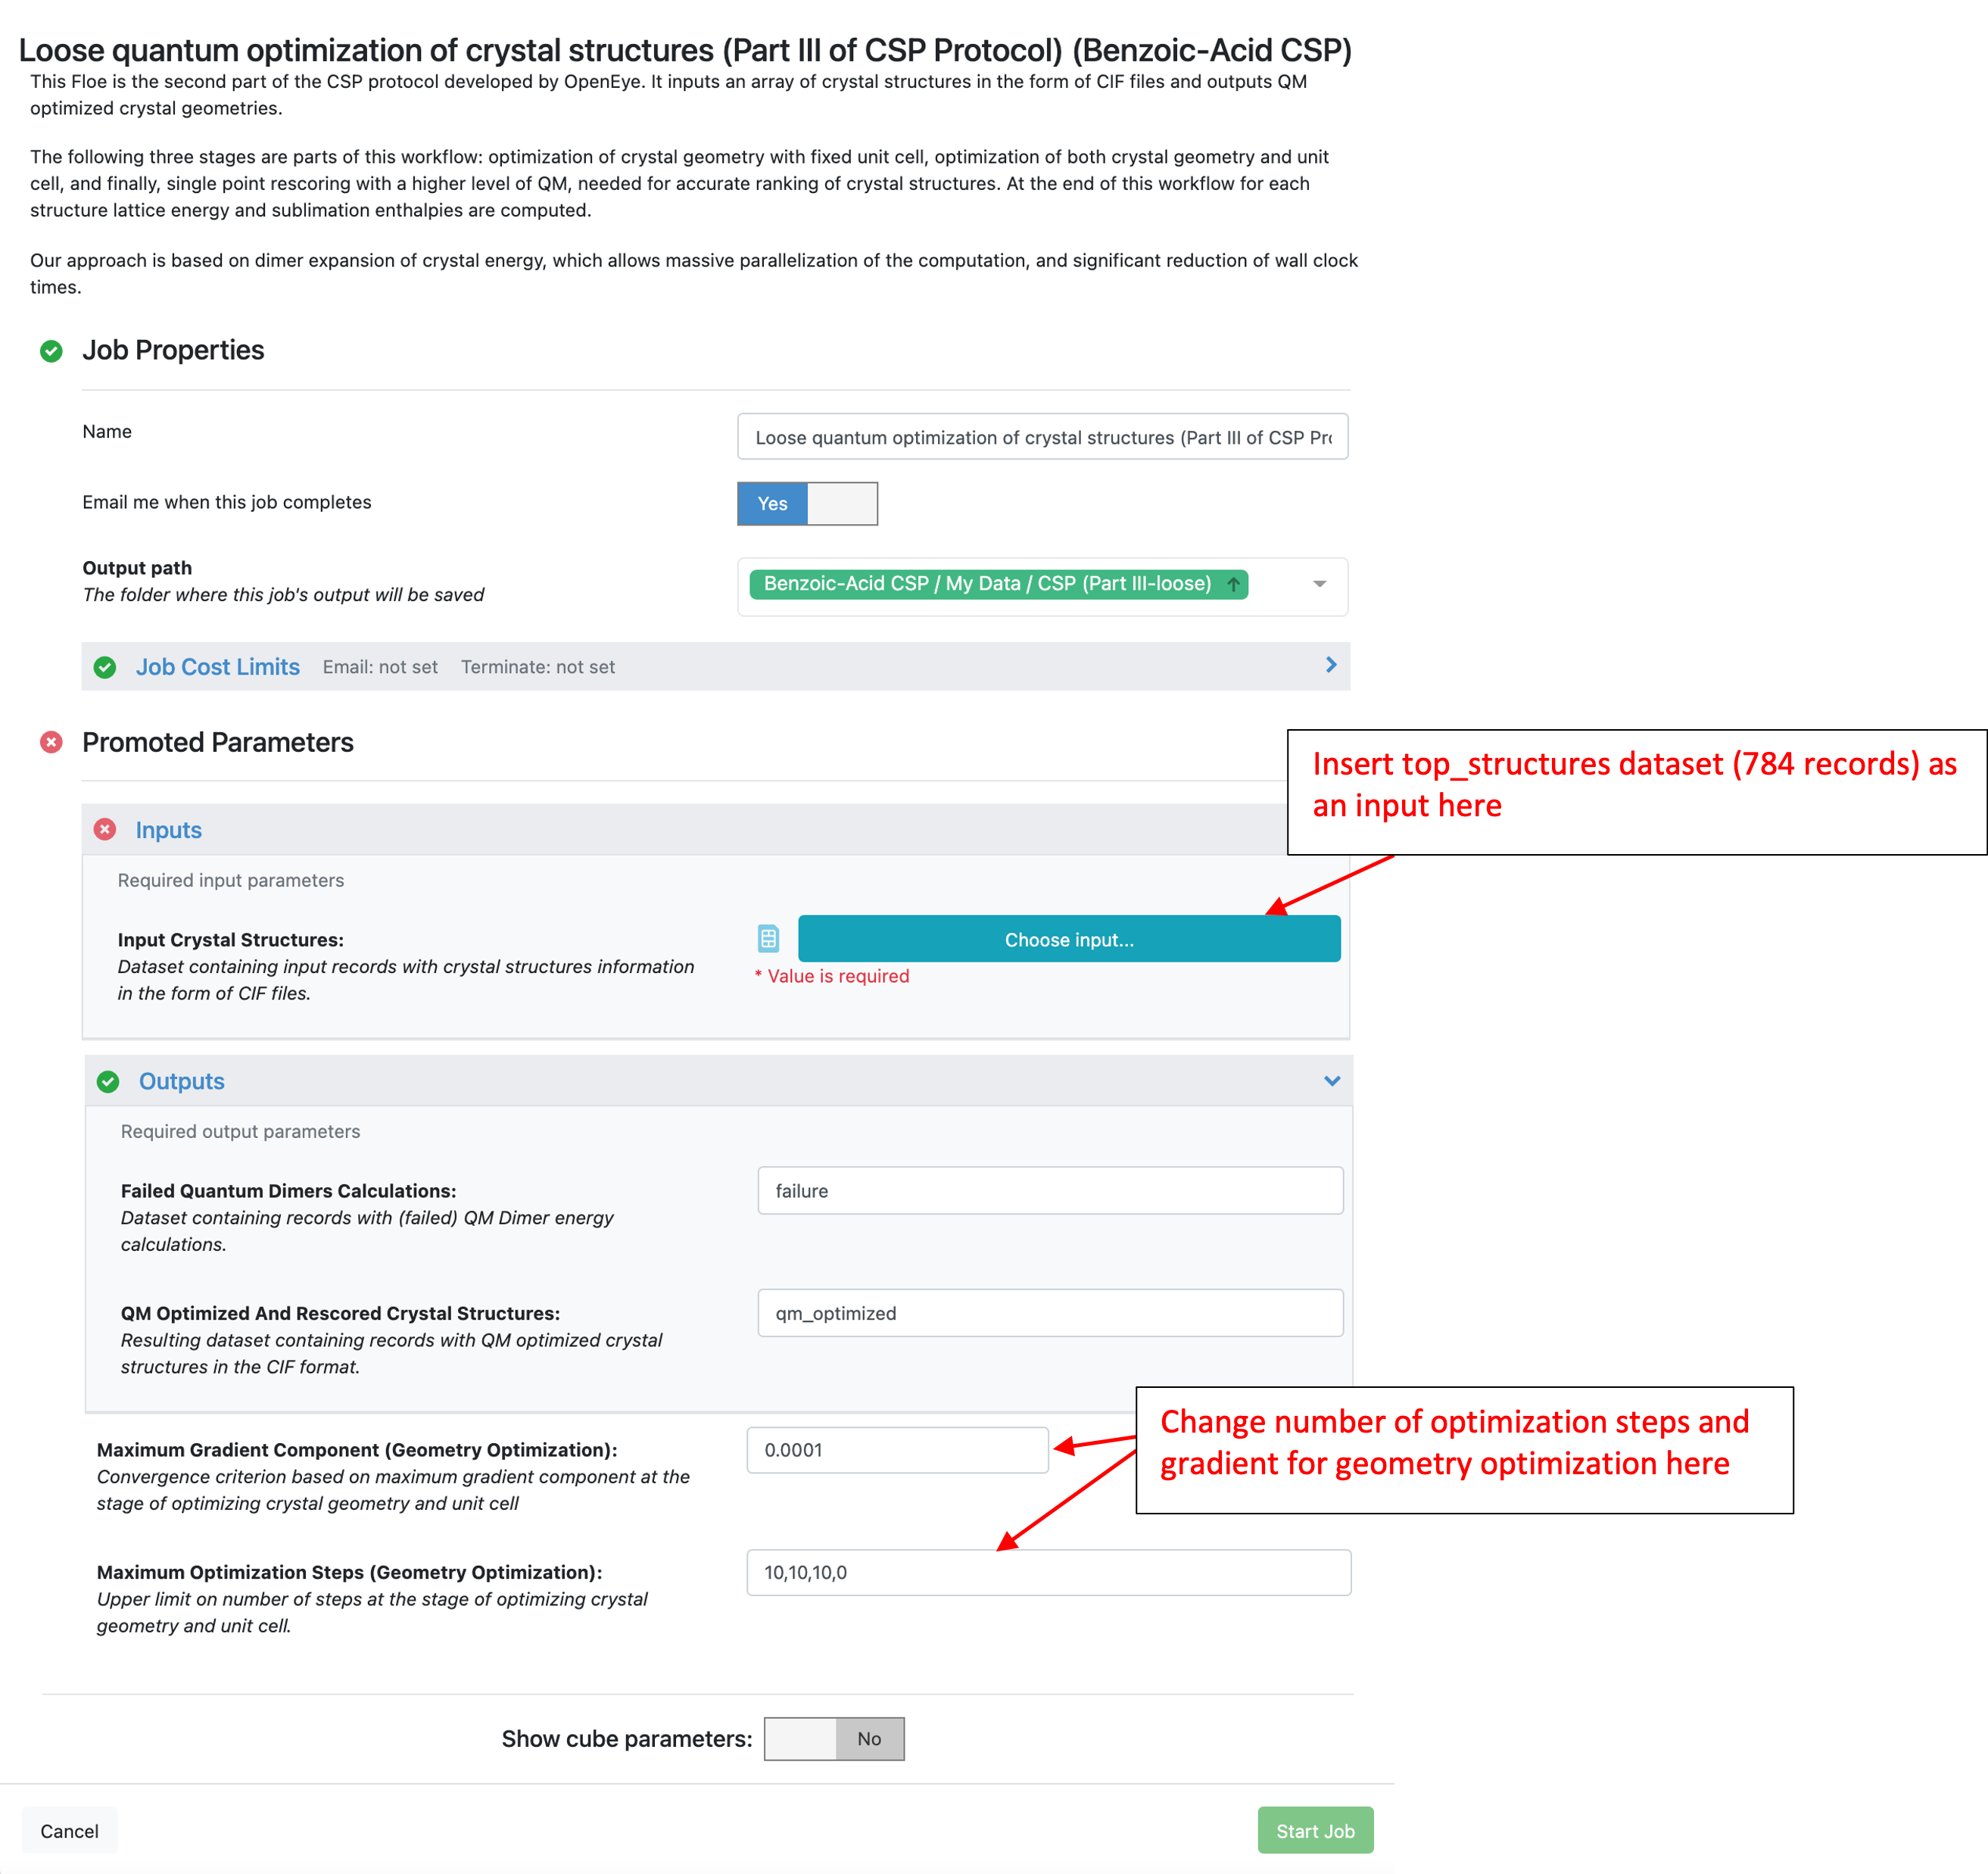
This Floe requires Orion dataset with crystal structures saved as a CIF file on the record. Any crystal structure dataset on Orion should meet this requirement, including those created with the Part II CSP Floe or from parsing a CIF file. In this tutorial, the “top_structures” dataset created with the IEFF Floe above will be used as input.
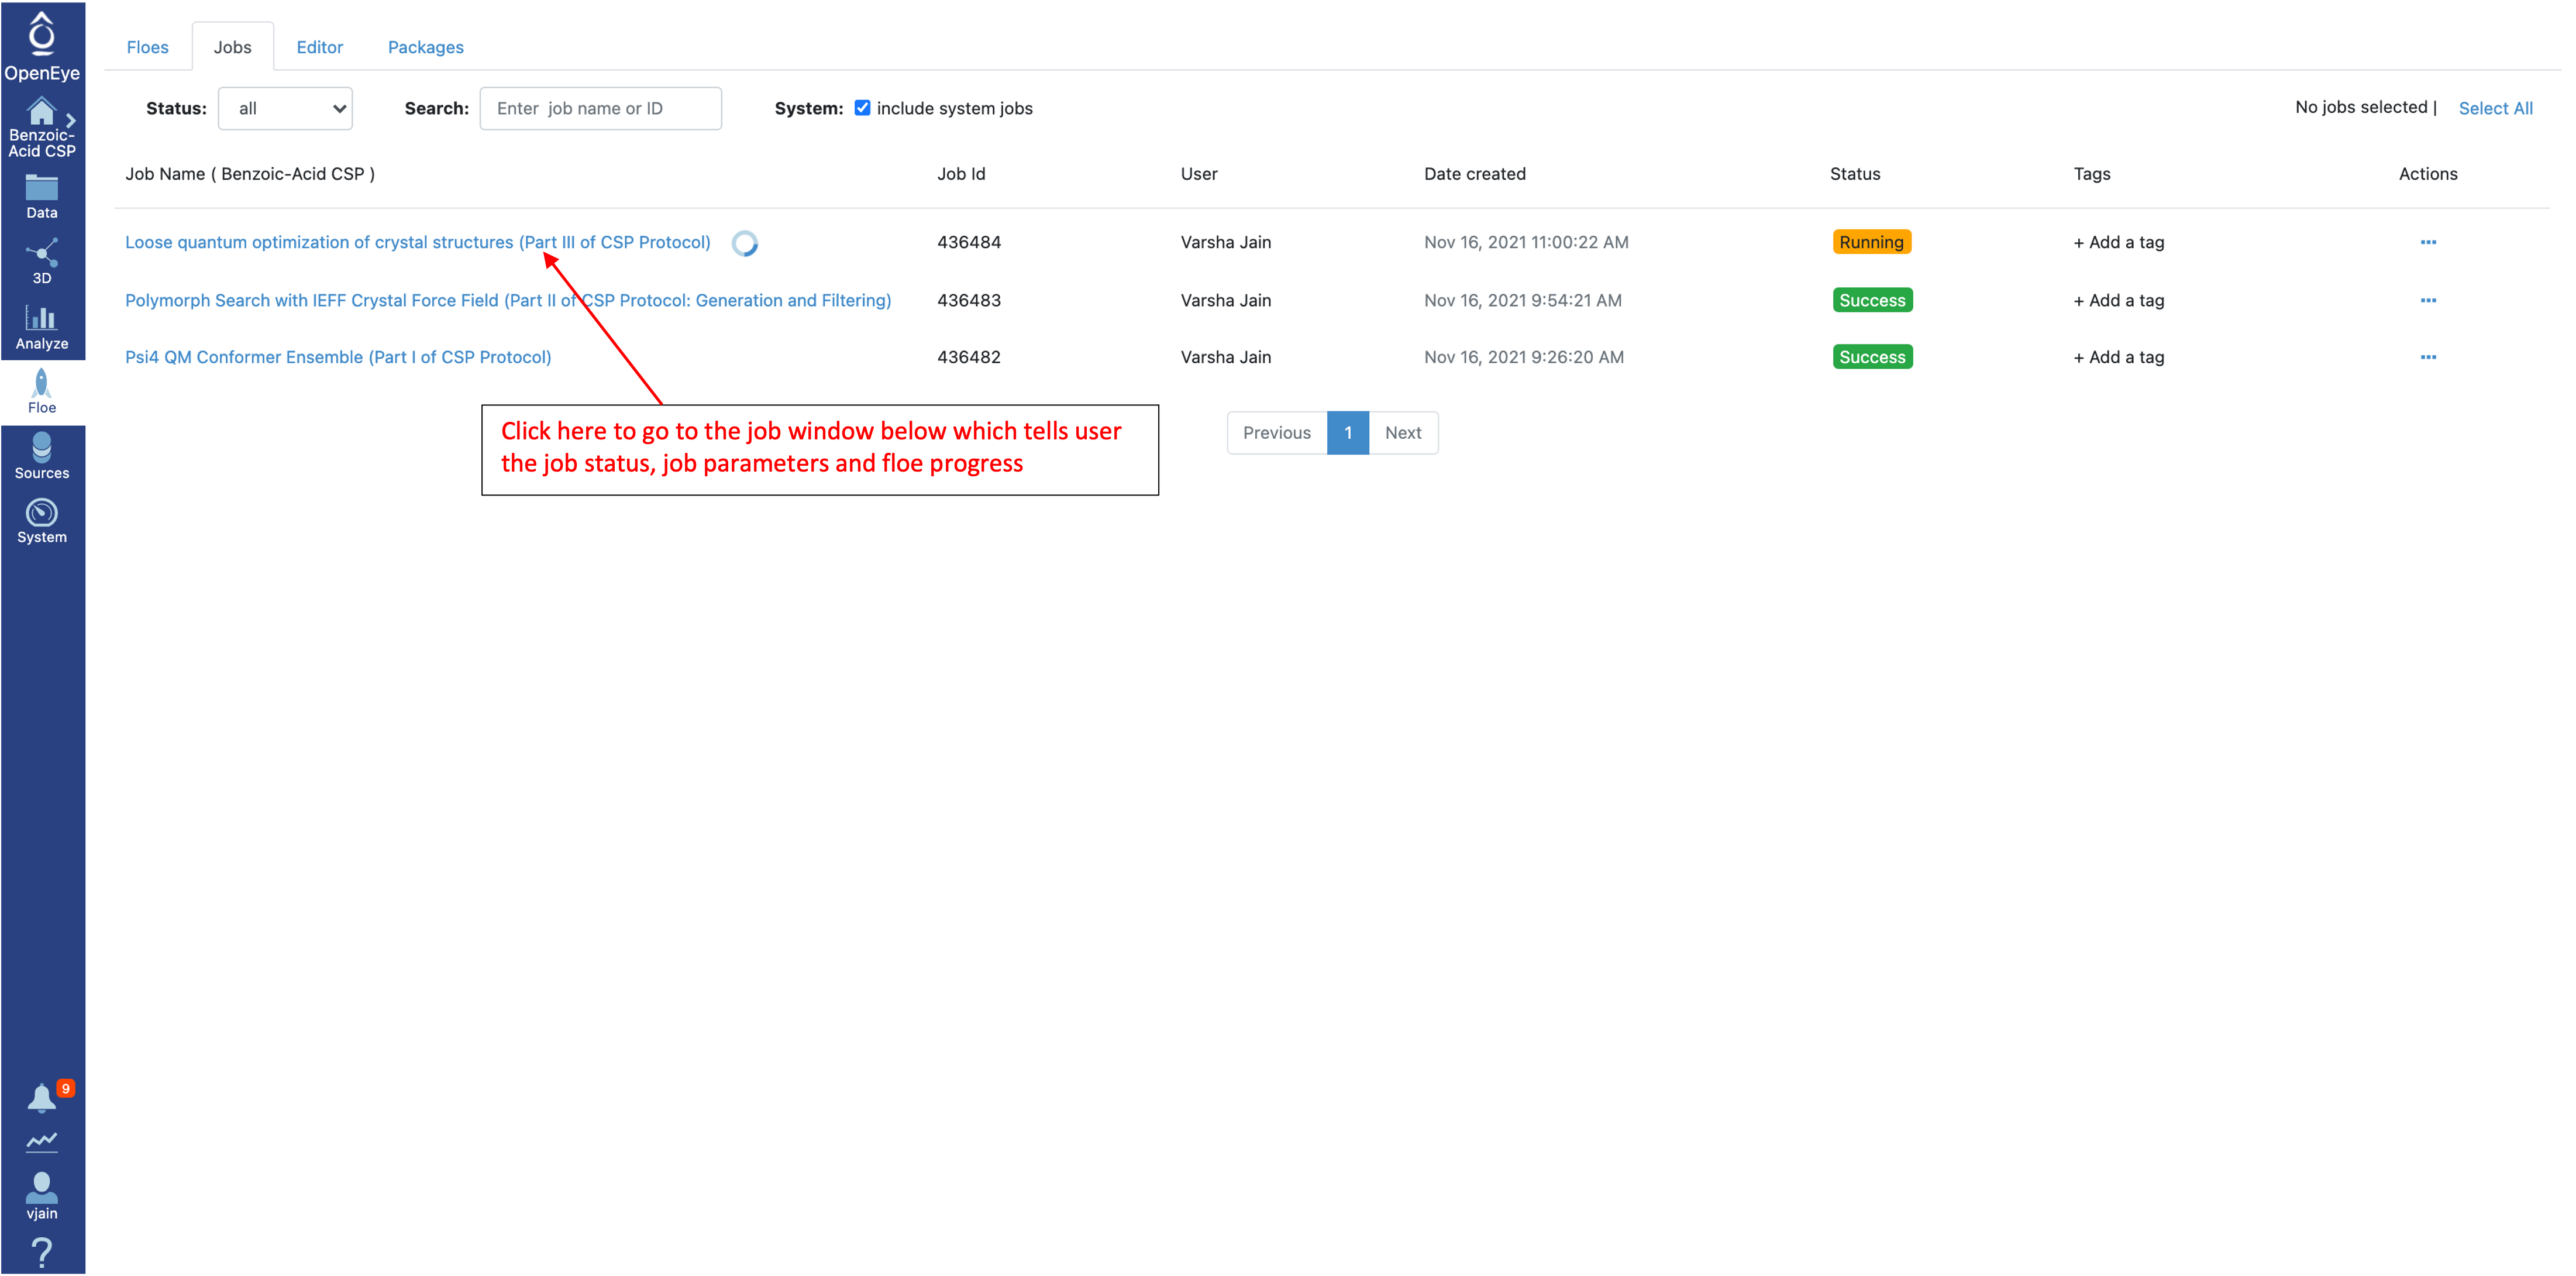
Just like previous Floes, the job status page tracks cost, wall clock time, and job progress as shown below.
Once the job has finished, the results will be visible at the top of the job status page Click on “Show in Project Data” or navigate directly to the Data page to access these datasets and analyze them further. Just like the IEFF packing Floe in Part II, there are two Floe reports (failure report and Orion QM dimers optimization Floe report). These reports can be viewed from the job status page.
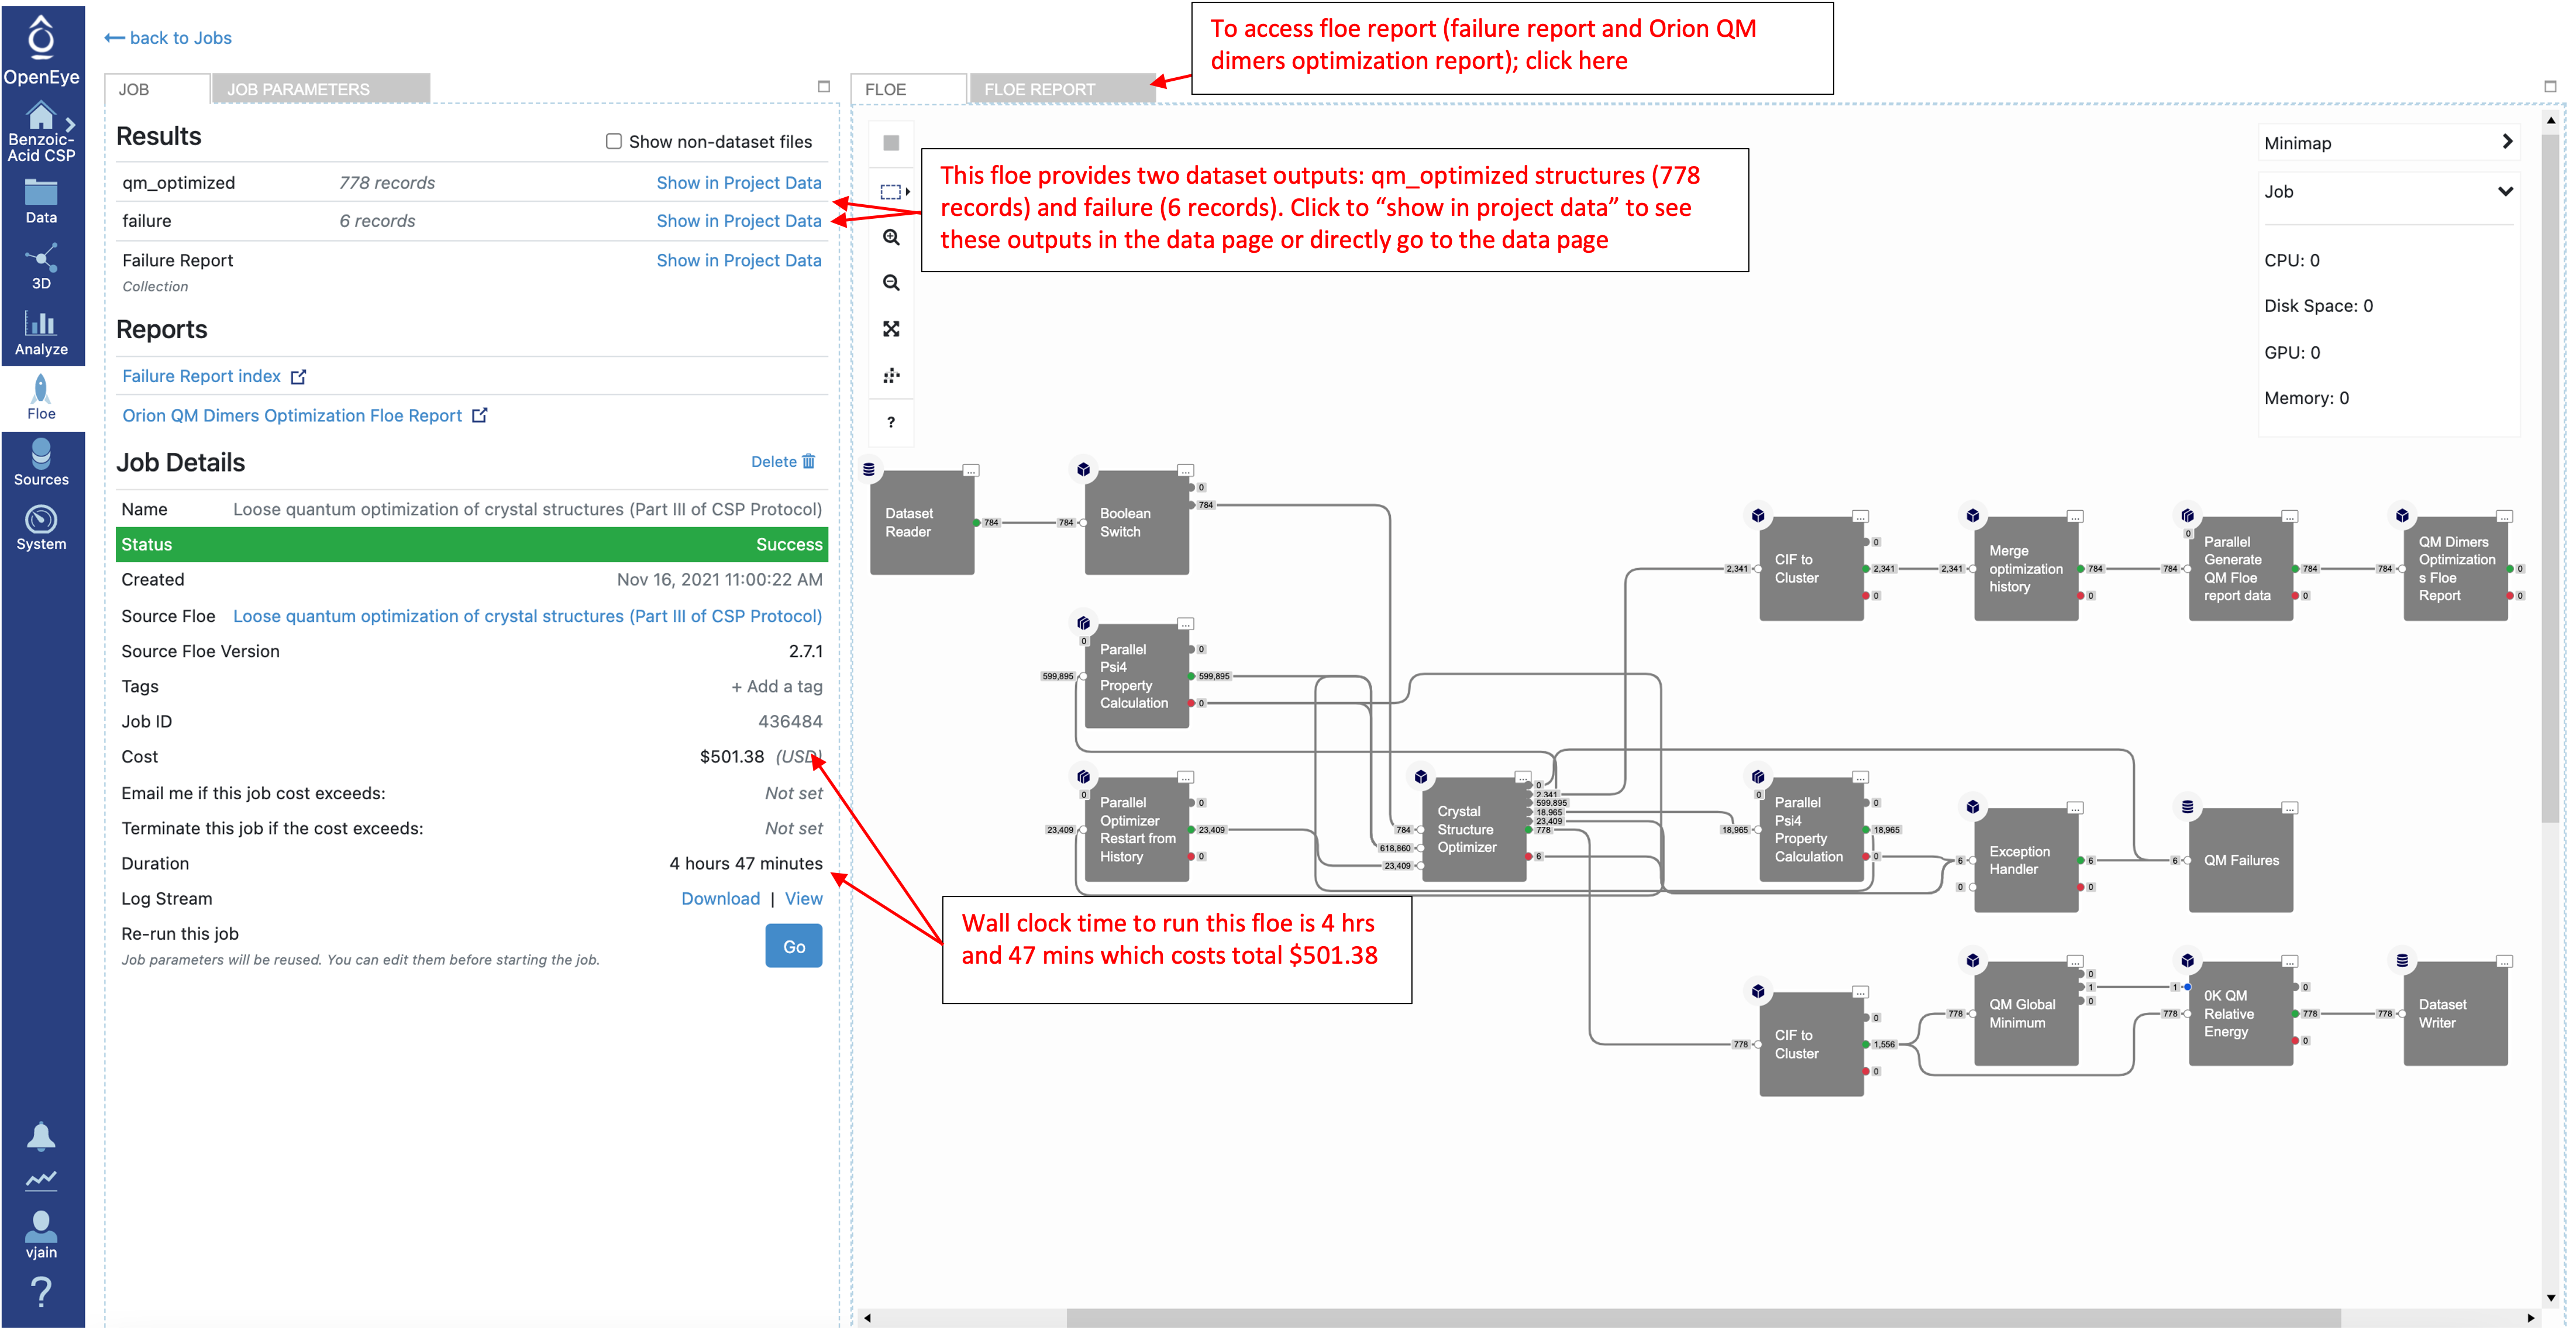
This Floe generates 778 structures saved in the qm_optimized dataset. There is also a failures dataset which usually includes failed gradient calculations on intermediate dimers, but these should not, in general, affect the overall results.

Analyze CSP Part IIIA Loose Optimization Results
To locate example output for this Floe navigate to the “Loose quantum optimization of crystal structures (Part IIIA of CSP Protocol)” folder in the Crystal Math Floes tutorial data (for details about Tutorial Data on Orion).
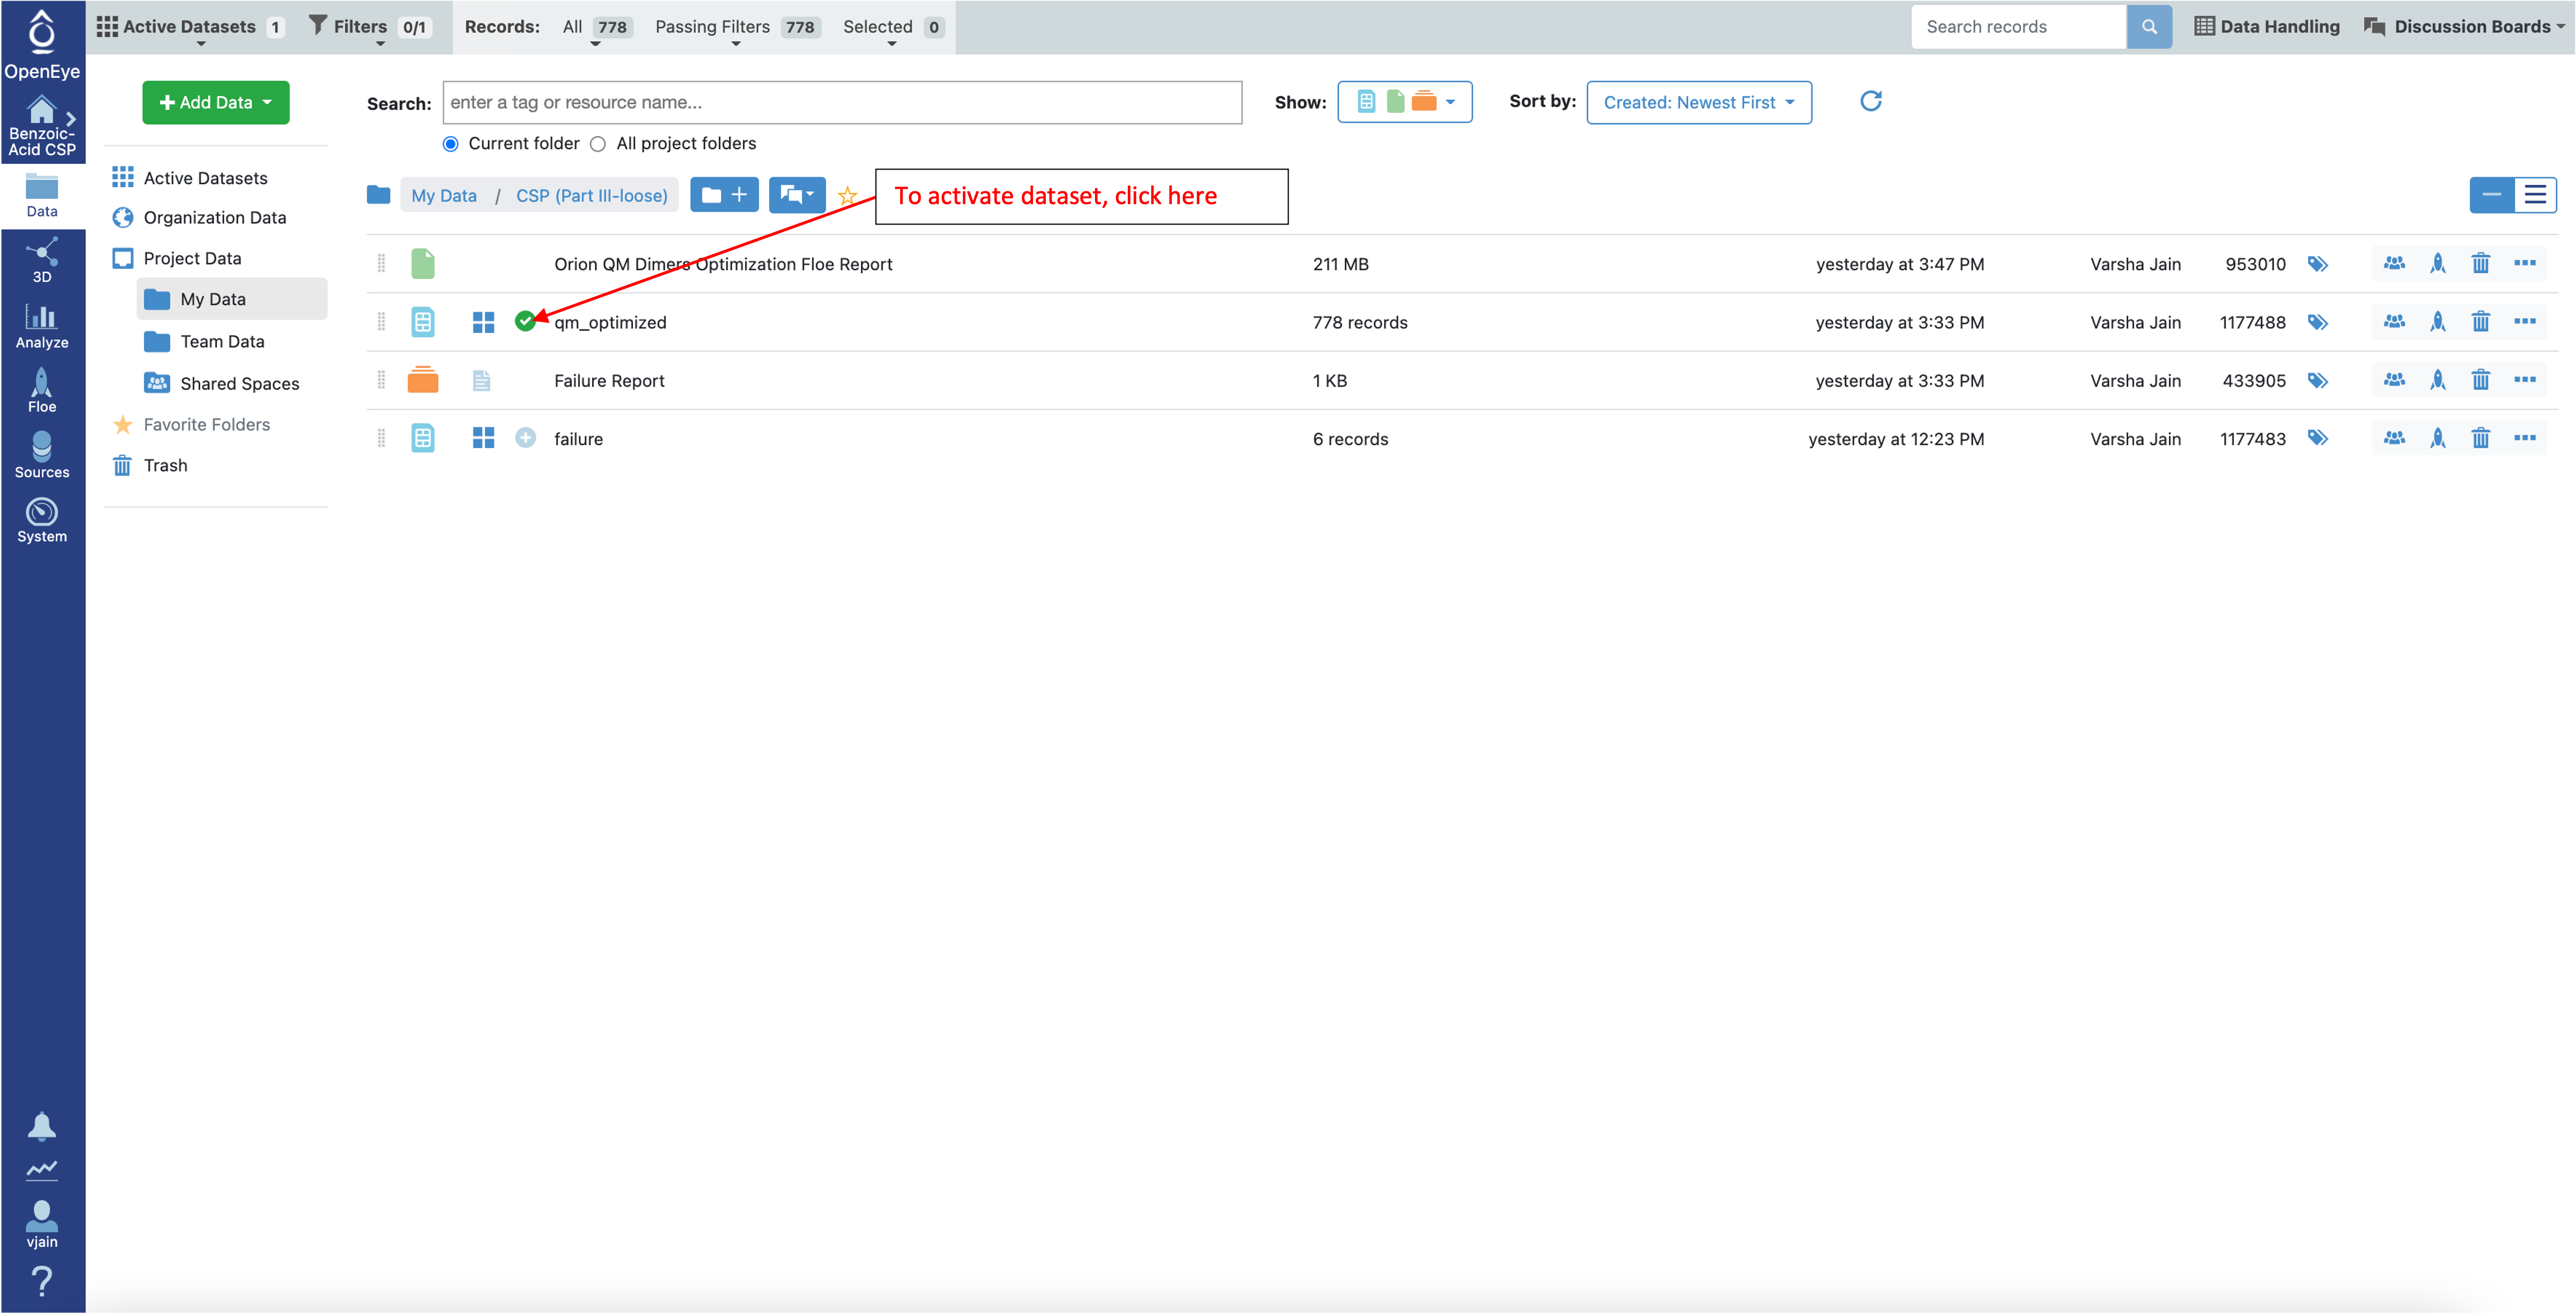
To investigate these loose QM optimized structures in the Analyze page and 3D viewer, make the qm_optimized dataset active:
Navigate to the Analyze page and plot “density (gms/ml)” vs “Relative (0K) QM Energy (kcal/mol)” as shown below:
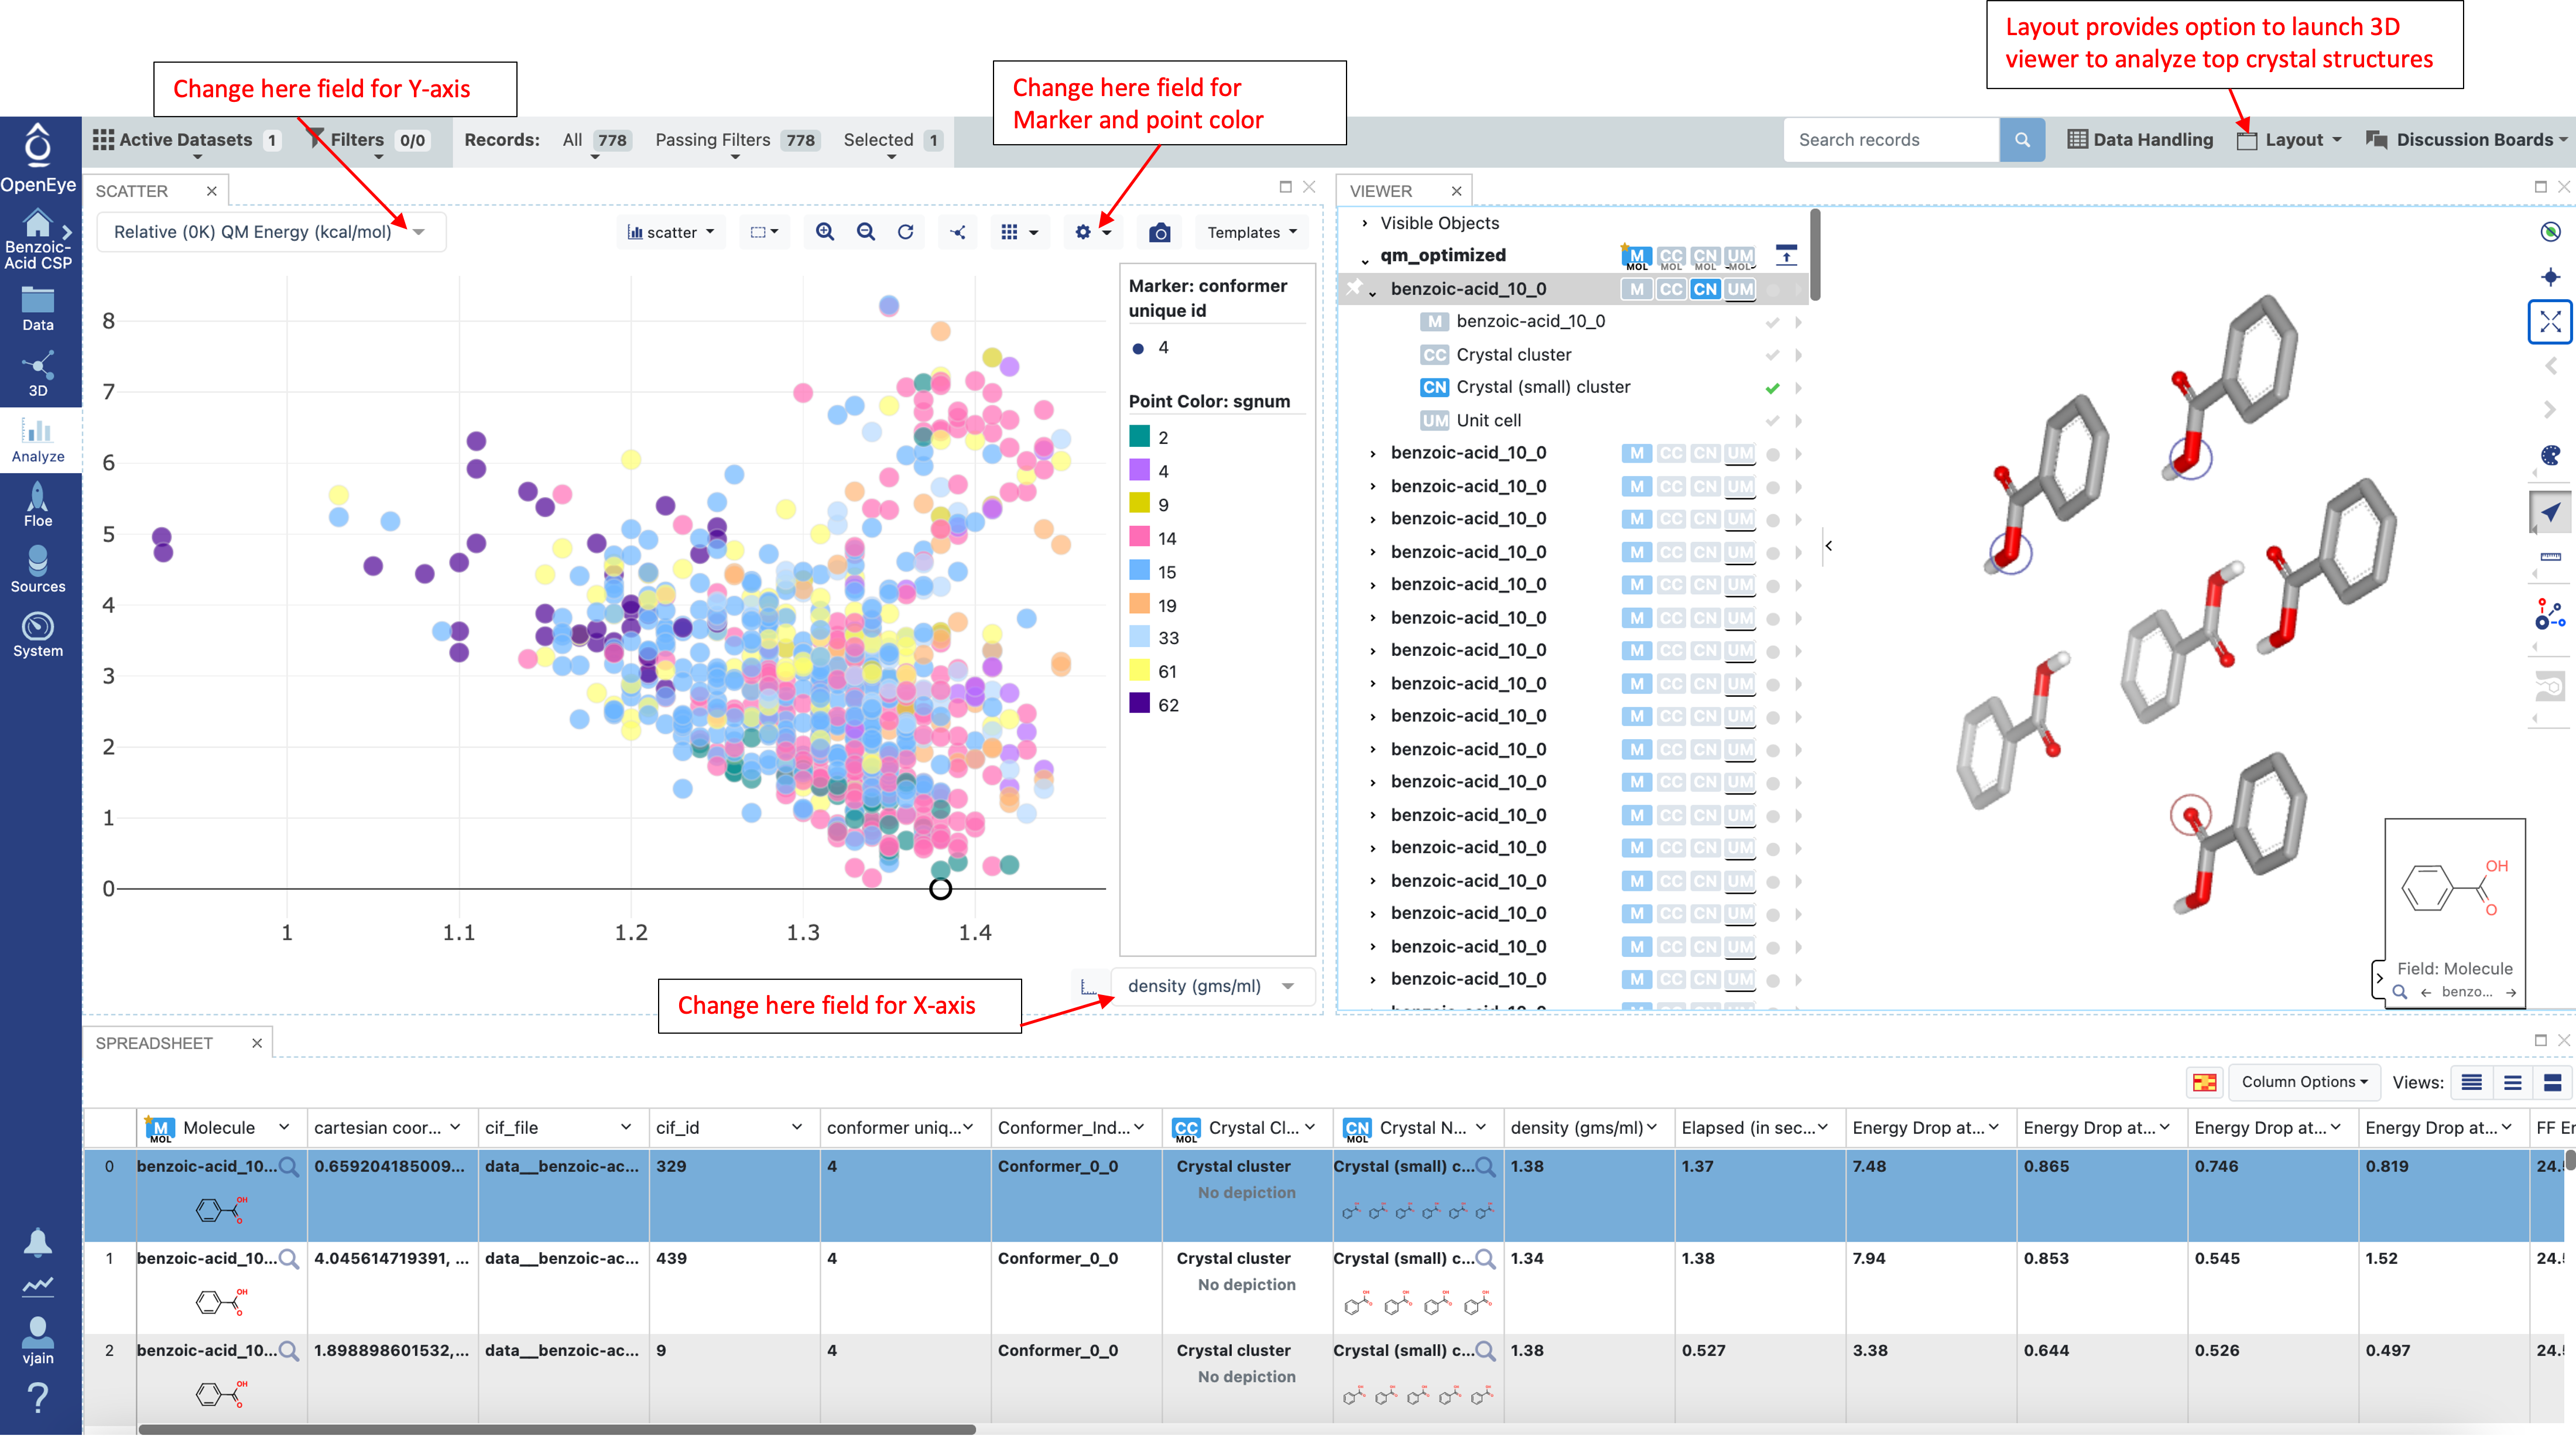
The tight optimizations in the next step can be very expensive, thus it is recommended that the structures from loose optimizations are filtered before proceeding. The “relative (0K) QM energy” field can be used to filter structures base on energy. The expected error between loose and tight optimizations is around 1-1.5 kcal/mol (depending on the molecule). During a blind prediction, structures would typically be taken from 4-5 kcal/mol at this stage. However for the tutorial a 2 kcal/mol filter is used to limit the number of tight QM optimizations that need to be performed and reduce the cost. Once the desired energy window is applied, save the filtered structures as a new dataset.
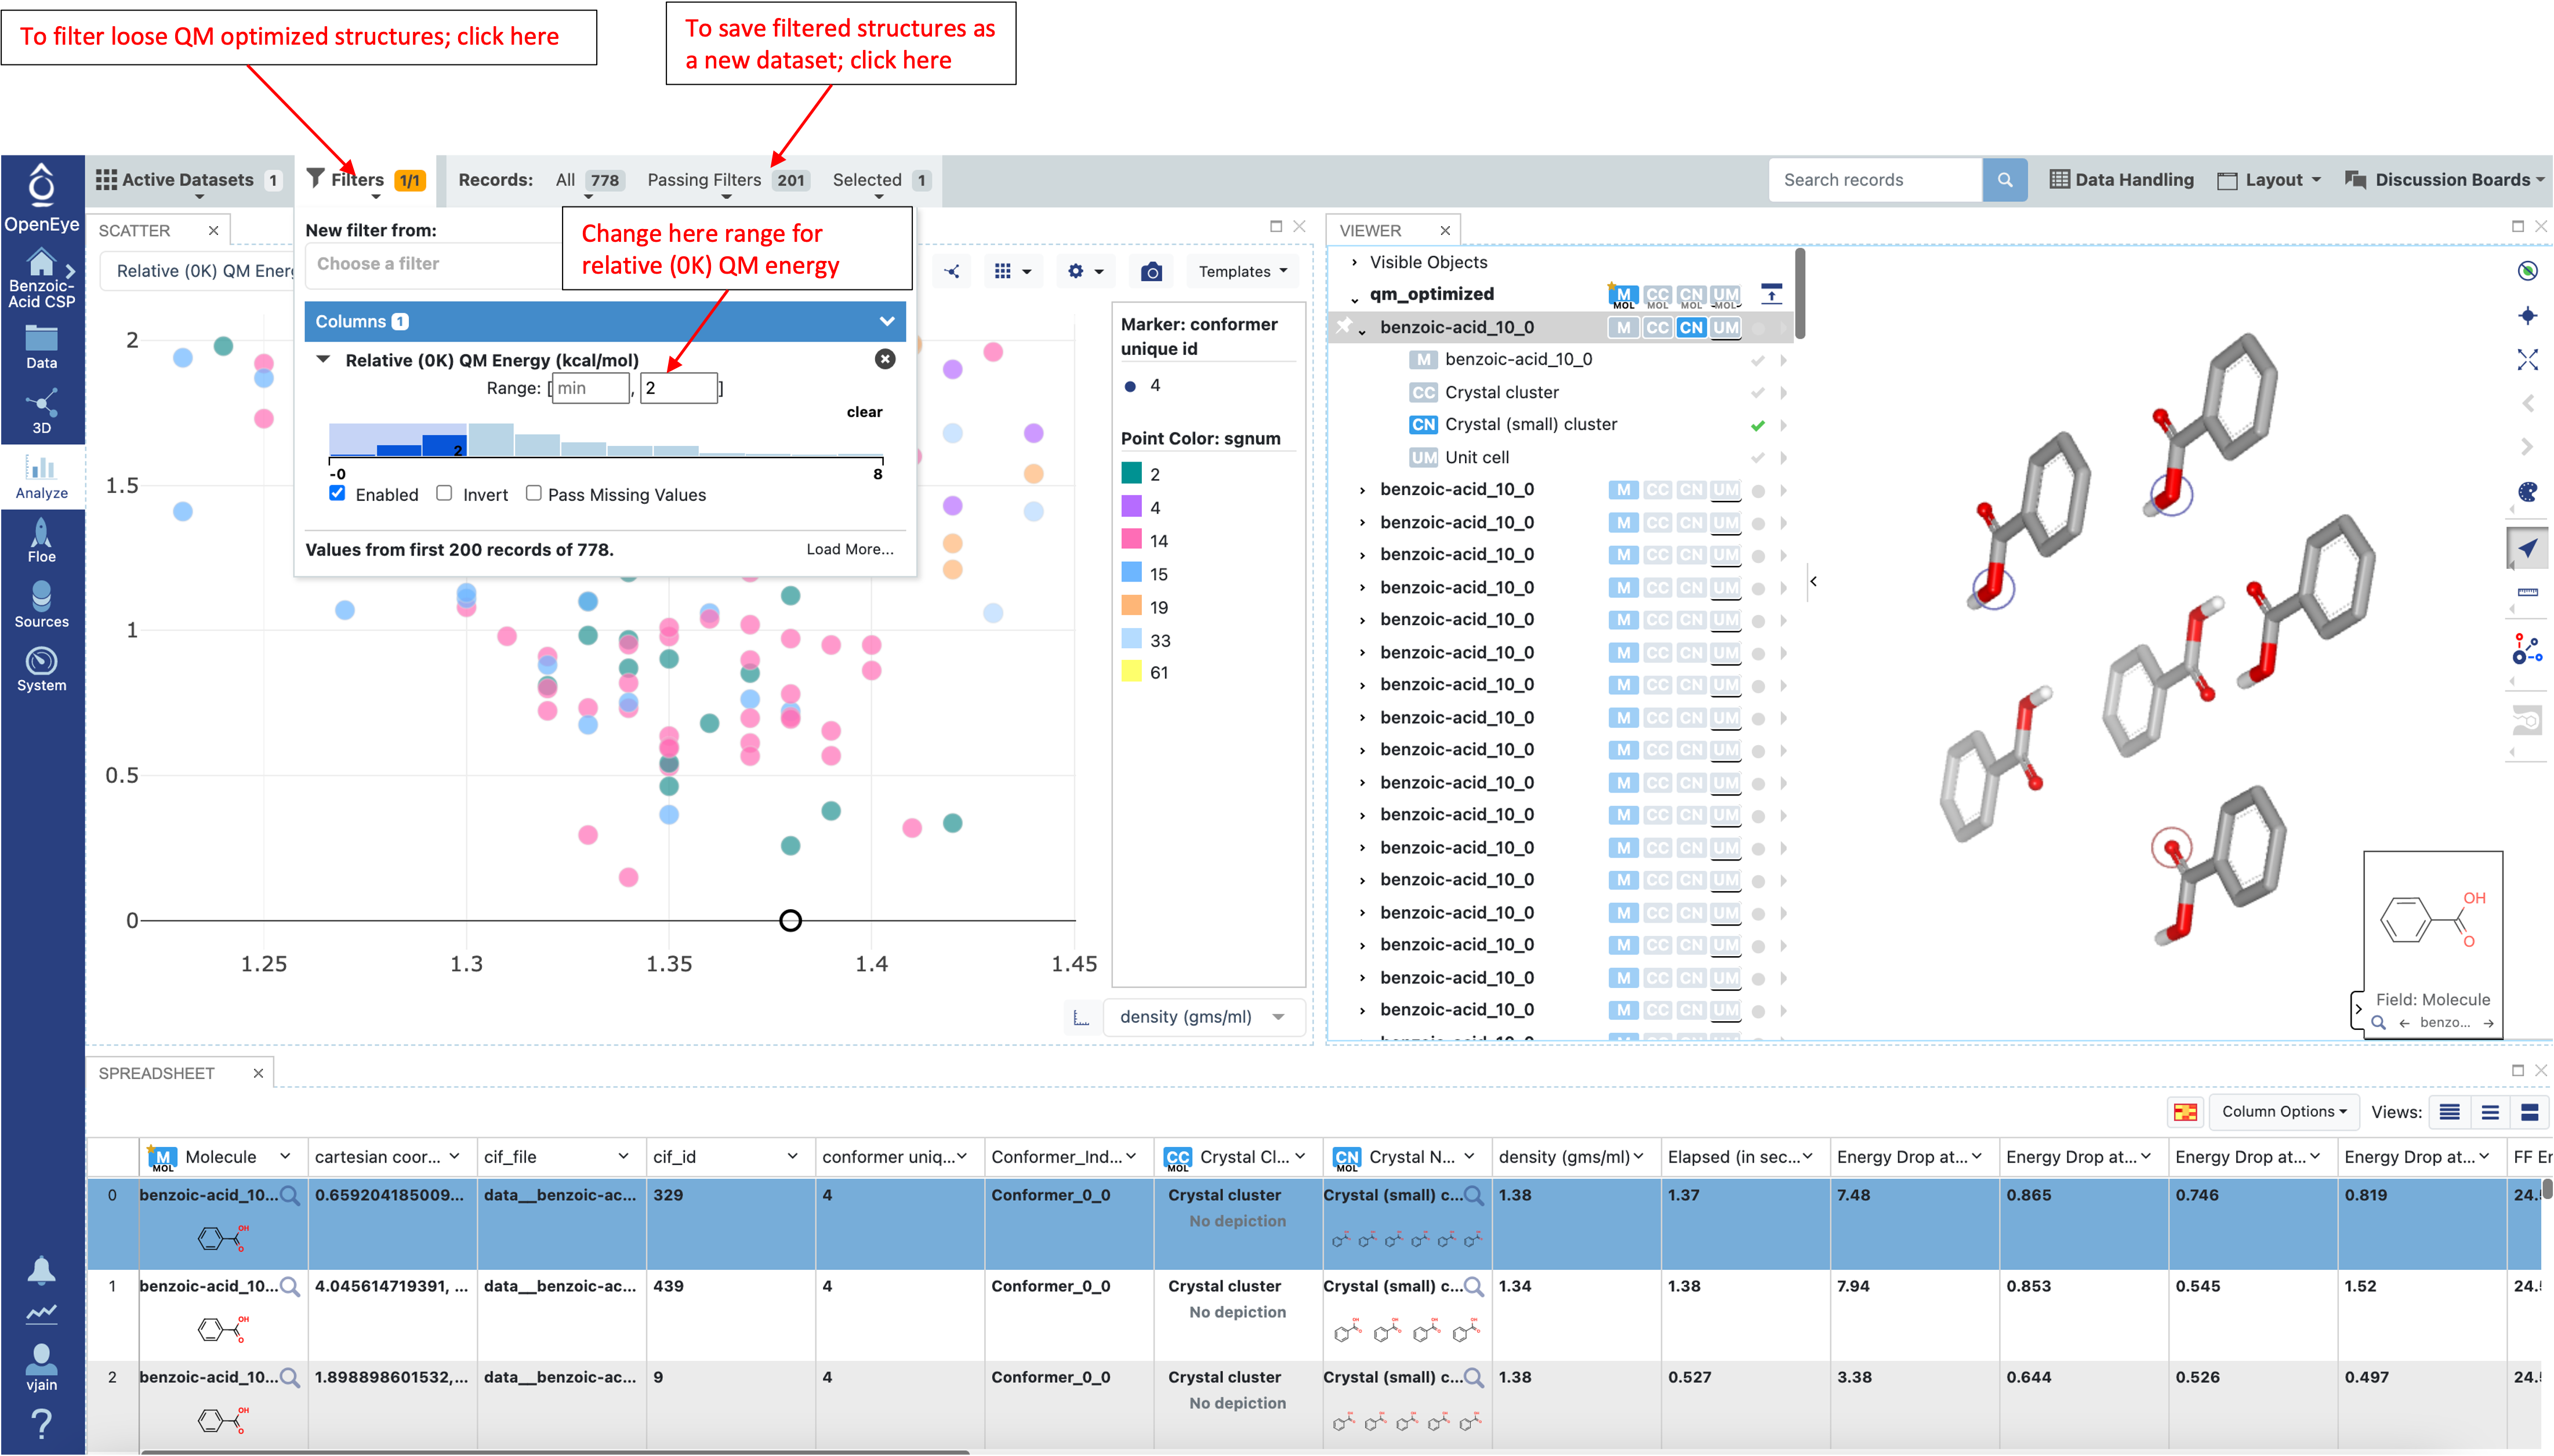
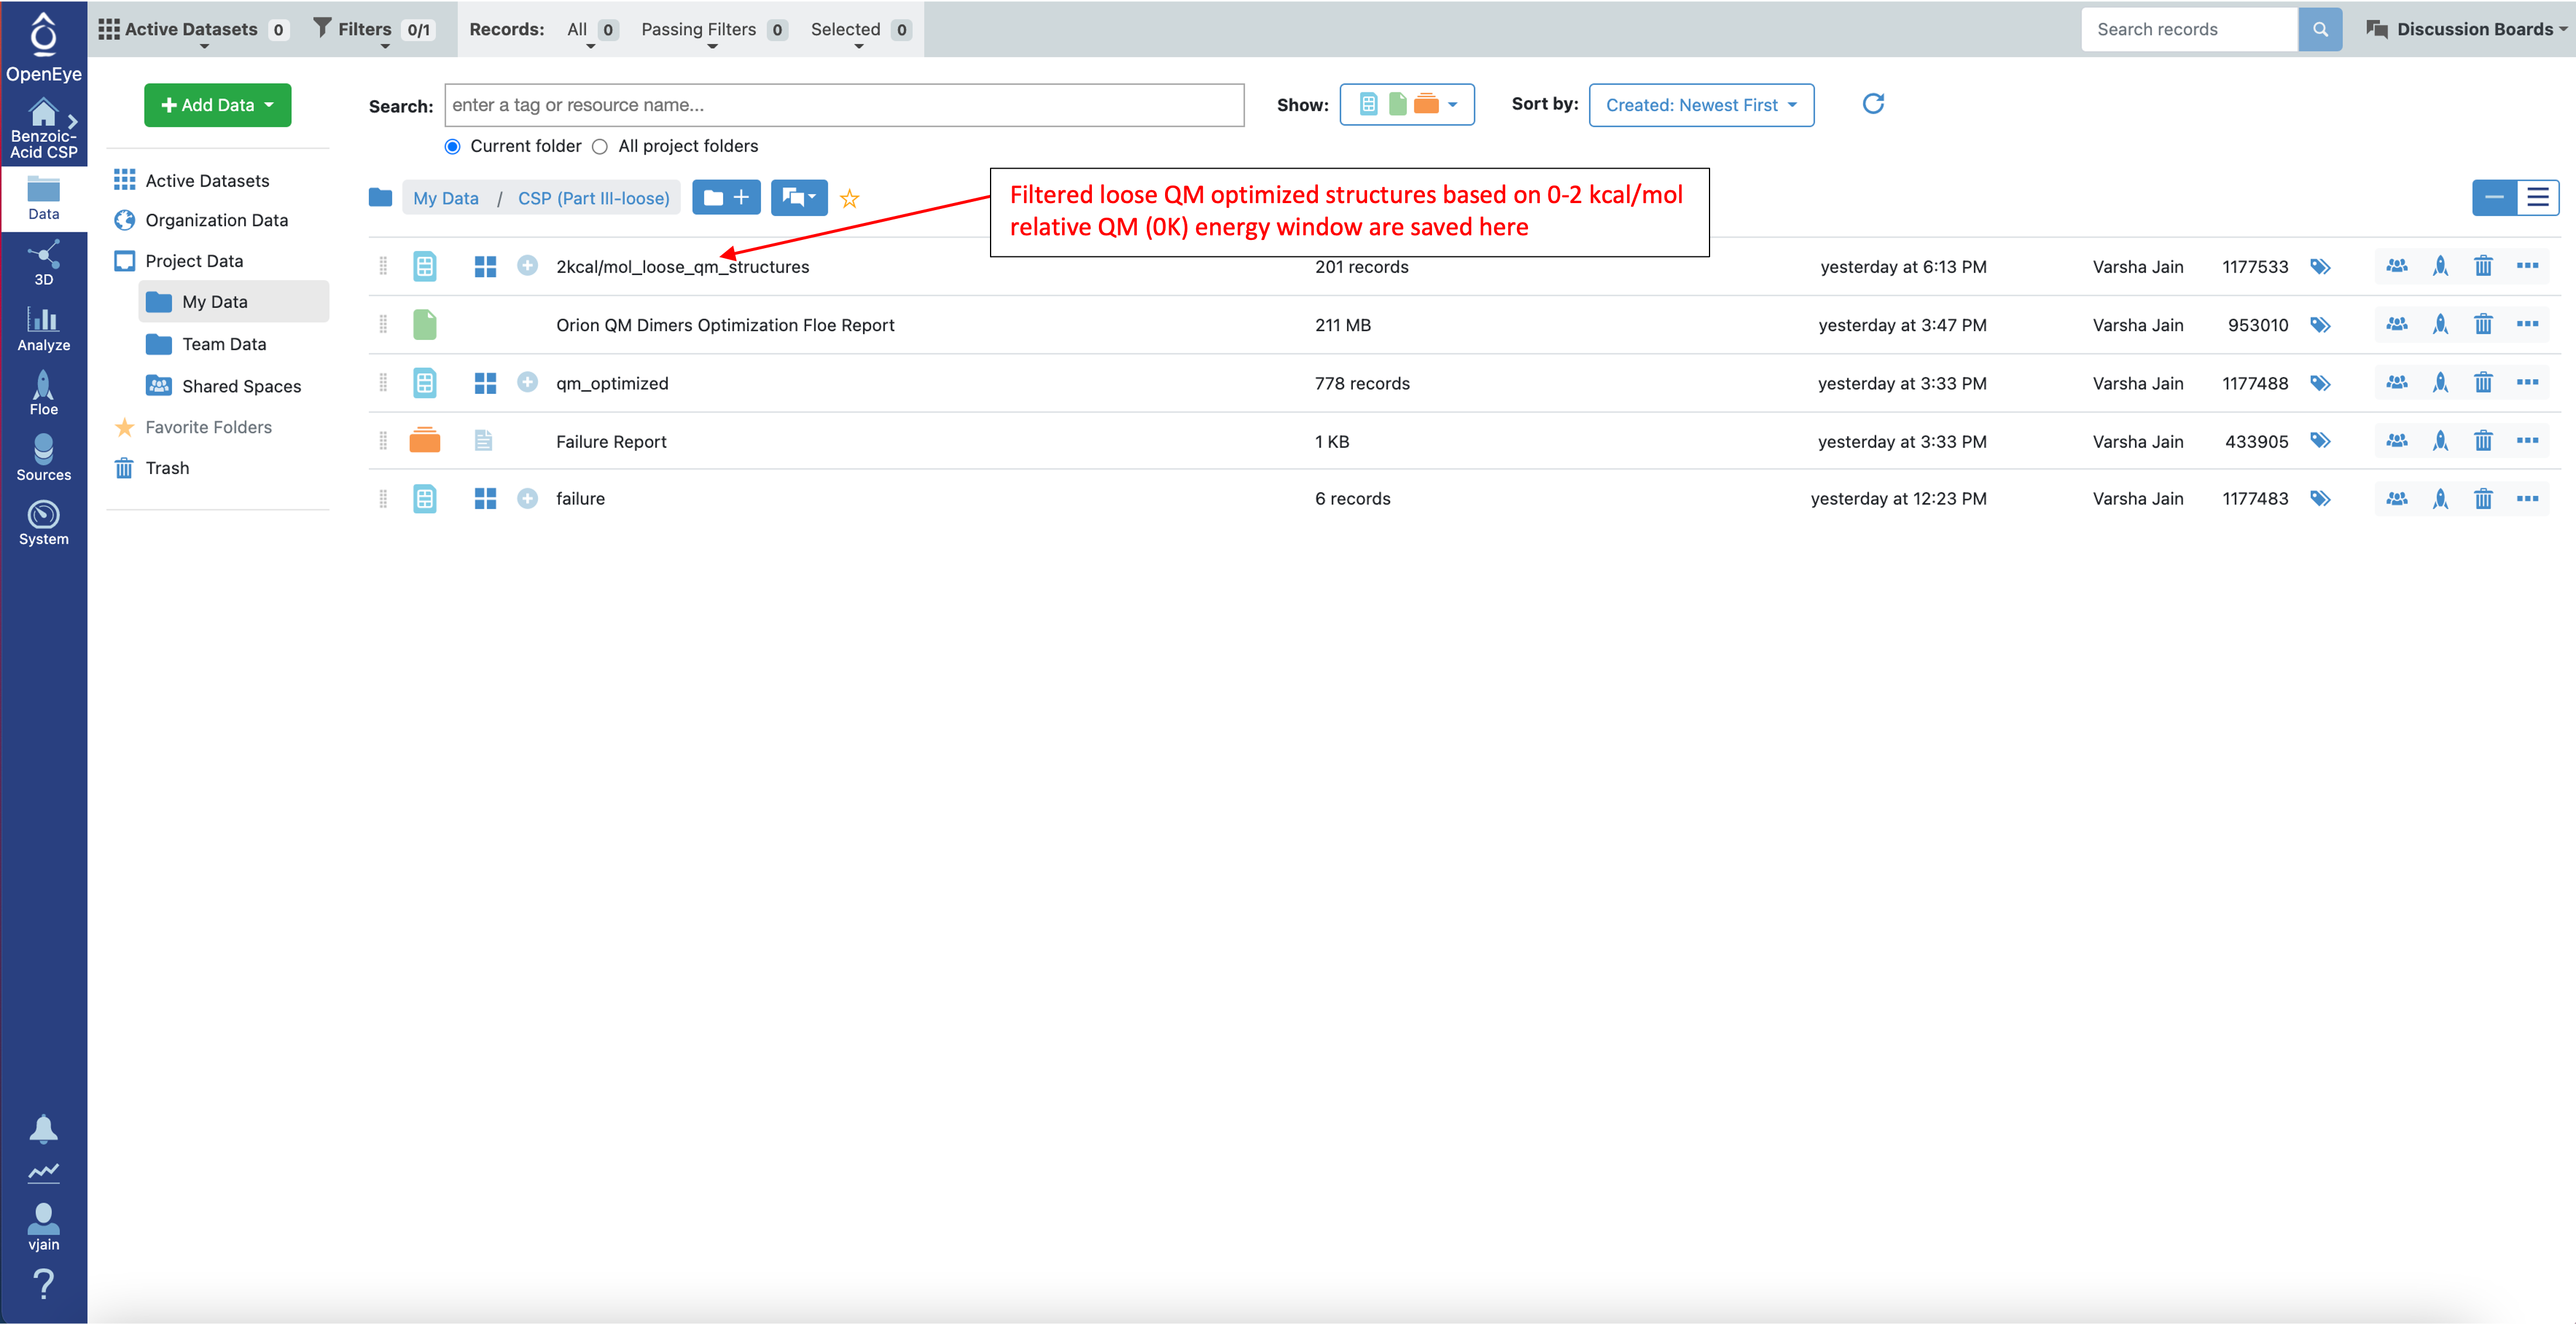
The filtered loose QM optimized structures are saved in the data folder as a new dataset:
Quantum Optimization of Crystal Structures (Part IIIB of CSP Protocol)
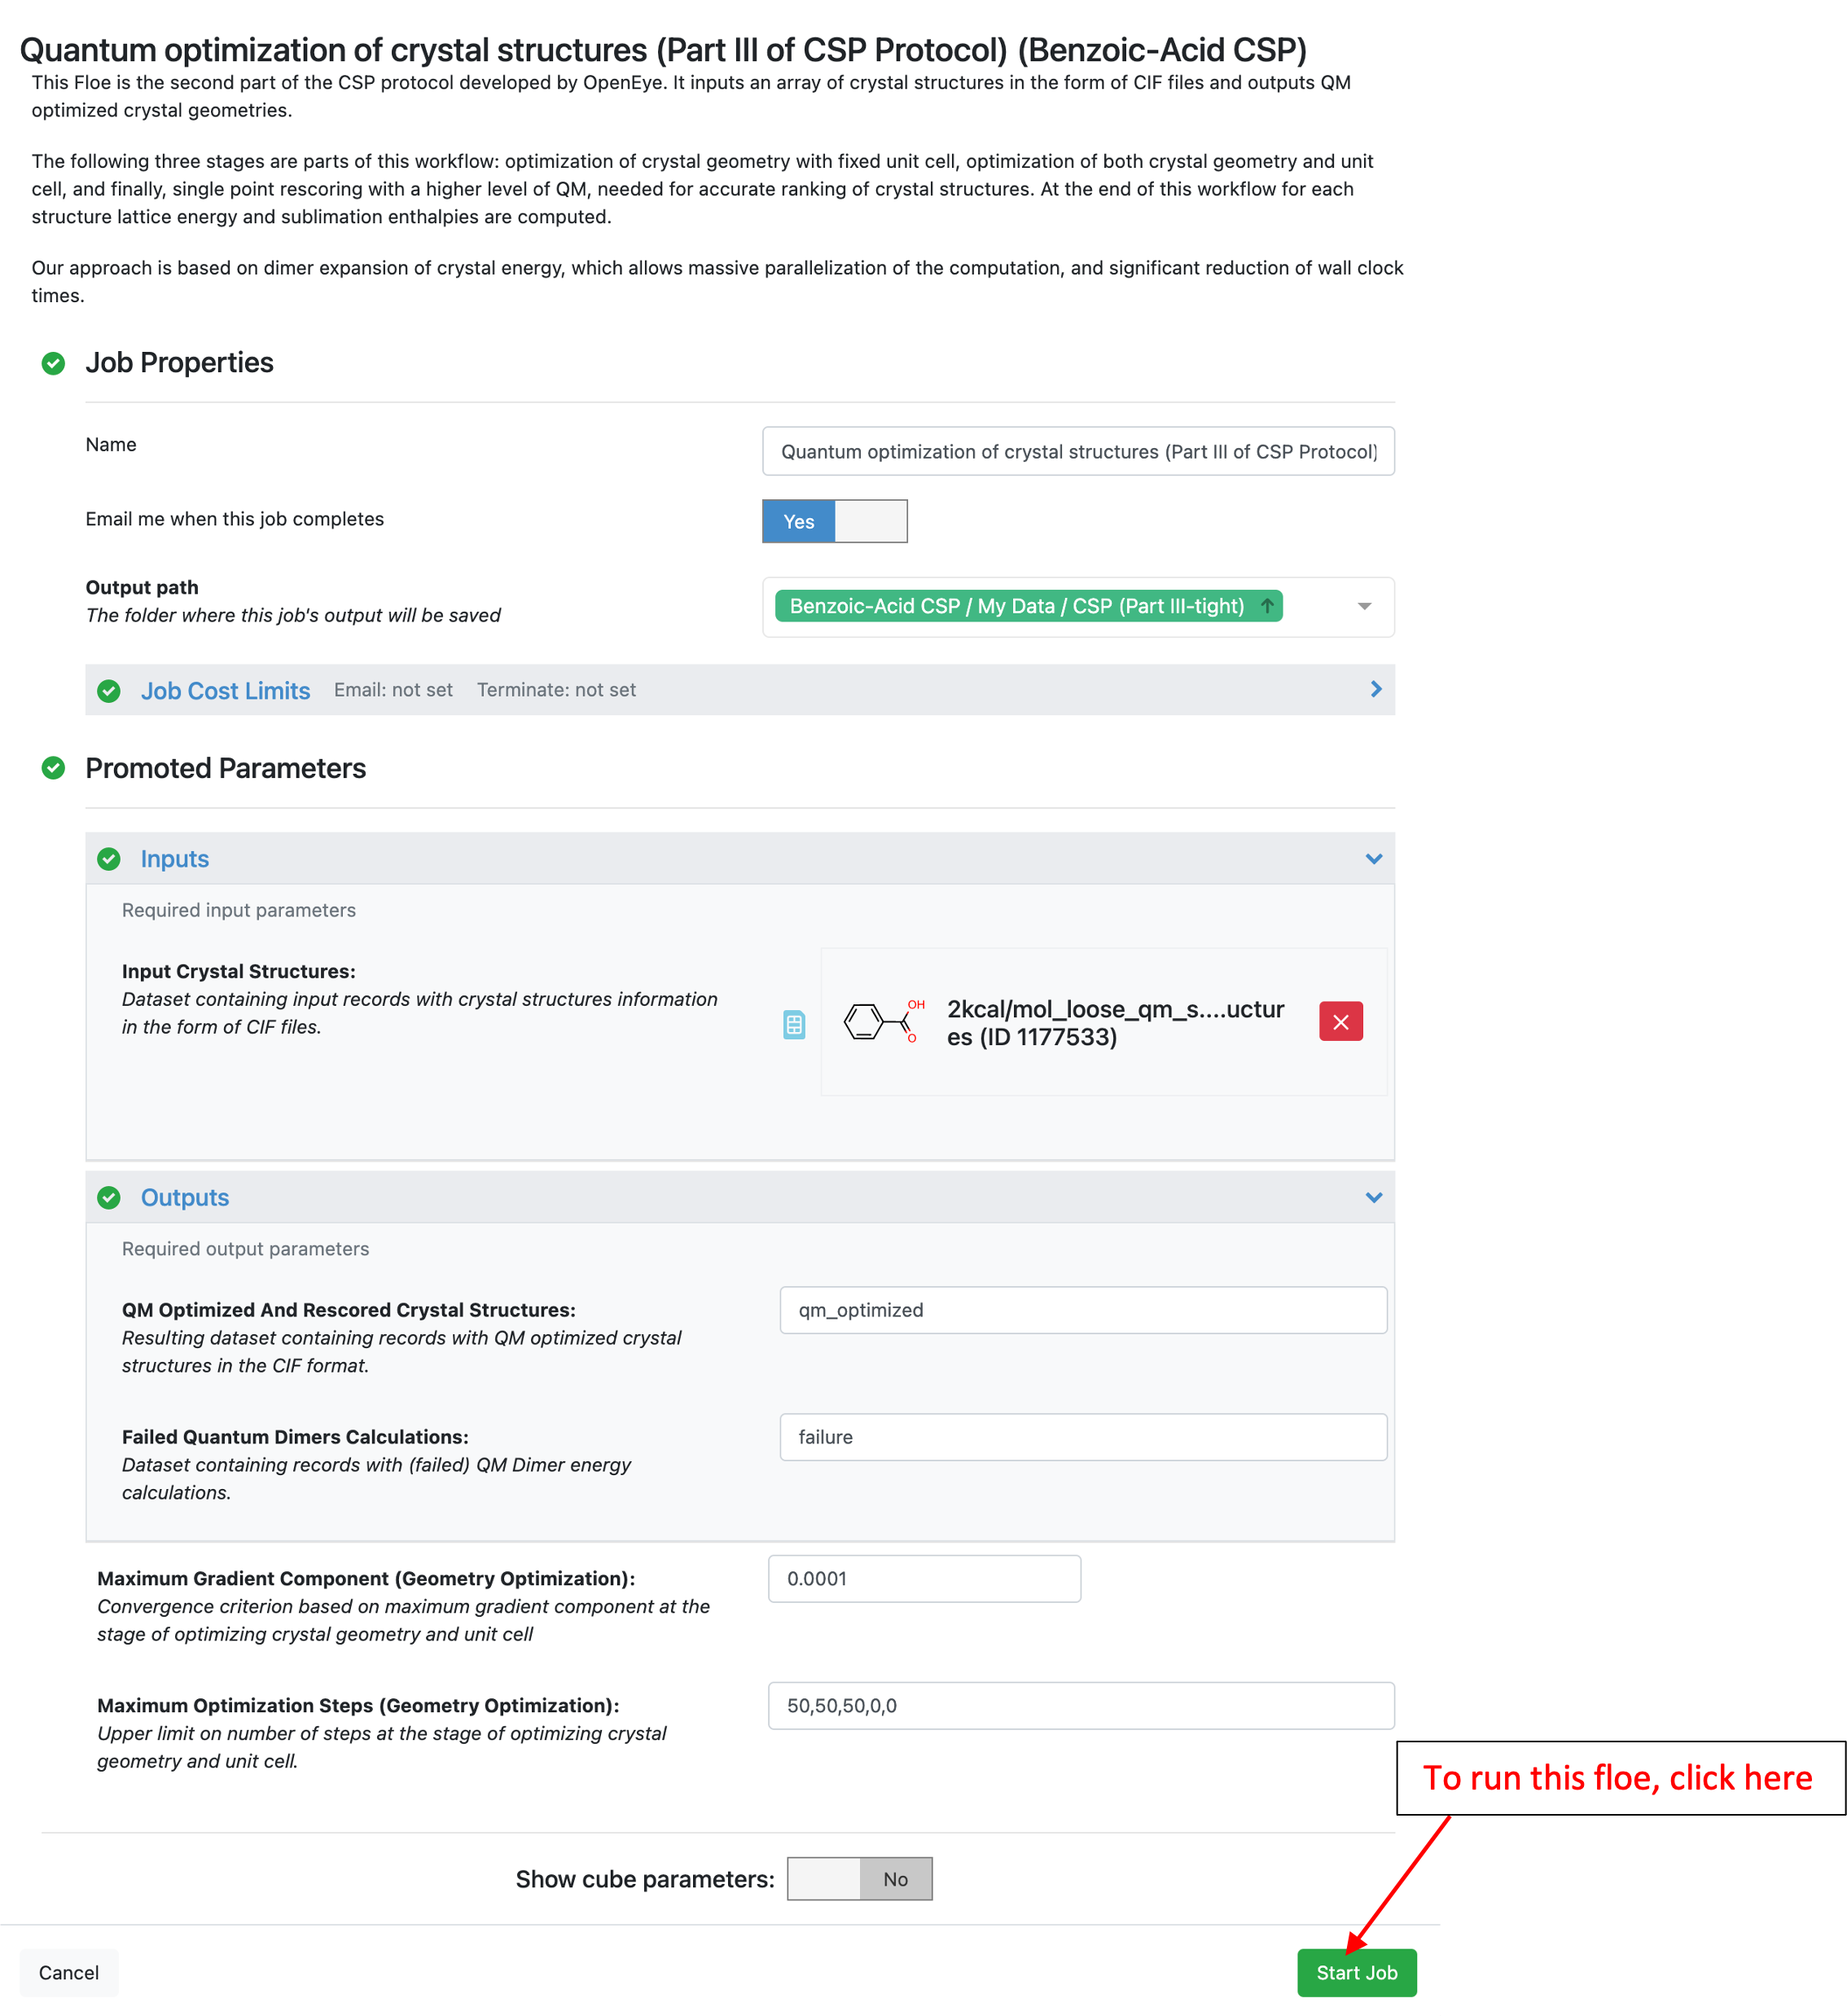
The final step is to run the * Quantum Optimization of Crystal Structures (Part IIIB of CSP Protocol) Floe which performs a tight optimization of the crystals at a low level of theory (HF-3c) and then a single point energy at a higher level of theory (B3LYP-D3MBJ/6-31G*).
The cost of running this Floe is around $474, which accounts for optimizing all 200 structures which were filtered above. A Cost Saving Option is to reduce the number of structures optimized. The cost of optimizing 2 structures should be about $5.00. Alternatively, skip to the Analyze CSP Part IIIB Tight Optimization Results section below to analyze the provided output.
Run CSP Part IIIB Tight Optimization
Find this Floe search for “Part IIIB” or the full title in the Product-based / Crystal Structure Prediction category path.
By default, this Floe uses HF-3C for optimizing crystal geometries followed by a single point energy calculation using B3LYP-D3MBJ/6-31G*. There are 50 steps for each stage of the crystal geometry optimization as shown below.
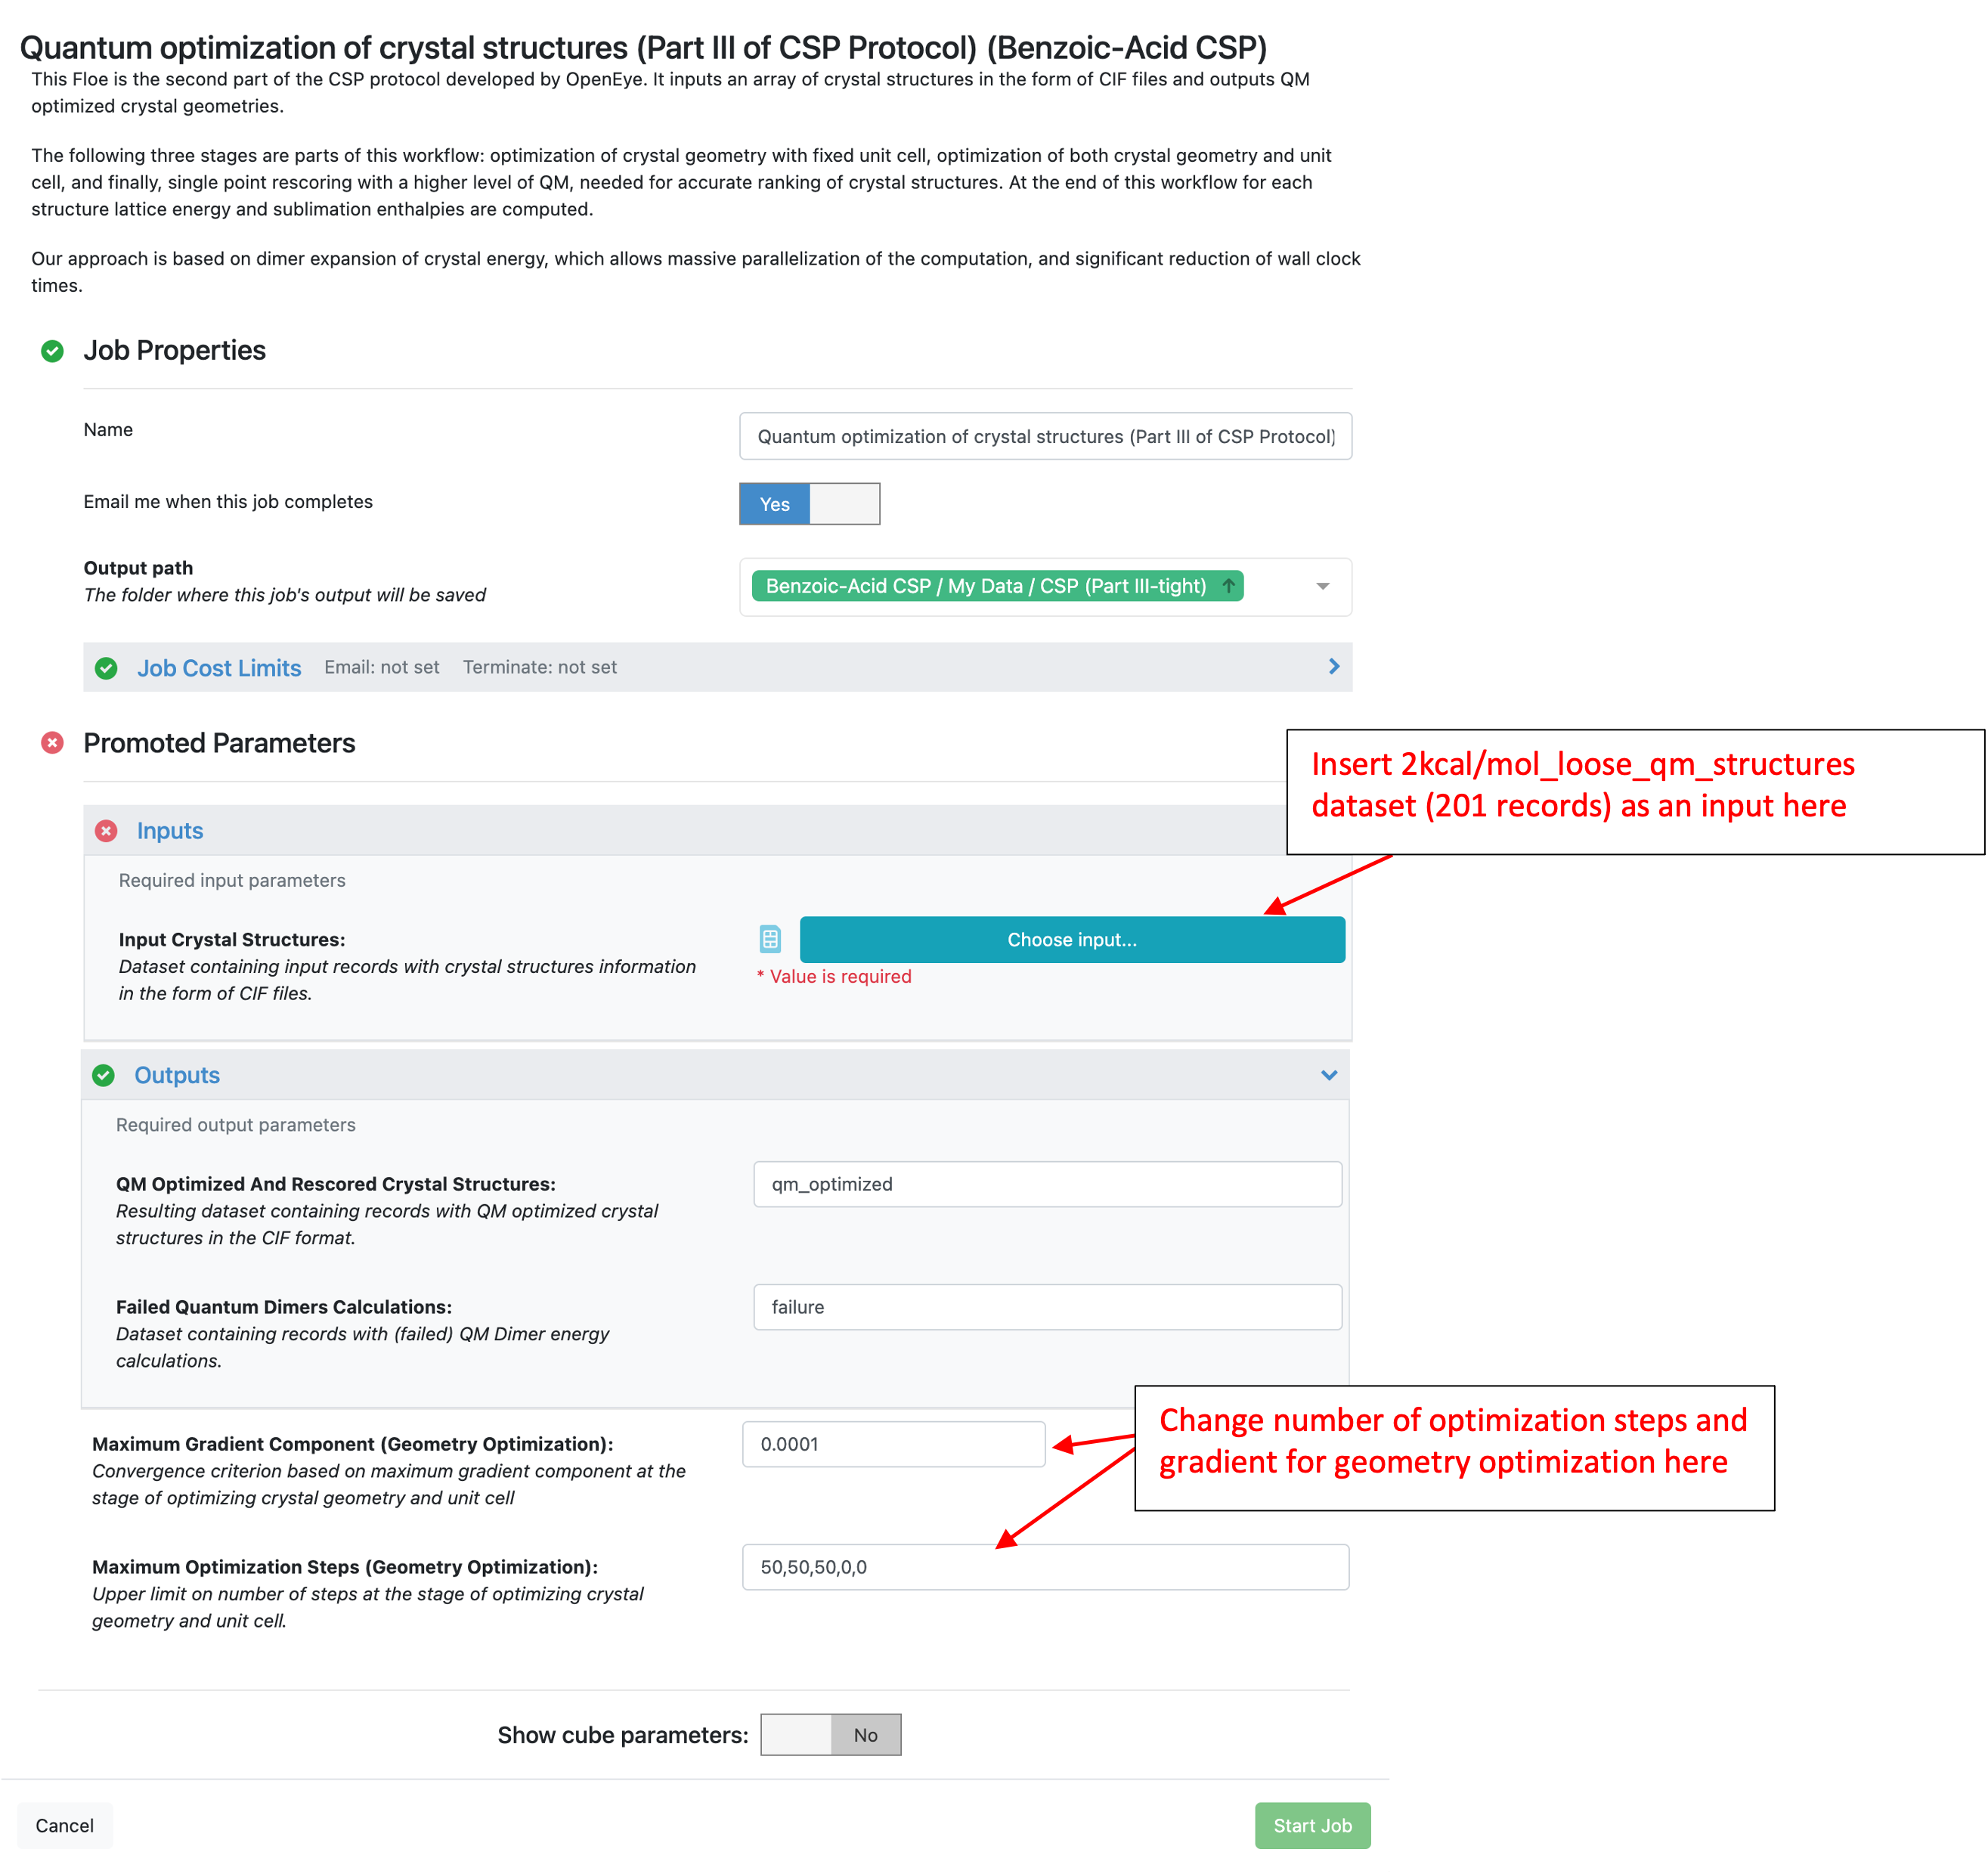
The input for this Floe is the loose optimized crystal structures generated and filtered above.
As described for the other Floes above, navigate to the job status page to see the details, parameters, and progress in the Floe diagram.
Once the job has finished, check the job details to see the cost and wall clock time. Look at the results by clicking on “Show in Project Data” or navigating to the Data tab.
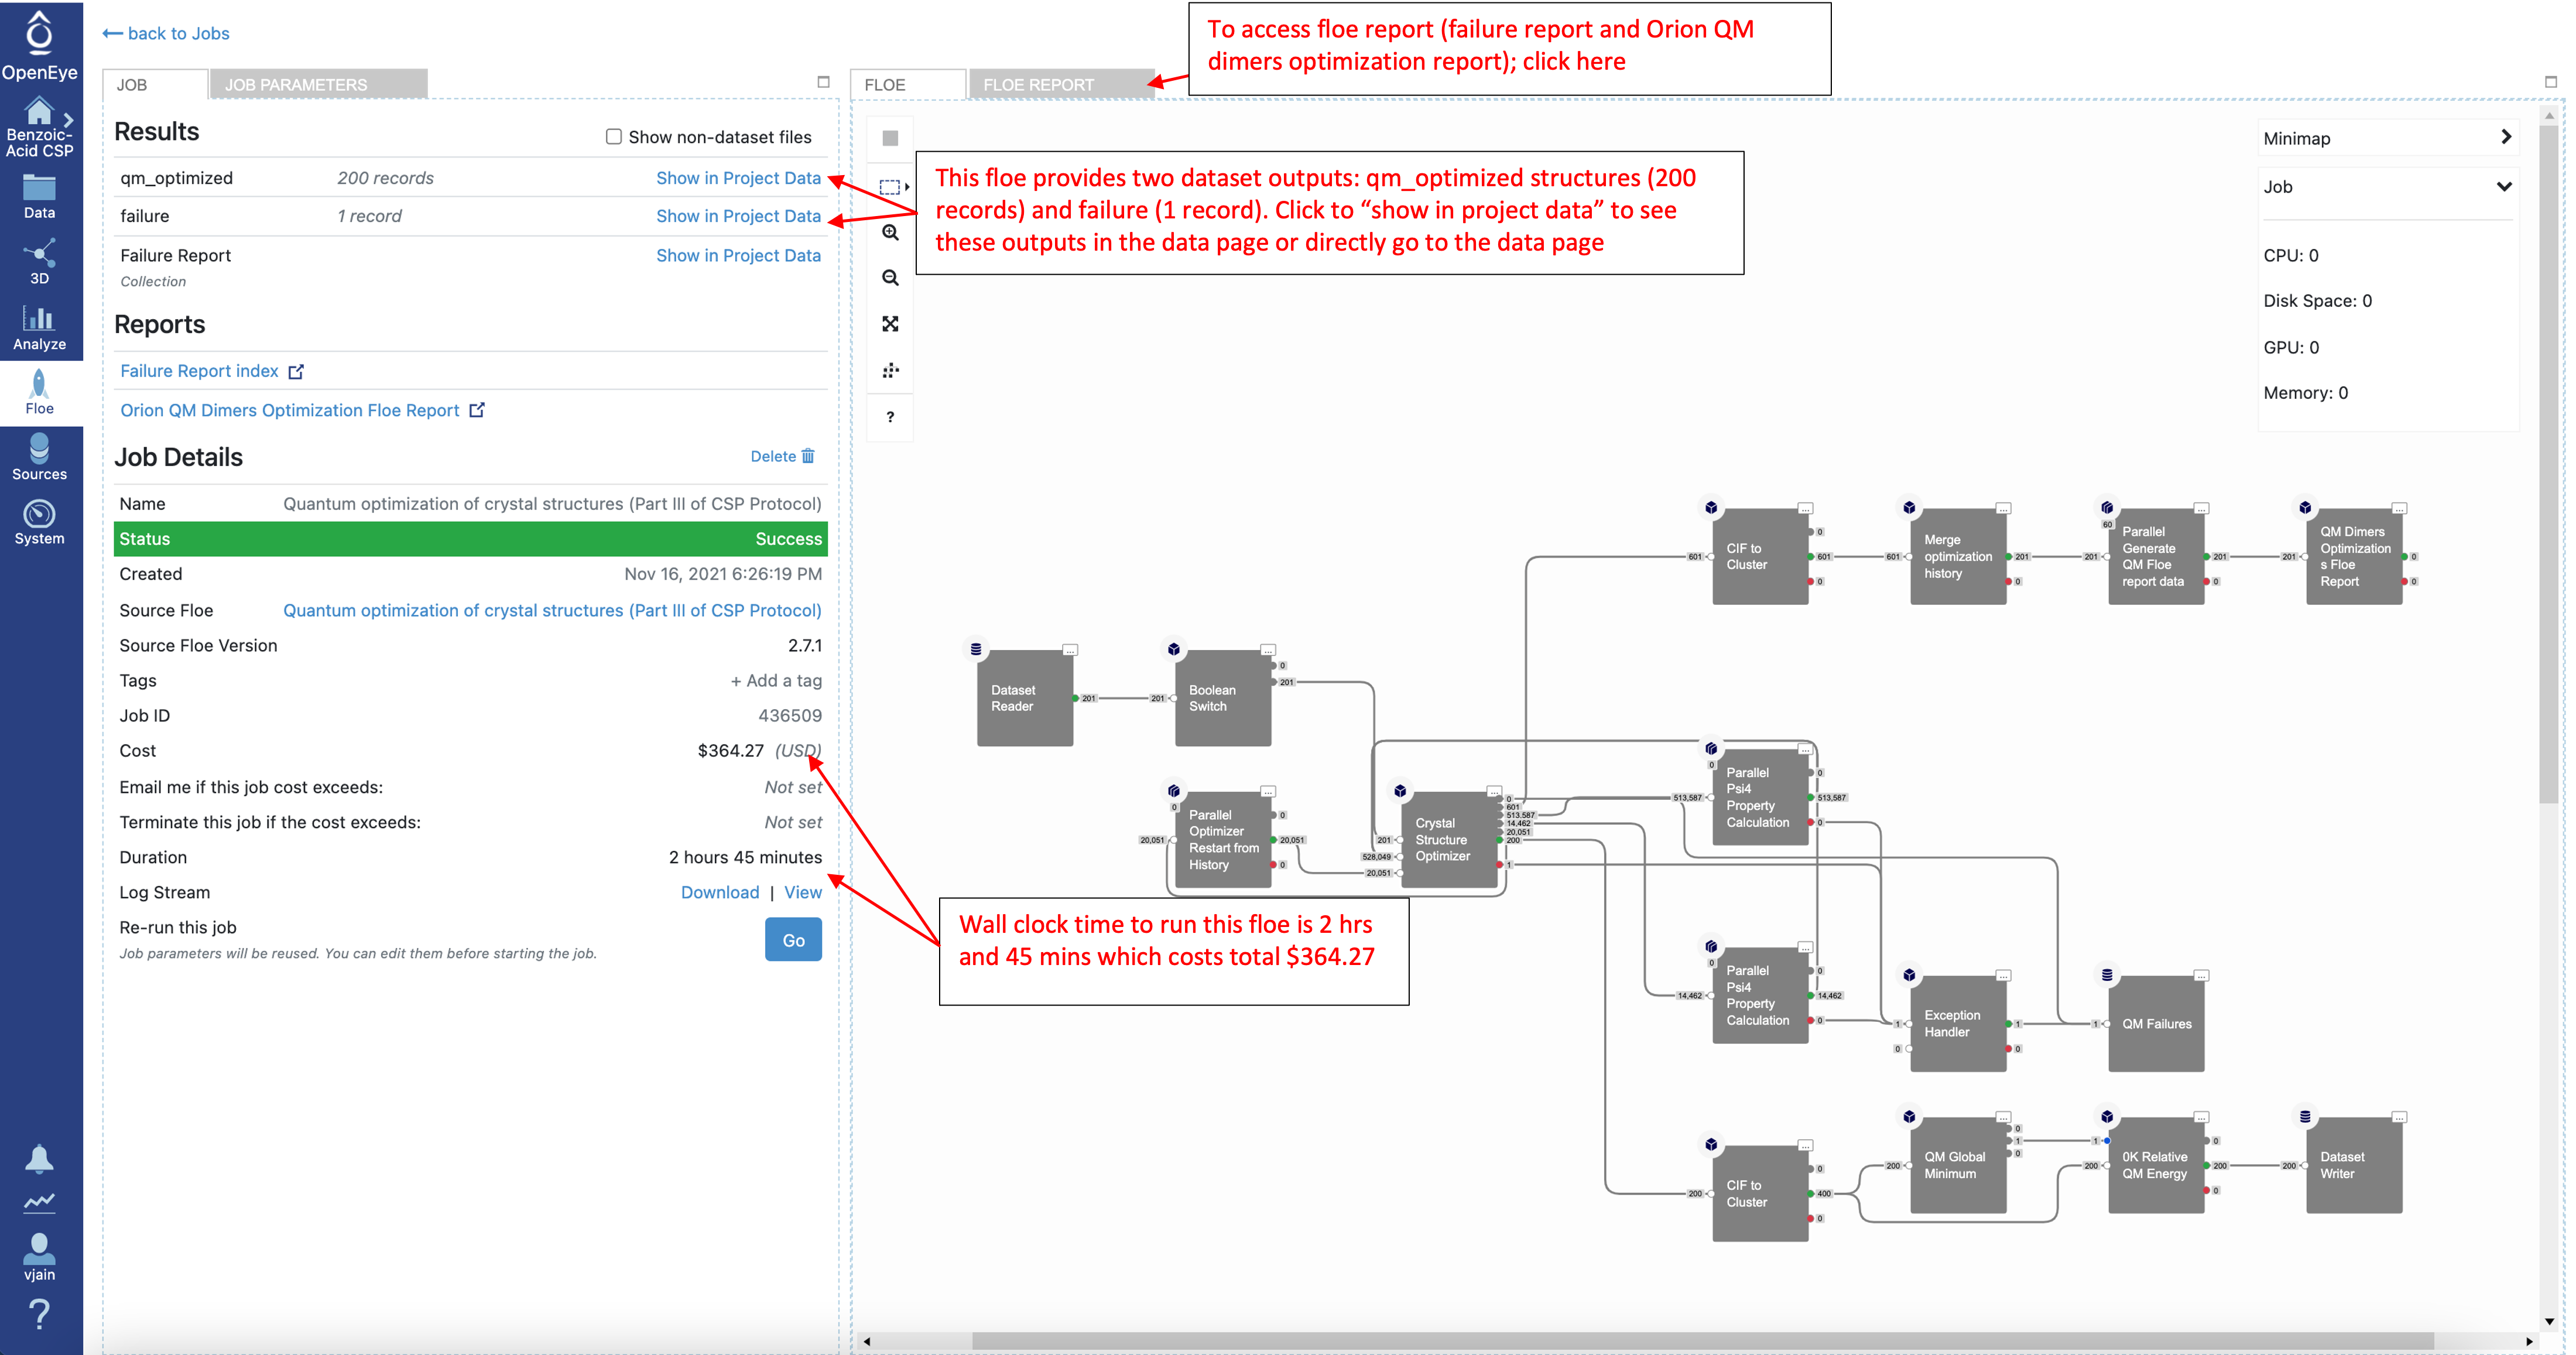
As with the loose quantum optimizations, this Floe generates two output datasets: qm_optmized structures and failures. It also provides two Floe reports (failure report and Orion QM dimers optimization Floe report).
Analyze CSP Part IIIB Tight Optimization Results
To locate example output for this Floe navigate to the “Quantum optimization of crystal structures (Part IIIB of CSP Protocol)” folder in the Crystal Math Floes tutorial data (for details about Tutorial Data on Orion).
To look at these QM optimized structures in the Analyze page and 3D viewer activate the qm_optimized dataset.
Navigate to the Analyze page to look at the final 0K results. Click on any data point in the scatter plot to view the associated crystal structure in the 3D viewer.
The expected error in these calculations is around 1 kcal/mol, therefore in a blind prediction, all structures within a 2 kcal/mol relative QM energy (0K) range should be considered as possible polymorphs. This approximate error comes from previous studies comparing calculated enthalpies with experimental enthalpies. However, if an experimental CIF file is available, the Crystal RMSD Floe can be run to compare predicted structures to experiment. Furthermore, if an experimental powder diffraction pattern is available, there is also a Floe for Filtering of Crystal Structures based on Powder Diffraction Pattern.
See Additional Optional Floes for brief descriptions for the remaining Floes.