Comparison to 3rd-party Software
BACE-1
A comparative study of the performance of 3D-QSAR models is performed following the work by Subramanian and coworkers
[Subramanian-2016]. This study compares performance of various 3D-QSAR software
by building models of potency for β‐Secretase 1 (BACE-1) inhibitors.
The input dataset (BACE1.oedb) consists of 1478 uncharged ligands
with 3D conformers taken directly from literature.
The external validation set contains the field External validation tag, which has a value of 1.
Training set: 205 ligands with X-ray structures.
Validation set: 1273 ligands without publicly disclosed X-ray structures.
The 3D QSAR Model: Builder Floe was used with the Unit for Potency parameter set to pIC50. The default Charge Type method am1bcc was used. The floe was run with Do External Validation set to On. To build models using EON (electrostatic-potential-based) descriptors (EON-GPR, EON-kPLS), charge assignment must be done first. If a charge assignment fails for a molecule, the molecule will be discarded. Because of some failures of charge assignment, the final training set is of size 204 and the validation set 1251.
Table 1 and Figure 1 summarize statistics for the validation set between models from this work and third-party software, as analyzed from the data reported for each of the validation ligands. The error bars for Kendall’s tau and Pearson’s correlation coefficient squared (\({r^2}\)) are estimated with a 95% confidence interval using a Fisher transformation, and the rest are estimated from bootstrapping. Performance of models from this work are either similar to or slightly better than the best-performing third-party software.
Approach/Model |
Software |
Kendall’s tau |
r2 |
COD |
MAE |
|---|---|---|---|---|---|
CoMFA |
Sybyl |
0.45 |
0.47 |
0.33 |
0.66 |
CoMSIA |
Sybyl |
0.35 |
0.31 |
0.13 |
0.76 |
ABM |
MAESTRO |
0.45 |
0.47 |
0.36 |
0.64 |
FQSAR_gau |
MAESTRO |
0.45 |
0.42 |
0.31 |
0.63 |
FQSAR_ff |
MAESTRO |
0.35 |
0.24 |
0.10 |
0.79 |
2D-GPR |
this work |
0.44 |
0.44 |
0.38 |
0.64 |
COMBO |
this work |
0.48 |
0.51 |
0.46 |
0.56 |
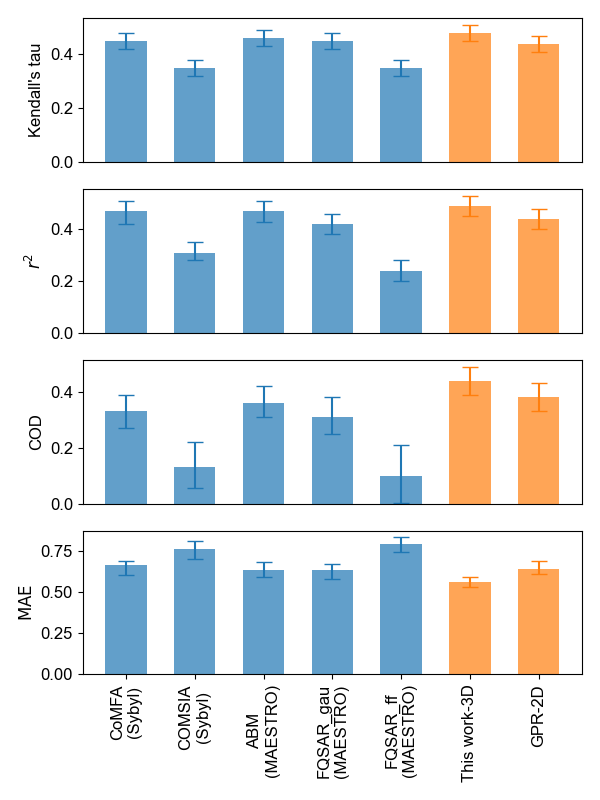
Figure 1. Performance comparison between models developed in this work and third-party software using the BACE-1 dataset.
Sutherland Datasets
The eight Sutherland datasets with charged 3D conformers [Sutherland-2004] have been frequently utilized for benchmarking new 3D-QSAR methods. Detailed descriptions of these datasets are given in Table 2.
Dataset |
Training set size |
Validation set size |
|---|---|---|
ACE ( |
76 |
38 |
ACHE ( |
74 |
37 |
BZR ( |
98 |
49 |
COX2 ( |
188 |
94 |
DHFR ( |
237 |
124 |
GPB ( |
44 |
22 |
THERM ( |
51 |
25 |
THR ( |
59 |
29 |
The 3D QSAR Model: Builder Floe was run for each of these datasets. The Charge Type parameter current_charges was used. Performance of models developed in this work were compared with other 3D-QSAR models reported in literature. Results for CoMFA, CoMSIA basic, and CoMSIA extra were taken from the original Sutherland literature [Sutherland-2004]. More recently developed 3D-QSAR methods, including Open3DQSAR [Tosco-2012], COSMOsar3D [Klamt-2012], QMFA [elKerdawy-2013], and QMOD [Cleves-2016] were also used for comparison. For consistency, COD was utilized here for performance metrics. Statistics for the eight Sutherland validation sets are shown in Table 3 and Figure 2.
Dataset |
2D-GPR (this work) |
COMBO (this work) |
CoMFA |
CoMSIA basic |
CoMSIA extra |
Open3DQSAR |
COSMOsar3D |
QMFA |
QMOD |
|---|---|---|---|---|---|---|---|---|---|
ACE |
0.5 |
0.67 |
0.49 |
0.52 |
0.49 |
0.69 |
0.62 |
0.71 |
0.32 |
ACHE |
0.55 |
0.75 |
0.47 |
0.44 |
0.44 |
0.67 |
0.61 |
0.61 |
0.56 |
BZR |
0.09 |
0.31 |
0.0 |
0.08 |
0.12 |
0.17 |
0.13 |
0.21 |
0.27 |
COX2 |
0.29 |
0.32 |
0.29 |
0.03 |
0.37 |
0.32 |
0.43 |
0.38 |
0.22 |
DHFR |
0.6 |
0.65 |
0.59 |
0.52 |
0.53 |
0.6 |
0.58 |
0.63 |
0.46 |
GPB |
0.44 |
0.53 |
0.42 |
0.46 |
0.59 |
0.5 |
0.63 |
0.58 |
0.46 |
THERM |
0.26 |
0.47 |
0.54 |
0.36 |
0.53 |
0.51 |
0.59 |
0.52 |
0.39 |
THR |
-1.07 |
0.41 |
0.63 |
0.55 |
0.63 |
0.67 |
0.66 |
0.62 |
0.42 |
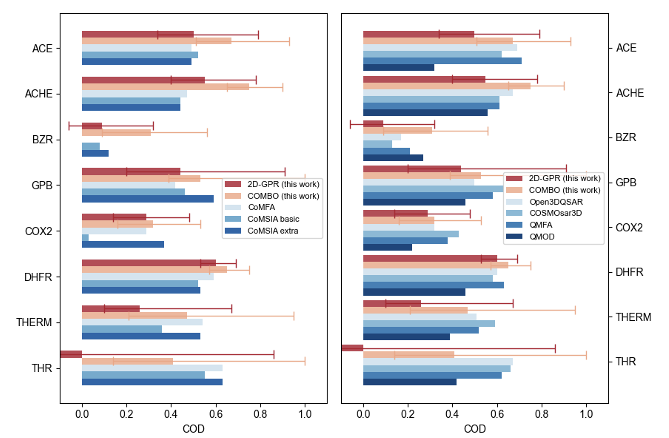
Figure 2. Performance comparison between models developed in this work and third-party software (left: traditional CoMFA and CoMSIA methods; right: more recently developed methods) using the eight Sutherland datasets.
Average performance in terms of COD across the Sutherland datasets, along with the standard deviation, is reported in Table 4. The performance of the 3D models developed in this work is better than CoMFA and CoMSIA, and on par with the more recently developed methods.
Model |
Averaged COD (standard deviation) |
|---|---|
2D-GPR (this work) |
0.21 (0.54) |
COMBO (this work) |
0.51 (0.17) |
CoMFA |
0.43 (0.20) |
CoMSIA basic |
0.37 (0.20) |
CoMSIA extra |
0.46 (0.16) |
Open3DQSAR |
0.52 (0.19) |
COMSMOsar3D |
0.53 (0.18) |
QMFA |
0.53 (0.16) |
QMOD |
0.39 (0.11) |