Datasets
Two sets of input datasets are utilized in this tutorial.
The first one is a ligand dataset obtained from the supplemental materials in a paper from Sutherland and coworkers [Sutherland-2004],
which contains 66 inhibitors of glycogen phosphorylase b (GPB)
with 3D conformers and charges provided. This is the GPB benchmark dataset.
(GPB.oedb)
Among the 66 ligands, 44 of them are utilized for model training and the rest are for external model validation.
The external validation ligands have a value of 1 for the External Validation Set Tag Value field.
The Unit for Potency parameter contains experimental binding affinity data in log units.
The second datasets are curated and used to build models for β‐secretase 1 (BACE-1) inhibitors.
A set of 20 receptors (BACE1_recs_20.oedb) is
provided for Posit pose conformer generation. This is the BACE-1 receptor dataset.
The input ligand dataset (BACE1_2D_400.oedb) contains 400 ligands
without 3D conformers or charges. This is the BACE-1 ligand dataset.
The Unit for Potency parameter contains experimental binding affinity data in log units.
Note
If you want to do external validation within the model builder floe, the external validation ligands need to be manually tagged. The alternative is to run the model builder floe followed by the model validation floe.
3D QSAR Model: Builder Floe
The 3D QSAR Model: Builder Floe builds four individual 3D models: ROCS-kPLS, ROCS-GPR, EON-kPLS, and EON-GPR, and bases the final prediction on the consensus of the individual model predictions. The prediction from the consensus model is provided as the median of the individual model predictions; the prediction confidence is also obtained as the median of the individual model confidences.
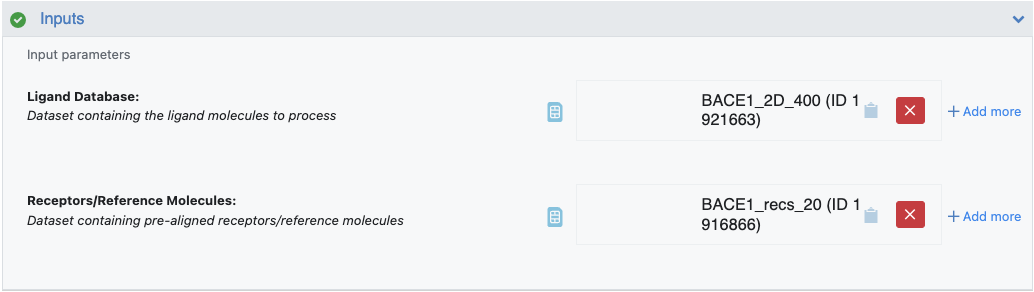
The required input of the floe is a ligand dataset with potency values. A second input, containing receptors or reference molecules, is required if you want to generate conformers using POSIT or FlexiROCS. Below are two examples for running the floe with either provided or generated conformers.
Running the Floe with Provided Pre-aligned Conformers
For this example, the benchmark dataset is utilized as the input ligand dataset. The steps to run the 3D QSAR Model: Builder Floe are detailed below.
Select the 3D QSAR Model: Builder Floe in Orion and a Job Form will pop up.
Change the job name, output path, and name of output datasets, if desired.
For the Ligand Database, choose the GPB benchmark dataset.
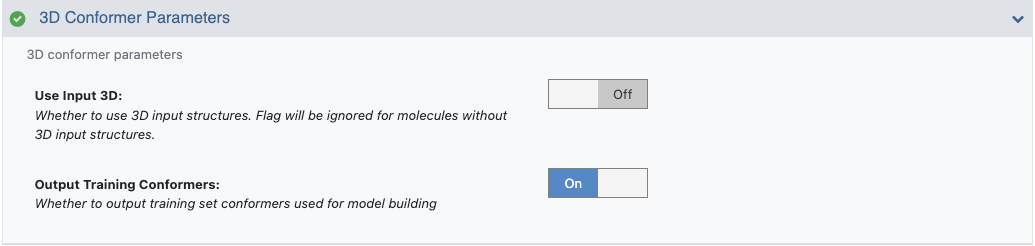
Under the 3D Conformer Parameters section, select whether to use the 3D input structures and whether to output the training set conformers. For this tutorial, we leave both fields at their default values. With Use Input 3D turned On, molecules with provided input 3D structures will be utilized as is.
Under the Charge Method Parameters, select the desired charge method. The default option for the Charge Type parameter is am1bcc. Switch to current_charges if you want to use input charges directly for model building.
For this example, we change the charge assignment to current_charges.
Note
If a molecule can’t be assigned charges, or does not contain charges when the current_charges option is selected, the molecule will not enter the model building process.
Under Potency Parameters, specify the name of the potency field, the minimum and maximum potency for a record to be considered valid, and the unit for potency. If the input binding affinity data has the units micromolar or nanomolar, it will be converted to log units for model building. Here, we leave all fields to their default values.
Note
If an input molecule is considered to be invalid due to its potency being out of range, the molecule will not enter the model building process.
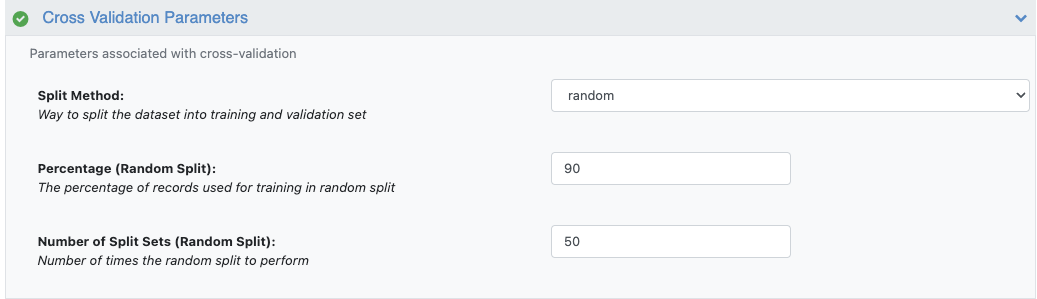
Under the Cross Validation Parameters, select the desired splitting method for cross-validation experiments. The default splitting method is leave one out. Here we leave all fields to their default values.
Note
If the training set is relatively large (e.g., greater than 100), consider using the random split instead.
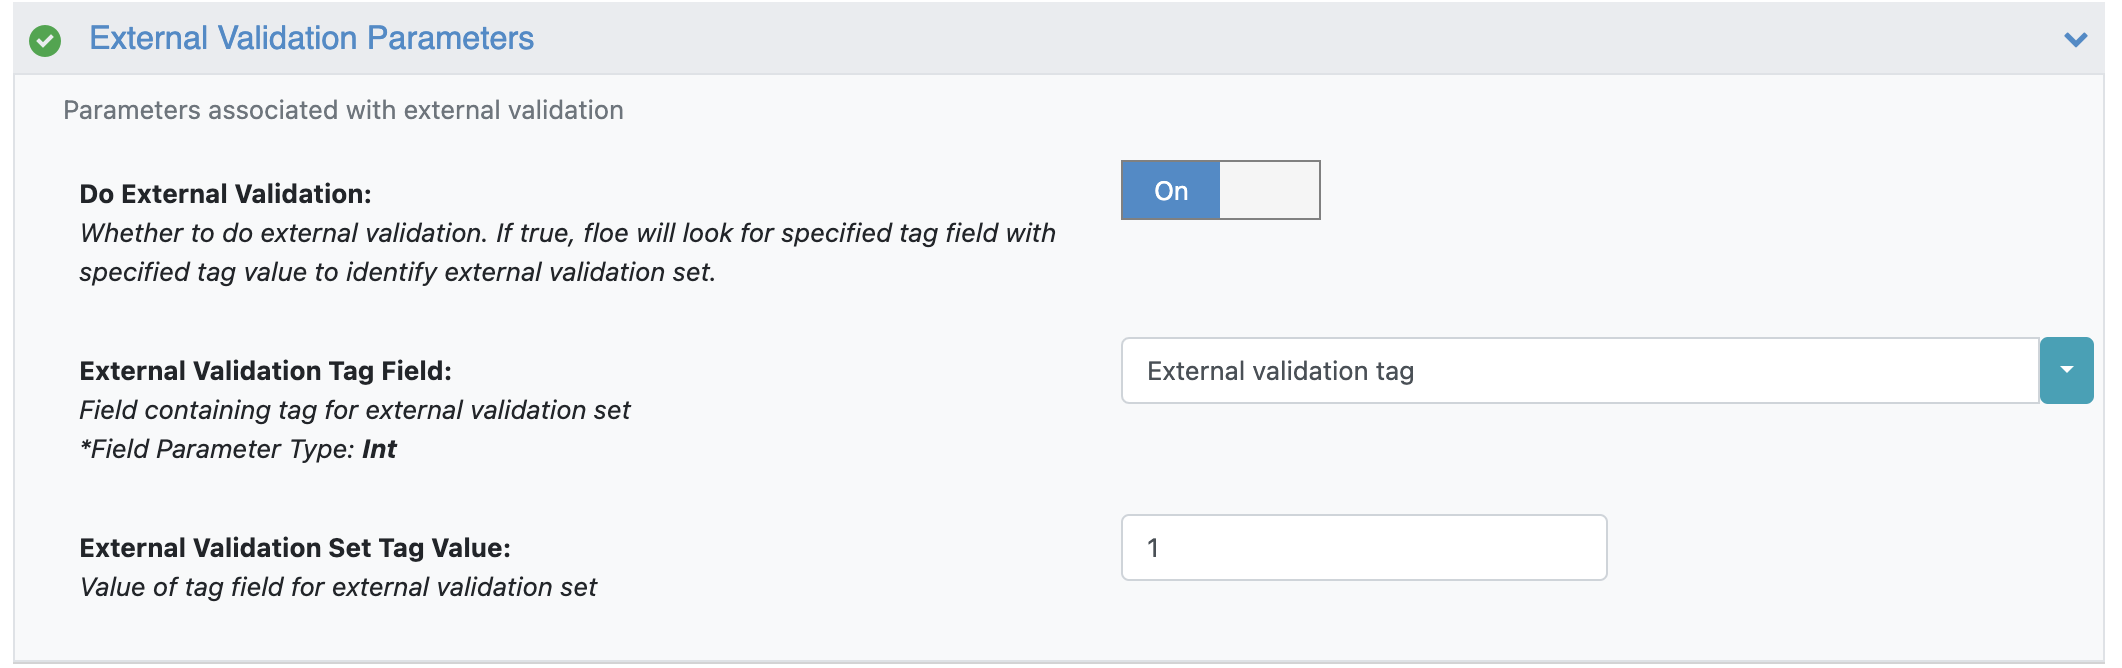
Under the External Validation Parameters, select whether to do external validation.
For this tutorial, we turn Do External Validation On and leave all other fields to their default values.
Note
Molecules identified as belonging to the external validation set won’t go into the model building process. If Do External Validation is turned On, but the external validation set comes out to be empty, the floe will throw an error.
Click the “Start Job” button to launch the floe.
Floe Output Datasets
The 3D QSAR Model: Builder Floe outputs three datasets, with the external validation dataset and training set conformer dataset being optional.
Output Model Dataset (default name = Output for 3D QSAR Model: Builder): Contains the model and stores the receptors/reference molecules, if provided.
External Validation Output Dataset (default name = External Validation Output): Contains the individual and COMBO model predictions, along with the corresponding prediction confidence for the external validation set.
Training Conformer Output Dataset (default name = Training Conformer Output): Contains the conformers used for model building.
The model datasets built from this floe can be used as input for other floes in this package, which focus on prediction, external validation, and interpretation, as mentioned later in this tutorial.
Note
The model dataset is only meant to be used as input for other floes. For model performance, refer to the Floe Reports.
Floe Reports
The 3D QSAR Model: Builder Floe generates a report with multiple pages.
Model Statistics
This section contains information regarding the training set used in model building:
Statistics and histograms of input potency. Figure 1 shows the corresponding plot obtained using the GPB dataset.
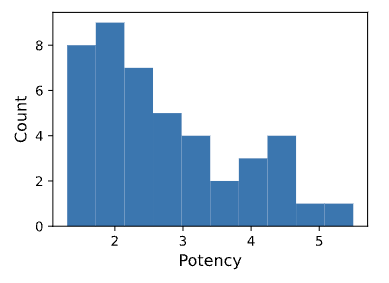
Figure 1. Input potency histogram from Model Statistics report.
Statistics and histograms of pairwise similarities based on the relevant descriptors for various 3D-QSAR models and 2D baseline model. Figure 2 shows the corresponding plots obtained using the GPB dataset.
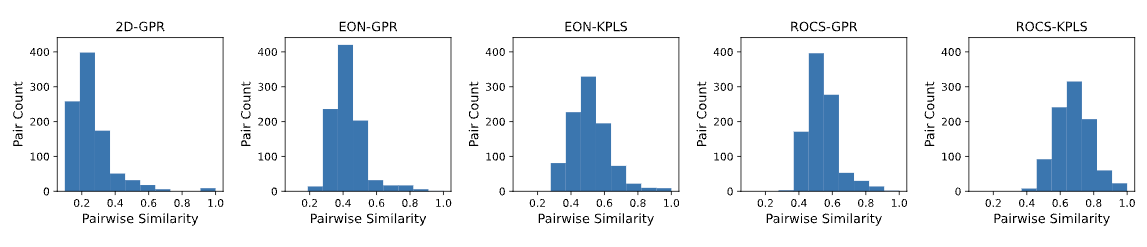
Figure 2. Pairwise similarity histograms from Model Statistics report.
Plots of | Delta Potency | versus Pairwise Similarity for different models show whether molecules similar in descriptor space are also similar in potency. Irregularities in such plots indicate potential activity cliffs in the training dataset. Figure 3 shows the corresponding plots obtained using the GPB dataset.
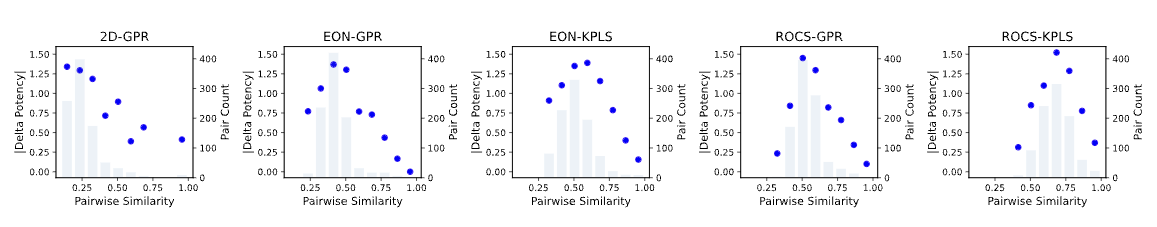
Figure 3. | Delta Potency | vs. Pairwise Similarity from Model Statistics report.
Note
All pairwise similarities are normalized using the corresponding upper bound.
Feature Optimization - ROCS-kPLS
The optimal number of features, or the hyperparameter for a kPLS model, is obtained based on cross-validation statistics. Pearson’s correlation coefficient squared (\({r^2}\)) from cross-validation is plotted against the corresponding number of features, and the optimal is selected by picking the value corresponding to the maximum of \({r^2}\). Figure 4 shows the result obtained for the ROCS-kPLS model. In this case, the optimal number of features is determined to be 10.
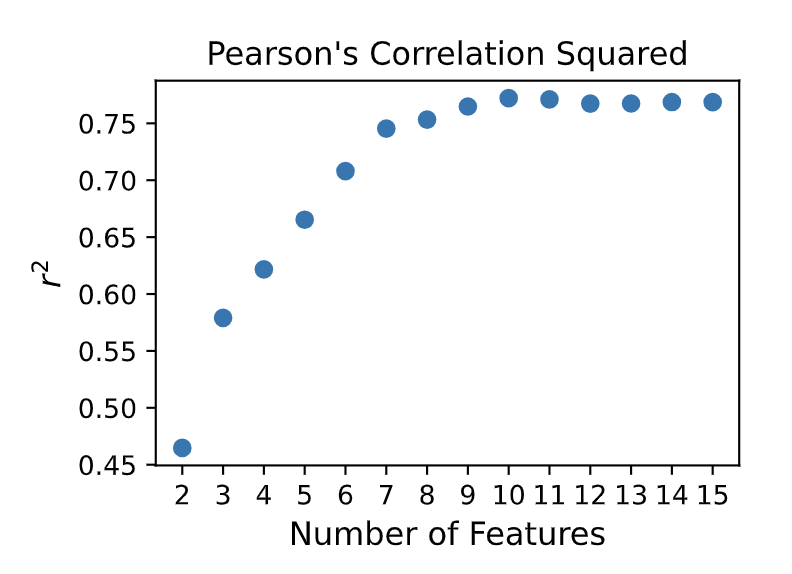
Figure 4. ROCS-kPLS hyperparameter optimization results from Feature Optimization - ROCS-kPLS report.
Feature Optimization - EON-kPLS
The feature optimization details for the EON-kPLS model are similar to those for the ROCS-kPLS model.
Cross Validation Statistics
These are statistics and histograms obtained from combined validation sets from all cross-validation splits.
Validation statistics include:
Pearson’s correlation coefficient squared (\({r^2}\))
Kendall’s tau
Coefficient of Determination (COD)
Median absolute error (MAE)
Relative median absolute error (RMAE)
Note
Unlike \({r^2}\), COD can be negative. A baseline model which always predicts the average of training set, gives a COD of 0. Models that have worse predictions than this baseline will have a negative COD.
Predicted Potency versus Actual Potency, colored by confidence level and along with parity and error lines (+/- 1 log unit), are plotted for all individual models for visualization purposes. Plots of Fraction Accurate versus Confidence Level are provided to see how the actual accuracy correlates with estimated accuracy. For individual 3D and 2D models, plots of Fraction Accurate versus Minimum Dissimilarity to Training Set are also provided. Figure 5 shows the cross-validation results for COMBO model using the GPB dataset.
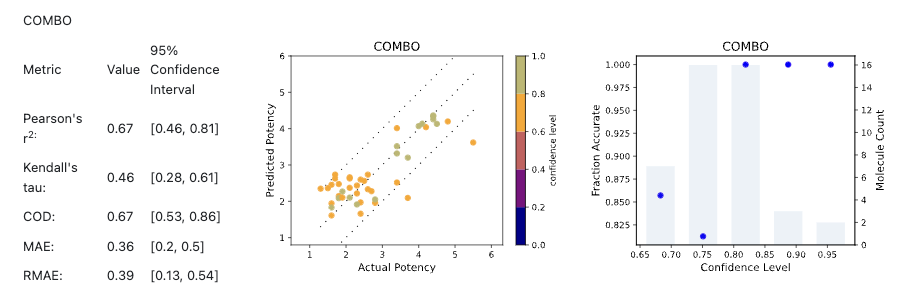
Figure 5. Results for COMBO model from Cross Validation Statistics report.
External Validation Statistics
Since the input dataset contains an external validation set, the 3D QSAR Model: Builder Floe also produces an external validation report in a similar format as the cross-validation report.
Running the Floe Using Posit as Conformer Generation and Alignment Method
For this example, the receptors and the ligand dataset are used as input datasets. The steps to run the 3D QSAR Model: Builder Floe are detailed below.
Select the 3D QSAR Model: Builder Floe in Orion and a Job Form will pop up.
Change the job name, output path, and name of output datasets, if desired.
For the Ligand Database, choose the BACE-1 ligand dataset, and for Receptors/Reference Molecules, select the BACE-1 receptor dataset.
Under the 3D Conformers Parameters, turn Off Use Input 3D and turn On Output Training Conformers. Pose conformers will be generated by Posit by default.
Note
If a dataset of reference molecules is provided instead, conformers will be generated by FlexiROCS. If both receptors and reference molecules are provided, the reference molecules will be ignored.
Note
If the Posit pose conformer for a molecule has a confidence, or Posit probability below 0.5, the conformer is considered to be invalid and will not enter the model building process. The same applies for FlexiROCS conformers.
Under the Charge Method Parameters, select the desired charge method. The default option for the Charge Type parameter is am1bcc.
Leave all Potency Parameters at their default values.
Under the Cross Validation Parameters, switch the Split Method option to random since the training dataset is relatively large. Leave other fields at their default values.
Leave all External Validation Parameters at their default values.
Click the “Start Job” button to launch the floe.
Floe Outputs
Using the BACE-1 input datasets, the 3D QSAR Model: Builder Floe generates an an optional output dataset, “Training Conformer Output,” containing the aligned pose conformers of 329 training ligands, with the remaining 71 training ligands reported in the failure report due to a Posit probability below 0.5. Figure 6 shows the cross-validation results for COMBO model using the BACE-1 dataset.
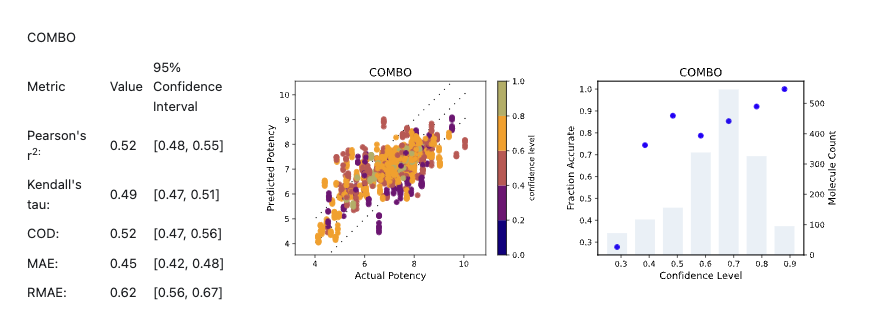
Figure 6. Results for COMBO model from Cross Validation Statistics report using the BACE-1 dataset.
3D QSAR Model: Predictor Floe
The 3D QSAR Model: Predictor Floe takes two input datasets, one being the ligand dataset for making predictions, and the other is the model dataset generated from the 3D QSAR Model: Builder Floe. Similar to the model builder floe, you can select whether to use input 3D structures for the test dataset or not. For molecules without input 3D structures, poses will be generated either from Posit or FlexiROCS, based on whether receptors or reference molecules are present in the model dataset. The output from this floe is a single dataset that contains the predicted potency and prediction confidence from different individual models, as well as the consensus model.
3D QSAR Model: Validation Floe
The inputs to the 3D QSAR Model: Validation Floe are similar to those of the 3D QSAR Model: Predictor Floe, that is, a ligand dataset and a model dataset. However, unlike the predictor floe, the validation floe expects the input ligand dataset to contain an additional field containing actual potency values. These actual potency values are used against the predictions to perform validation and corresponding statistics. In addition to an output validation dataset that contains predictions on the input ligand dataset, this floe also generates a validation report similar to the external validation report generated from the 3D QSAR Model: Builder Floe.
3D QSAR Model: Interpretation Floe
The 3D QSAR Model: Interpretation Floe can be used to obtain interpretation information based on the kPLS models. This floe takes a model dataset generated from the 3D QSAR Model: Builder Floe as an input.
The output dataset contains a domain grid and different types of high and low surfaces corresponding to various probes used. Table 1 lists the different types of surfaces and their corresponding atom probes.
Surface Name |
Probe Atom Type |
|---|---|
Volume |
Carbon atom |
Acceptor |
Color atom of type Acceptor |
Donor |
Color atom of type Donor |
Hydrophobe |
Color atom of type Hydrophobe |
Rings |
Color atom of type Rings |
Cation |
Color atom of type Cation |
Anion |
Color atom of type Anion |
Positive |
Sodium atom of +1 charge |
Negative |
Chloride atom of -1 charge |
The output dataset can be visualized in Orion. For example, utilizing the output model dataset from the previous 3D QSAR Model: Builder Floe with the GPB dataset, Figure 7 shows an image of the visualized domain grid and high hydrogen donor (magenta) and acceptor (yellow) surfaces.
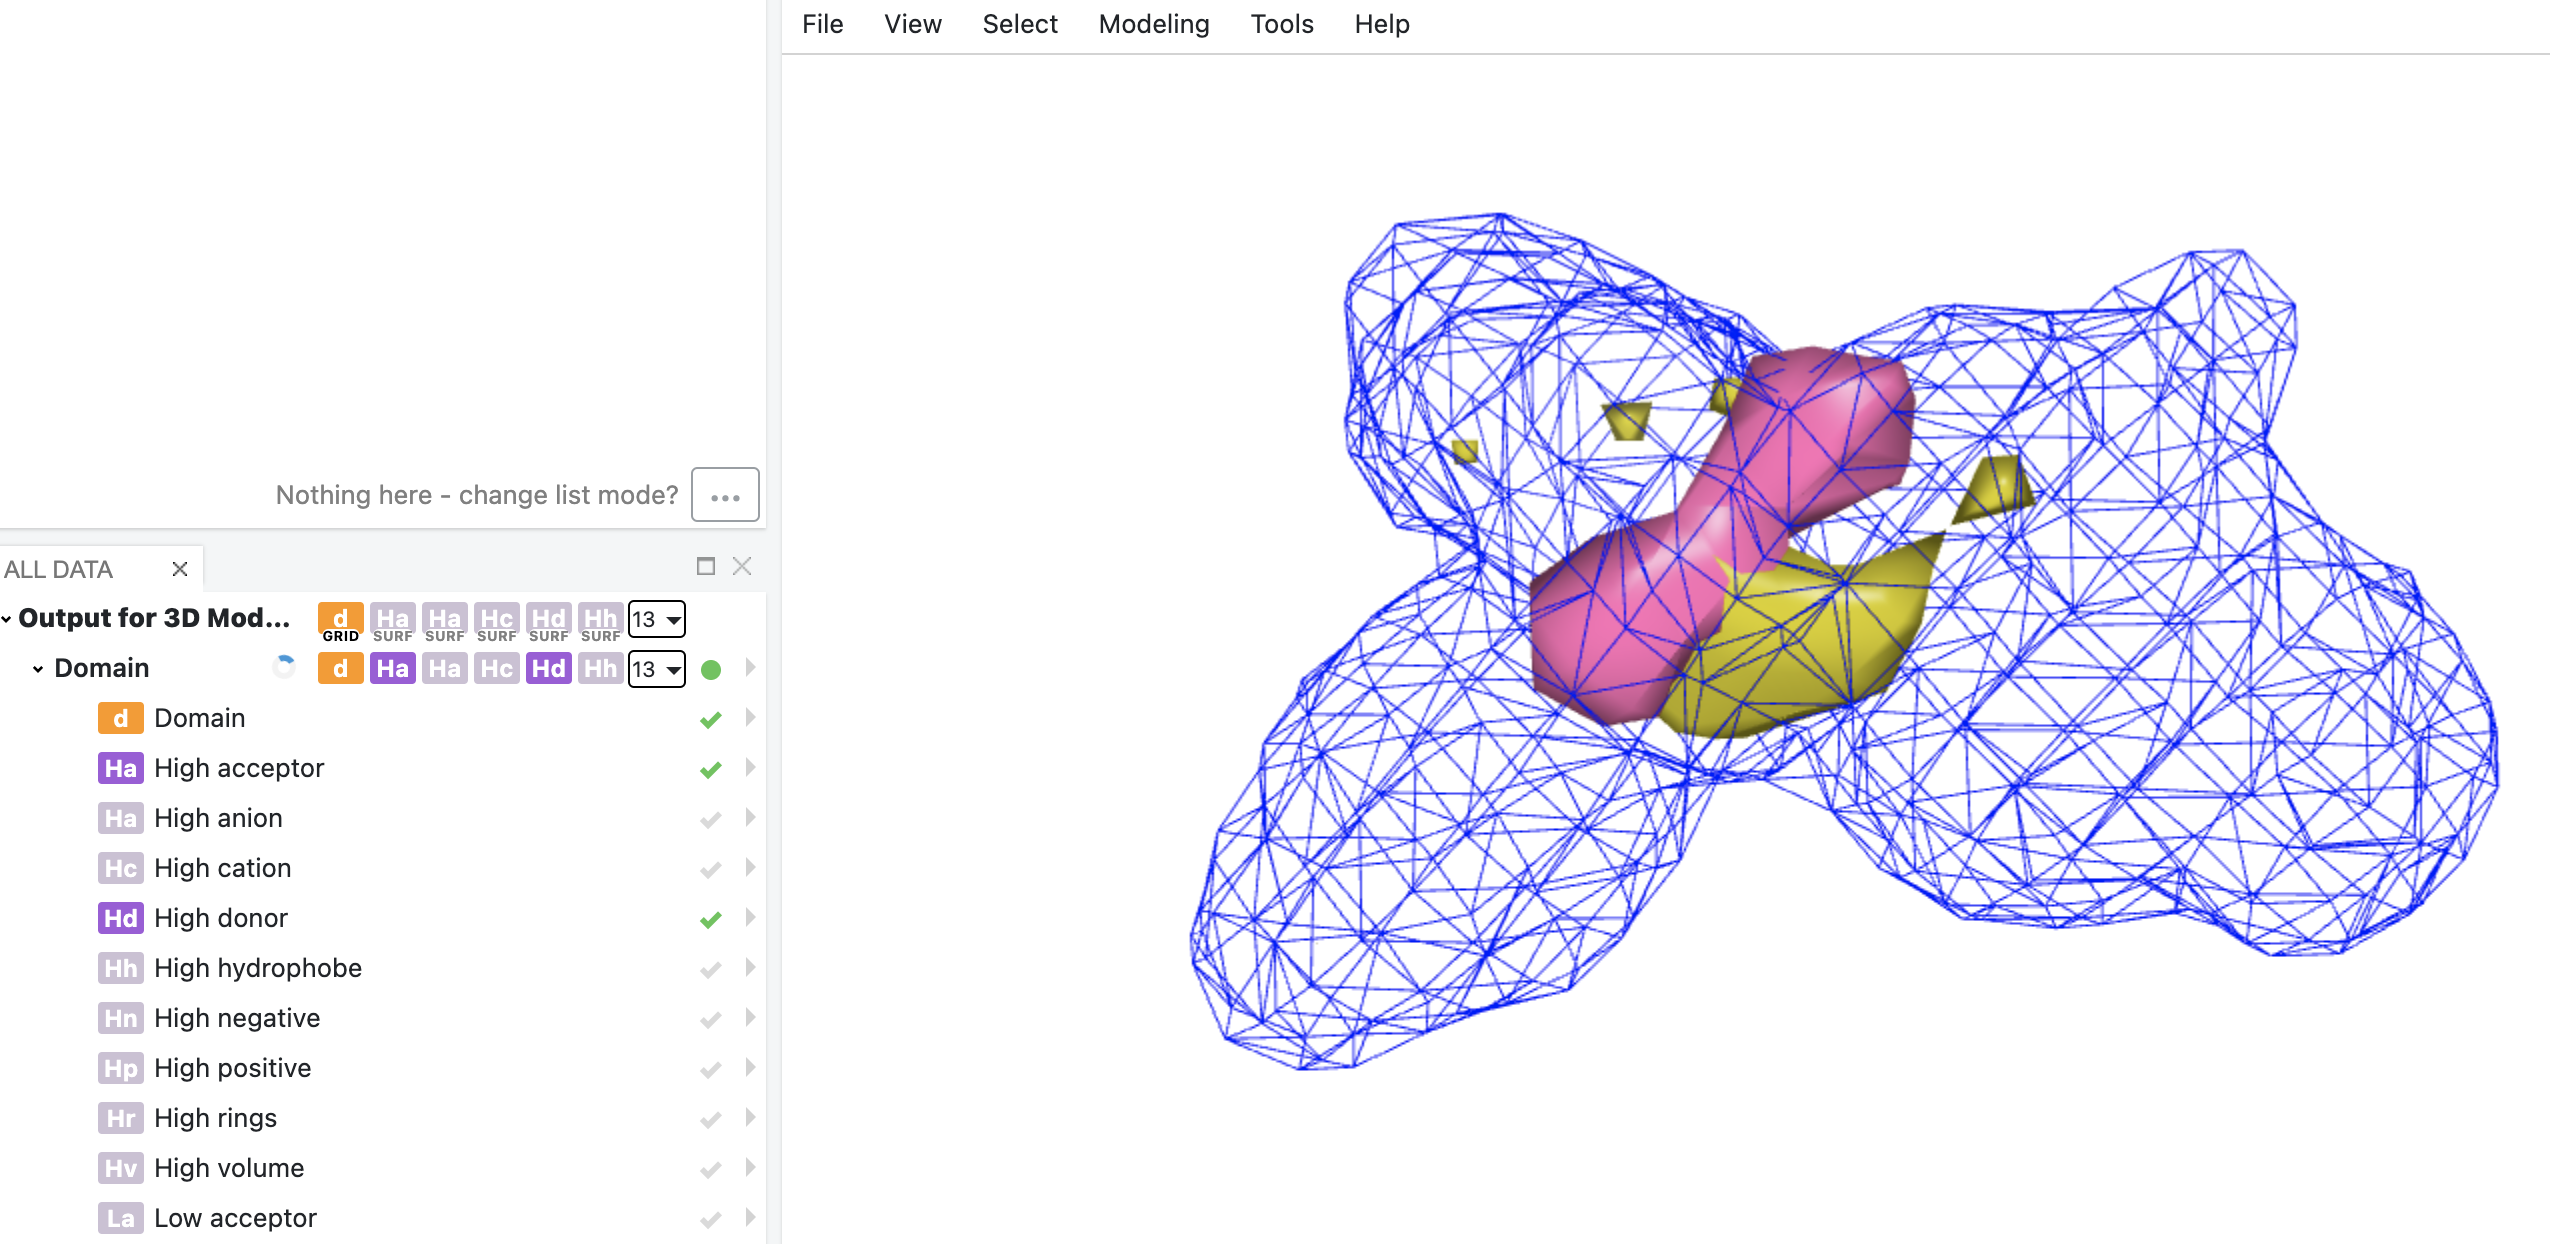
Figure 7. Domain grid and high hydrogen donor (magenta) and acceptor (yellow) surfaces from kPLS interpretation.