Filtering Docking Hits by Interactions Tutorial
This tutorial and the floe described in it are intended to be used with hit lists of docked poses from the OEDocking - Dock into an Active Site for Virtual Screening, the Gigadock Warp Classic, or the Gigadock floes.
For more on GigaDocking, see the tutorials Dock One Million Molecules with Gigadock Floe and Dock Ten Million Molecules with Gigadock Warp and Analysis with Freeform Consensus in the OpenEye Large-Scale Floes package.
The floe takes two datasets, one for the receptor(s) that was used for docking, and one for the docked/posed molecules. It then writes these same two datasets back out with an additional set of fields on each, that can be used to filter the poses. Note that both results generated using a single or multiple receptors are possible to use in this floe.
The floe is purely for filtering of docked poses after docking, and not related to adding or enforcing constraints during the docking processes. The interactions between the target and ligand are perceived using OEInteractionHints from the OpenEye OEChem/OEBio toolkit. Additionally, an interaction fingerprint for each ligand in the receptor is calculated and a Tanimoto is calculated with the interactions from the bound ligand in the receptor as the reference (if available).
Floes used in the Tutorial
The floe used in this tutorial is documented here:
Run the Floe
To run the Filter Docking Hits by Interactions Floe, navigate to the Floe tab in Orion, then:
Search for the Filter Docking Hits by Interactions in the search box or find it in the Classic Floes package.
Click the Floe to open the Job Form.
Run the Filter Docking Hits by Interactions Floe
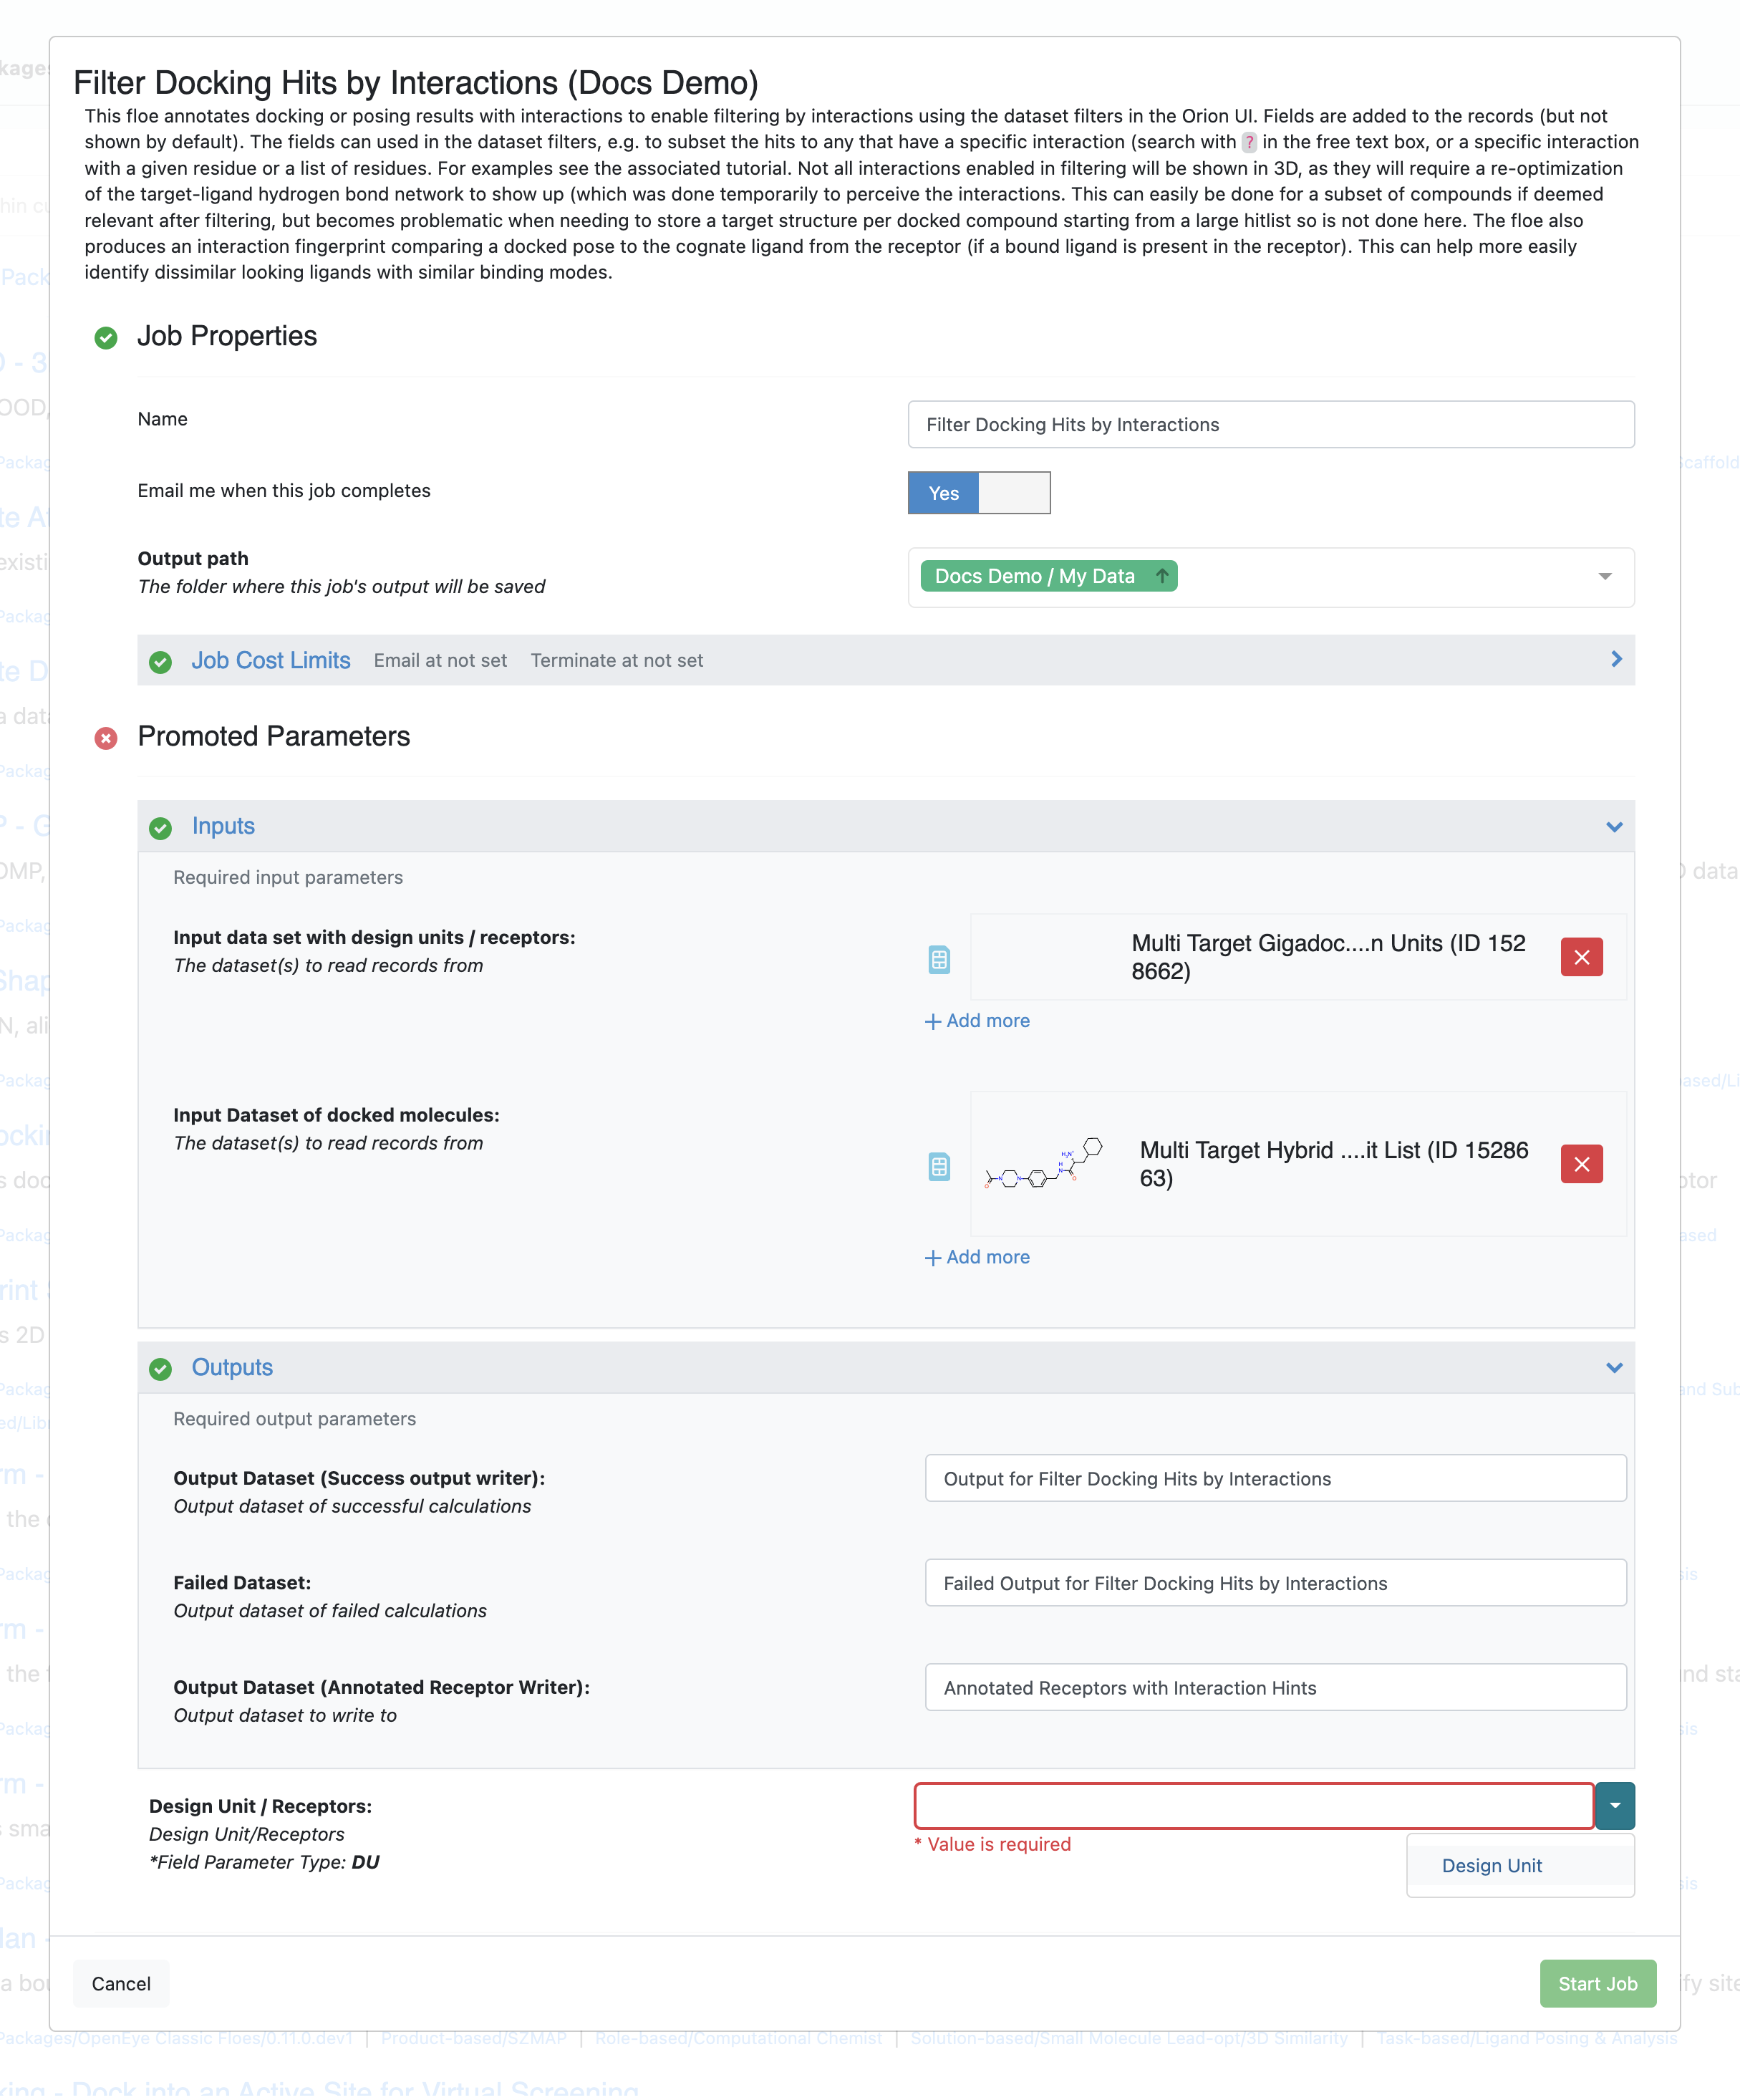
The Floe takes two datasets, one containing the receptor dataset that was used to produce the docking hit list, and one containing the dataset of the poses of the docked molecule (hit list). There is an additional required field for the floe where a user selects the field name of the field containing the design units in the receptor dataset. It should automatically inspect the selected datasets and suggest the correct field if the little arrow next to the field as shown in the image.
Exploring the Interaction Fingerprints
In the dataset there is also a field called “InteractionFingerPrintSimilarity” this is a Tanimoto score (bounded from 0-1), comparing the similarity of a docked pose to the ligand that was bound in the docking receptor (if available) which in our case here is the bound ligands from the crystal structures. The fingerprint is a bitvector constructed by multiplying the number of residues in the target binding site (aggregated if multiple receptors are used) with the number of perceived interactions. Then for each ligand, a bit is turned on of the docked pose has a given interaction with a given residue. This is similarly done for the ligand bound in the docking receptor, and a Tanimoto score of the similarity between the two fingerprints is calculated. Thus, if a docked pose has a high similarity, the compounds are not necessarily similar (not evaluated here, but can be done separately using molecular fingerprints), but instead display similar binding modes, e.g. hydrogen bonds, salt-bridges, and contact interactions in the binding site.
Filtering the Docked Poses
First, we are going to mark both of the newly created datasets as active.
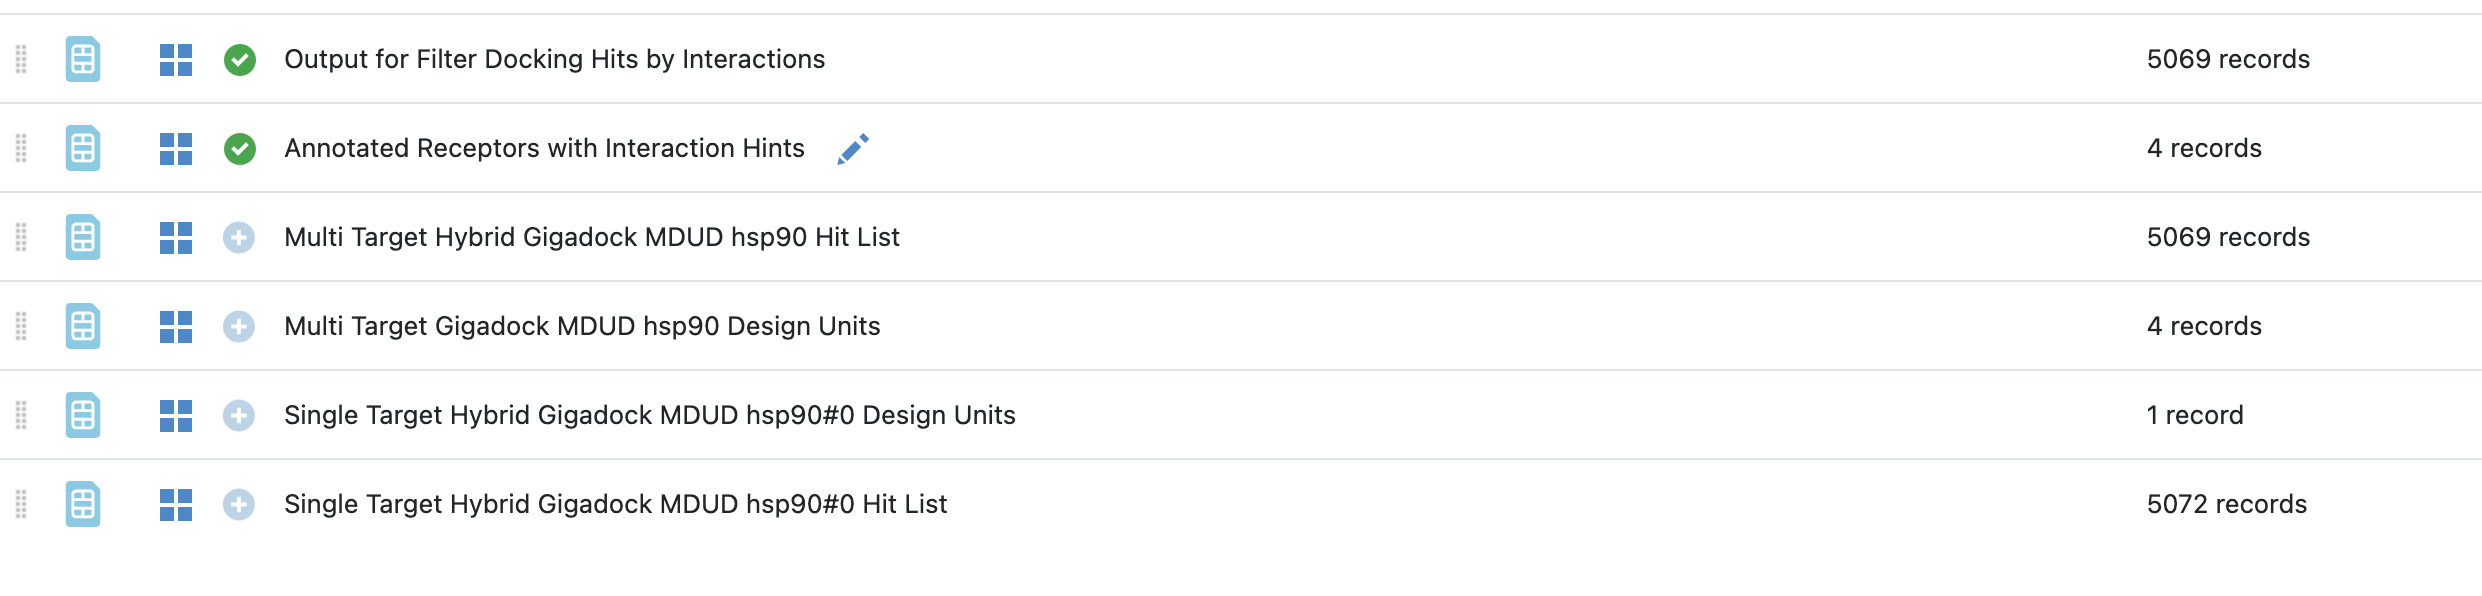
Activate datasets
When analyzing datasets containing a larger number of records, it can be helpful to view them in the analyze page, and in this case of docked poses, we recommend using the “Analyze with 3D” layout, but closing the plotting widget unless there is some specific properties you are trying to inspect while filtering. This makes it easy to filter on specific interactions and inspect the subset of poses that satisfy these interactions.
Each of the fields added to the datasets for filtering is prefixed “Inter_”. They are hidden from the spreadsheet view by default, since they do not add a lot of value in the spreadsheet view. They can be made visible if desired using the “Data Handling” menu.
The first filter we are going to apply is to only show results that have a hydrogen bond. This is done using the ? character in the filter as shown in the figure below.
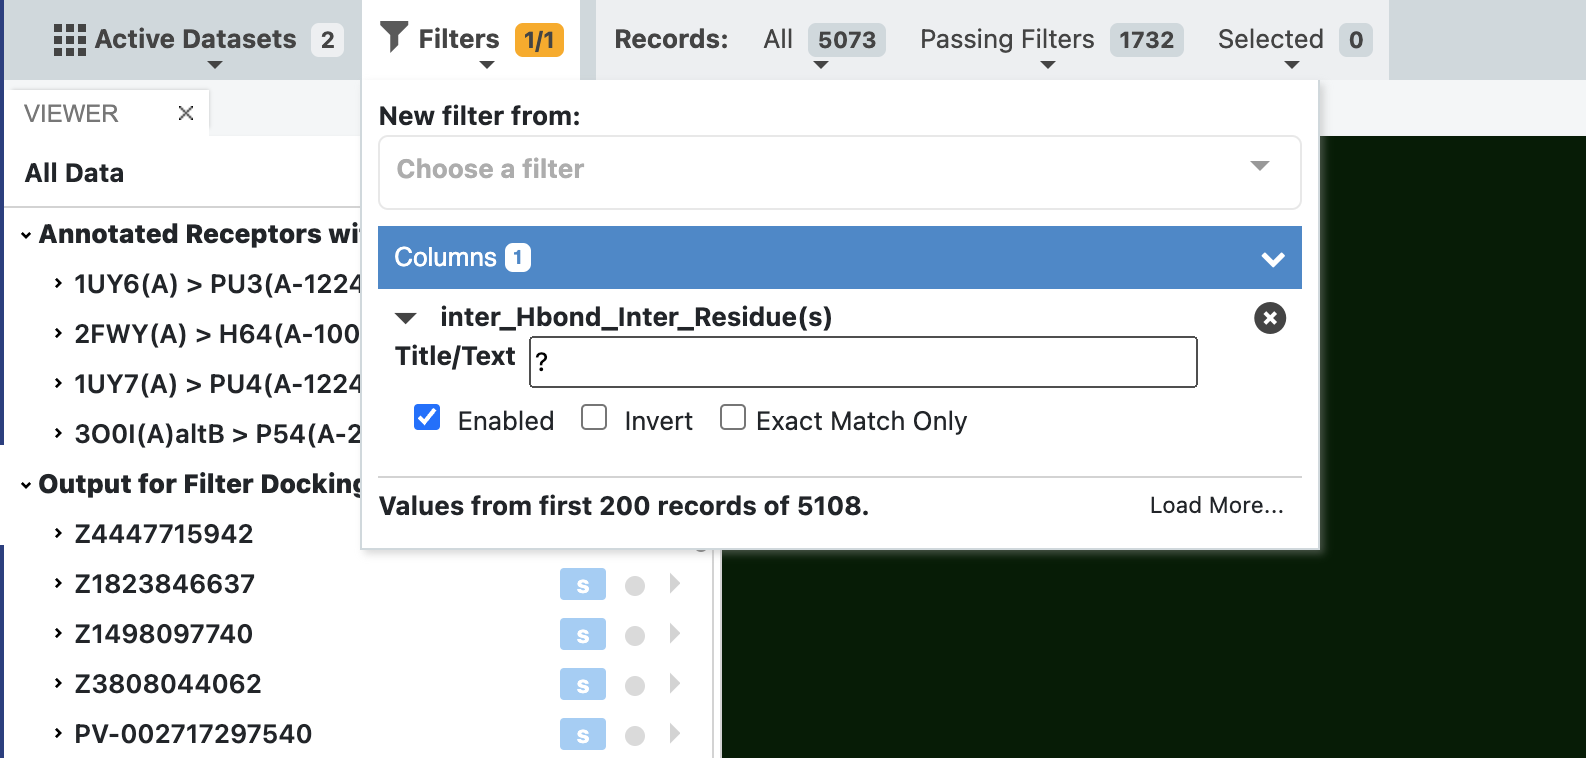
Filter dataset by a wildcard for a given interaction
Once filtering has been applied, you can see the number of records passing the filter is reduced to 1732 from the input 5073 records (all). We can now step through these poses and see the results in the 3D viewer, with interactions being drawn in 3D.
Note
There are instances where an interaction will not be drawn even if the filter states that an interaction is present. This is because during interaction perception the hydrogen bond network was re-optimized for each target-ligand pair, but these results were not stored for visualization, but only retained for annotations for the use with the filter. In these cases it is likely very intuitive to see that e.g. a Histidine or an Asparagine residue could flip or change state to accommodate a hydrogen bond. This implicit flipping or state change is what the docking algorithm does implicitly, and hence why we are annotating the interaction.
Note that there is a field in the datasets from GigaDocking called “Design Unit ID”, which indicates which receptor a given pose was docked against. Use this field along with the same field on the receptor dataset to correctly display the target-ligand poses and have appropriate interactions drawn.
In the above example we identified all poses with a hydrogen bond, but in a lot of cases, it is interesting to explore which molecules have a hydrogen bond (or any other type of interaction) with a specific residue. In this case we can change the filter to write out a specific residue to filter on. See the figure below, where it is also clear that the subset of poses that fulfill this specific interaction is an even smaller subset of only 484 poses.
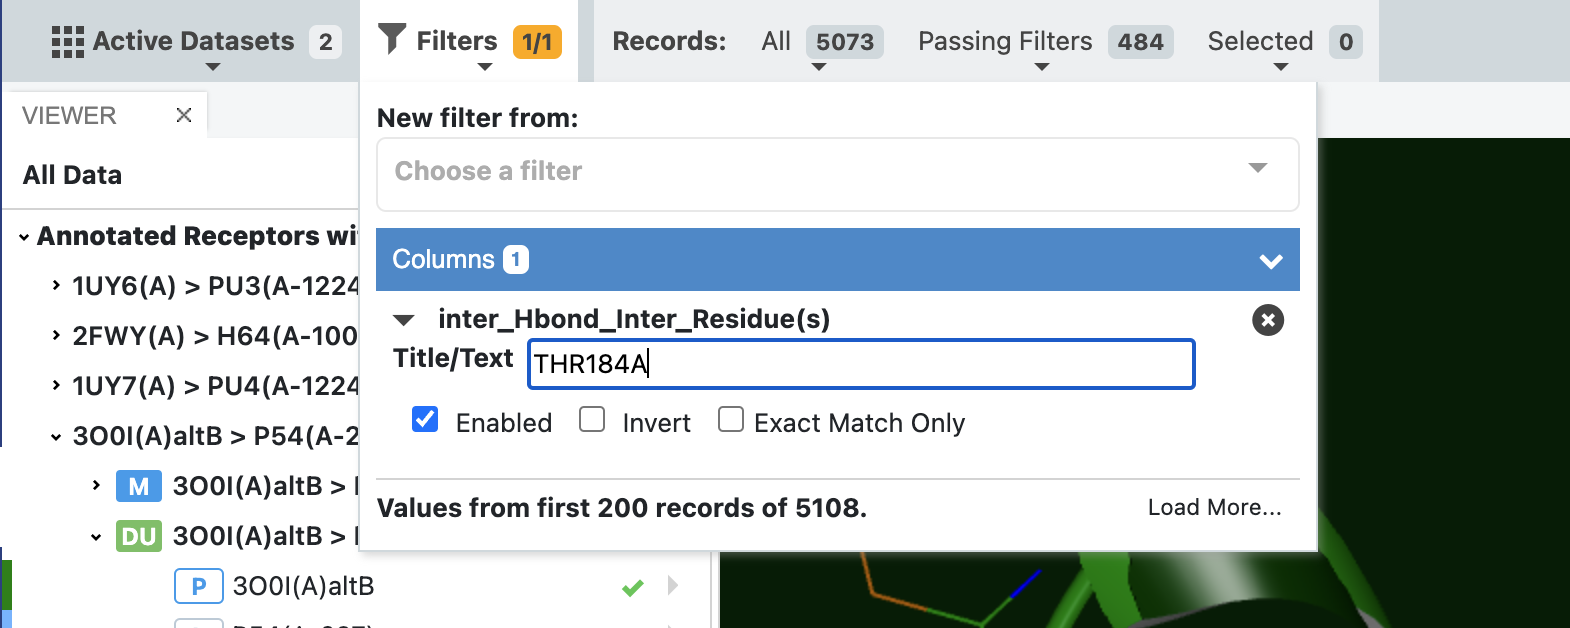
Filter dataset by a specific residue for a given interaction
It is also possible to filter for two specific hydrogen bonds by applying the same filter twice each with a specific residue. Multiple filters can be applied at the same time, but that is beyond the scope of this tutorial.
Next steps
These triaged subset of datasets can be saved out as new datasets and carried forward for further inspection by e.g. Short Trajectory Molecular Dynamics.