How to Use LIME Explainer to Understand and Analyze Machine Learning Predictions
(When is LIME used? What are the the advantages or disadvantages?)
We use a methodology called LIME (Local Interpretable Model agnostic Explanations), which explains machine learning predictions by learning a local interpretable model regarding the prediction. In our system, LIME identifies the important bits in a fingerprint that are responsible for a certain prediction. These bits are then mapped to individual parts of the molecules by finding the “core” atom using the bond degree of the query molecule.
We look for the smallest pattern and only move to the larger “superset” patterns if there is a tie.
Shown below is an annotated image of a molecule with the bits that our algorithm thinks are important for the predicted property (solubility). We translated bit importance to ligand or atom importance and annotated them based on a color scale. We can then view (a) annotated ligands, (b) annotated atoms, and (c) annotated ligand+atom explainer images as shown below.
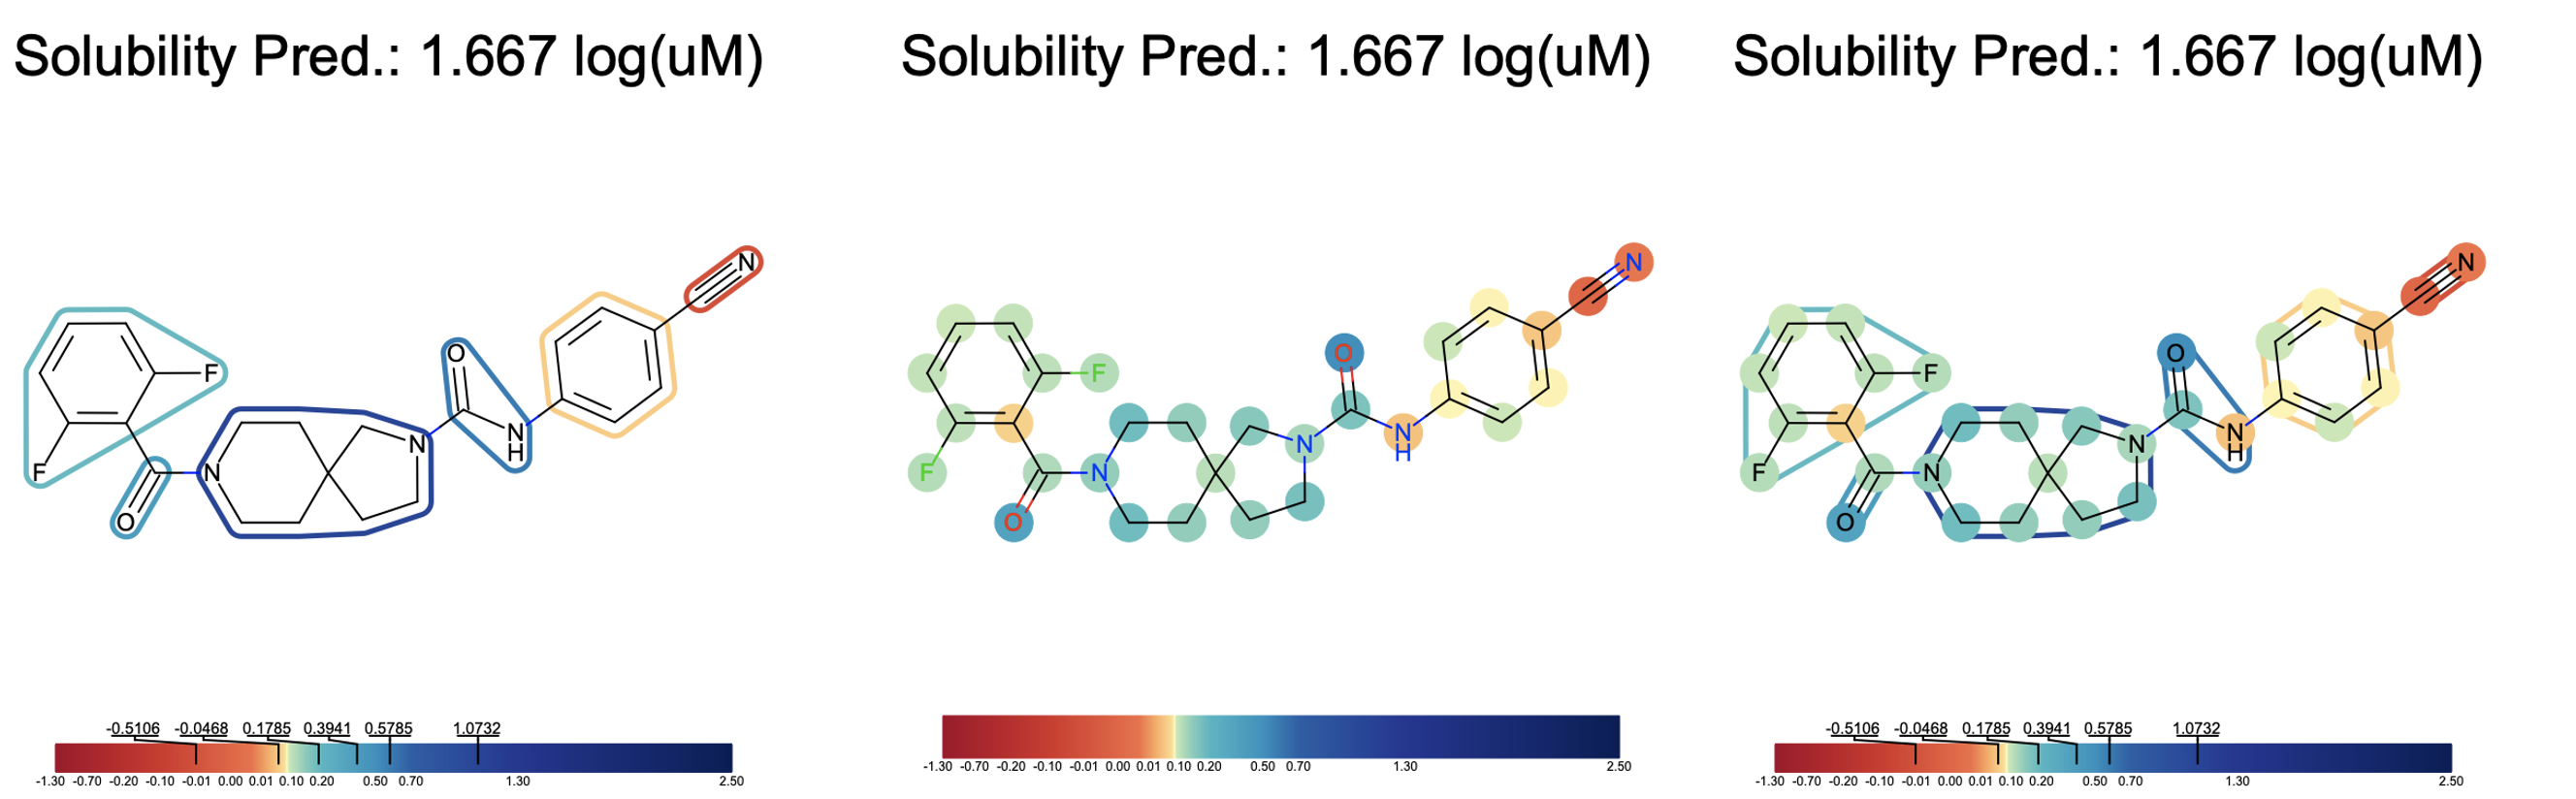
Fragments such as amide bonds and hydroxyl groups are considered more soluble than the hydrophobic (greasy) benzene or nitrile groups. Blue represents hydrophobic areas, red represents hydrophilic areas, and colors in between fall in the range between. The models should be trained on different sets of fingerprints to see which explainer makes sense for the model. The color schema can be tweaked using the QQAR option under the “Parallel Find Property and Explanation Cube”. QQAR indicates the quantile distributions of the LIME votes based on which the default color stops are defined. It allows the user to put color stops on the color bar. By default, it is derived from the quantile of LIME vote distribution to give an even color scale, but that can be changed to a more visually appealing scale if desired.
Library Details of the Floe
Fnn built on Tensorflow Package.
Molecule Explanation built on Lime.
Domain of Application built on Tensorflow Probability.