OEDrawMonomer
Attention
This is a preliminary API and may be improved based on user feedback. It is currently available in C++ and Python.
OEDrawMonomer(image: OEImageBase, monomer: OEMonomer) -> bool
Draws a monomer highlighting its attachment points.
Example:
cystine_data = oechem.OEMonomerData("[H:1]N[C@H](CS[H:3])C(=O)[OH:2]")
cystine_data.SetName("D-Cysteine")
cystine_data.AddCode("Custom", "dC")
cystine = oechem.OEMonomer(cystine_data)
image = oedepict.OEImage(600.0, 600.0)
oegrapheme.OEDrawMonomer(image, cystine)
oedepict.OEDrawCurvedBorder(image, oedepict.OELightGreyPen, 10.0)
oedepict.OEWriteImage("DrawMonomer.svg", image)
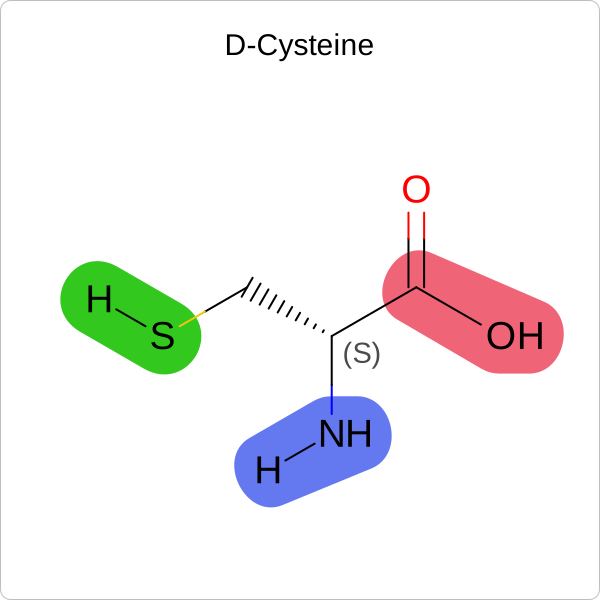
Example of using OEDrawMonomer function
Code Example
Depict Monomer OpenEye Python Cookbook recipe