Perform a ROCS validation run
Background information
A validation run with ROCS allows you to select a set of active molecules and a set of decoy molecules against which to run your query. ROCS is run against both datasets and generates statistics evaluating how well the query discriminated between the actives and the decoys. This becomes particularly important when building a complex query. It suggests confidence levels for this query in future ROCS runs against databases of compounds of unknown activity.
You have just been assigned to a new research project looking for trypsin antagonists. There are no in-house lead molecules or SAR (structure activity relationship) yet. However, you have built several potential queries from published trypsin antagonists using the vROCS Ligand Model Builder. You would like to screen the corporate database to identify some compounds for screening in an in-house biological assay that has just come on-line. You plan to use vROCS to validate your queries on a sample database and identify the most selective query before running it on the larger corporate database.
After completing this tutorial the user will be aware of the steps required to set up and run a ROCS query validation in vROCS and analyze the resulting data. The tutorial will require approximately 10 minutes of personal time and 30 minutes of computer time to complete.
Setup ROCS run
Open a new vROCS session. At the Welcome screen select the
option to Perform a ROCS validation.
In the Inputs dialog you will need to select a query, set of active molecules and set of decoy molecules. The fields that require data input are highlighted in red. Note: if you did not open a new ROCS session you may have some fields populated with previously used queries and datasets.
Check that the Color F.F. dropdown has Implicit Mills Dean
selected as the current color force field. This is the force
field that was used to build the query we will use.
(Note: opening a query that was built with a force field other
than that listed in the Color F.F. dropdown will result in a
warning pop-up. If this should occur then click Yes to accept
the change to the active color force field. This will update the
Color F.F. dropdown and the list of available queries but will
not change your default selection for future vROCS sessions in
Edit > Preferences.)
In the Query input field click on Open…
Use the file browser to navigate to either the directory where you
saved the queries built in Tutorial 1 or to
OPENEYE_DIR/data/vrocs/validation/trypsin/
and open the file Trypsin_1.sq. This is the first of three
queries selected by the Ligand Model Builder and saved, as described
in the tutorial Build/edit a query using the Query Wizard. The files
are provided for you and completion of that tutorial is not a
prerequisite to this tutorial. It will be used as one of the queries for ROCS.
The Trypsin_1.sq query is shown in the 3D window as green sticks. A molecular shape (transparent gray) and color atoms are automatically assigned. For the purposes of this tutorial we will use the ligand query as-is. Tutorial 2: Build/edit a query manually covers the details of editing a query.
Repeat the steps to open queries Trypsin_2.sq and Trypsin_3.sq into the query list.
Click on the first query in the list (Trypsin_1.sq) so that it is highlighted in blue and becomes the active query for ROCS. Click on the text ROCS Run 1 in the Run Name field of the Inputs dialog and edit it to read Trypsin1.
For a validation run two databases are required. The first contains the ‘active’ molecules. This is a dataset that you would like to score highly against the query. The second dataset of ‘decoys’ should contain molecules that you predict will align poorly to the query. In a typical pharmaceutical industry setting the ‘actives’ might be compounds from your current SAR and the ‘decoys’ might be a sub-set of the corporate database. In this tutorial we will use the Trypsin actives and decoys sets from the DUD (Directory of Useful Decoys) database (See [Huang-2006]). The decoy set is property matched to the actives (e.g. similar molecular weight, calculated LogP) but molecules have dissimilar topology in order to provide a challenging validation experiment. The more similar the actives and decoys the more confidence you can have that your query is truly selective.
The databases have been pre-prepared for this tutorial in the following manner. 1. The ligands (actives) and decoys datasets were downloaded from DUD in mol2 file format. 2. Conformers were generated using OMEGA2.2 and default settings (up to 200 conformers for each molecule).
No effort was made to clean up the dataset and remove any duplicates, filter for molecular properties (in theory this was done by DUD) and enumerate stereoisomers. These are all data preparation steps you should consider for your own dataset. However, the purpose of this tutorial is to illustrate the vROCS validation tools, not dataset preparation.
In the Inputs dialog click on the Actives option. Browse to the
database of 49 known active trypsin ligands at
OPENEYE_DIR/data/vrocs/validation/trypsin/trypsin_ligands_confs.oeb.gz.
Similarly, populate the Decoys option with the database of 1664 property matched trypsin
decoy ligands at
OPENEYE_DIR/data/vrocs/validation/trypsin/trypsin_decoys_confs.oeb.gz.
Click Next to set the run options.
The Options dialog provides access to modify the main options for ROCS. It also displays the ROCS command line, should you wish to repeat this run outside the vROCS interface. Full descriptions of all the options are given in the Validation Run options.
The Working Directory is set by default to your vROCS installation directory.
It is good practice to set a unique working directory for each run to avoid the
risk of overwriting output files from old runs. Alternatively, changing the
Run Prefix option would have a similar outcome. Create a working directory named
trypsin_validation in a location of your choice and assign the prefix trypsin1.
Leave all the fields in the Options dialog with their default values except if you are using a computer with low memory. In that situation you may want to toggle Off the 3D View option. This will speed up the ROCS runs because the CPU is not being used for an Open GL 3D display of the aligned query and current database molecule.
Click Next to see the run summary. This lists the run name, database, working directory, etc.
Run ROCS in validation mode
Click Run ROCS to start the run.
As the run progresses the 3D window fills the screen. The query is shown and the database molecules scroll by in their alignment with the query. On the right hand side of the screen the five current top scoring molecules are shown in 2D depiction, together with their TanimotoCombo score (or whichever score type was chosen in the Run Set-up Options dialog). A progress bar at the bottom of the screen indicates how far the run has proceeded. If the 3D view was selected Off then text-based progress information will be displayed.
This run requires about 10 minutes. The relatively slow run speed is due to the large number of color features in the query used. Manually editing the query to remove some of the color features does result in some run time speed up. See the section Editing ROCS queries in vROCS and the tutorial Build/edit a query manually for details on how to accomplish this.
Repeat the steps to set-up and run query Trypsin_2.sq with run name
Trypsin2 and prefix trypsin2 and Trypsin_3.sq with run name Trypsin3
and prefix trypsin3.
Visualize results
Once the three runs are complete you will see results listed for each run on a separate tab in the results spreadsheet at the bottom of the screen. Click on the tab name for the Trypsin1 run to view the results of the first run. On the left side of the screen navigate to the Run Set-up Inputs dialog and select/highlight the query Trypsin_1.sq in the Query list. This action displays the query in the 3D window.
Note
In the case that 3D View was checked off during the runs click Done in the run progress informational panel to restart the 3D window and display the query.
The spreadsheet lists the query and the top 20 scoring conformers ranked based on TanimotoCombo score (or whichever score type was chosen in the Run Set-up Options dialog). The query is also listed as the first entry as an aid to comparison. Make the query visible by clicking in the visibility column (green circle) next to its entry. Select individual results by clicking on their name and scroll up/down the list with the arrow keys to check the alignments look reasonable.
Click on the Show the statistics icon at the far right of the spreadsheet to display the statistics panel for Trypsin1. All the database molecules used in the search are included in these calculations, not just the top 20 that were listed in the spreadsheet for visual inspection. AUC for the ROC curve and enrichment at 0.5%, 1% and 2% are listed for the run, together with their upper and lower 95% confidence limits. The ROC curve is also displayed. An AUC of 0.855 indicates a query that is predictive and well able to separate the actives from the decoys. Change the score used in the calculations from TanimotoCombo to ShapeTanimoto in the Metric dropdown. This will update the ROC plot and statistics to reflect that scoring metric. The AUC is now 0.680, indicating that shape alone is a less selective metric for identifying trypsin actives from decoys and that color is an important addition to the query.
Inspect the score histogram plot by selecting Score Histogram in the Chart dropdown. This displays color coded histograms for the score distribution within the active and decoy databases. A more selective query will have a score distribution with higher frequency of obtaining a higher score (i.e. further to the right of the plot). As before, changing the score metric will update this chart.
Compare results from multiple runs
With the Trypsin1 results tab selected, making Trypsin1 the Base run, select Trypsin2 and Trypsin3 from the Compare to dropdown. Choose ROC plot from the Chart dropdown and TanimotoCombo from the Metric dropdown. The display should look similar to the image below:
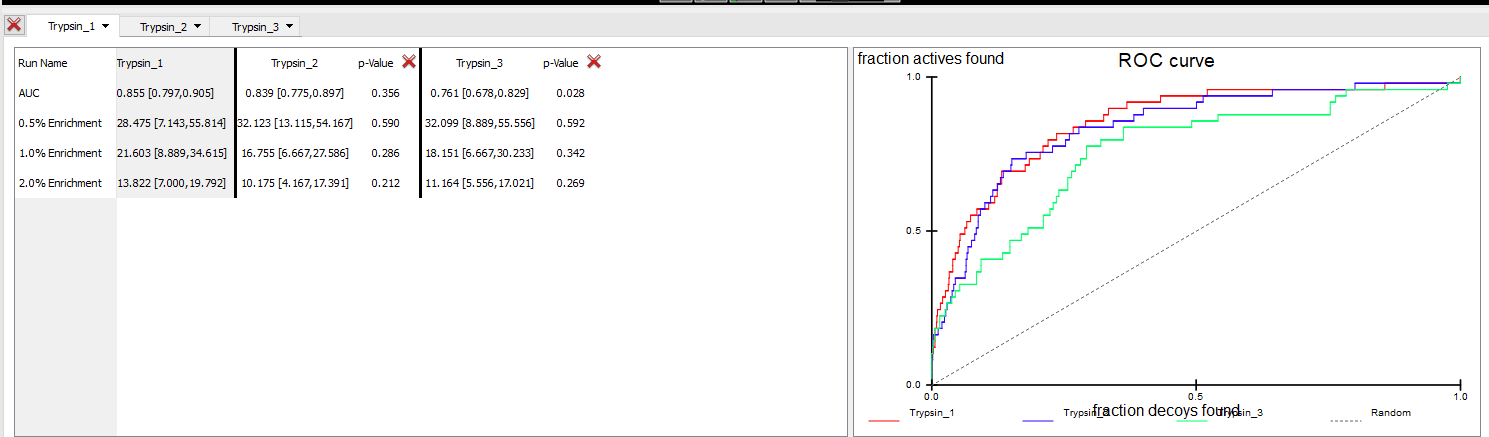
Comparison of runs Trypsin1 (Base) with Trypsin2 and Trypsin3
At a glance the ROC plot shows that Trypsin1 has the highest AUC, suggesting it is the most selective query over the entire database search. Trypsin2 has a similar AUC to that of Trypsin1, suggesting that it is also an equally selective query. However, this is not completely supported by the p-values. Trypsin2 has a p-value of 0.370 when compared to the Trypsin1 base run, indicating that the Trypsin1 query is probably the most selective of the two. Run Trypsin3 has the lowest AUC and a p-value of 0.024 indicating that there is a very low probability of query Trypsin_3.sq being more selective than Trypsin1. The early enrichments for all three runs are comparable, especially when the ±95% confidence limits for each run are compared. However, Trypsin1 has a slightly higher early enrichment (except at 5%), and can probably be considered superior at ranking most of the actives very highly compared to both Trypsin2 and Trypsin3 as the early enrichment p-values for those are mediocre.
Save results
An image of the ROC plot can be saved and used in presentations. Click on the
Trypsin1 run-name tab to make it highlighted as the active view.
The ROC plot currently shows three curves, one each for runs Trypsin1 as well as
Trypsin2 and Trypsin3. In the Choose stats to save... dropdown select the
option to Plot data. In the dialog increase the dimensions
(resolution) to 500 in the first box. Since Maintain original aspect is checked on
the second dimension will update automatically. Use the Browse option to select a
directory of your choice. Change the name of the file form screenshot.png to
trypsin_ROC_plot.png. Click OK to save the image file.
It can also be useful to save a copy of the statistical comparison in the
spreadsheet. Click on the Choose stats to save… dropdown and select the option for
Spreadsheet. In the dialog navigate to a directory of your choice and name the file
trypsin_spreadsheet.csv. A file will be saved containing the AUC and enrichment values,
95% confidence limits and p-values for the three runs currently being compared in the
Trypsin1 tab.
Conclusions
From the comparison we can conclude that Trypsin_1.sq is the most selective query of the three in this validation. When the query models were built Trypsin_1.sq was also ranked highest by the Ligand Model Builder. However, that was on a rigid dataset of the 19 single conformer candidates for the model building. This validation was carried out on a multi-conformer set of active and decoy ligands which is closer to the real life scenario under which the query will be used i.e. the ROCS run of the corporate database to identify potential screening candidates.
This concludes the tutorial “Perform a ROCS validation”.
If you have time some suggestions for further study are:
Try comparing the runs above to the Lingos 2D similarity metric. Lingos is a useful metric and often provides good selectivity
Run a validation of the estrogen receptor antagonist shape + color query built in the tutorial Create or edit a query manually. Compare it against the shape alone and the native ligand. The following files are provided in the
OPENEYE_DIR/data/vrocs/validation/erantag/directory.erantag_grid.sq – a ROCS saved query file of the grid shape
erantag_color.sq – a ROCS saved query file of the grid shape with added color points
3ERT_lig.ent – the ligand from the 3ERT estrogen receptor crystal structure
er_antagonist_ligands_confs.oeb.gb – the dataset of active ligands
er_antagonist_decoys_confs.oeb.gb – the dataset of decoy molecules