Statistics metrics
To facilitate accurate understanding, interpretation and comparison of virtual screening results from multiple (independent) experiments when publishing or presenting research it is important to use consistent and industry standard metrics. To date no official industry standard has been set. However, steps and recommendations were made in this direction at the “Evaluation of Computational Methods” symposium at the 234th American Chemical Society in August 2007 and the follow-up Journal of Computer Aided Molecular Design issue 22 in March 2008. Measures that have become standard in other fields tend to possess the following short list of characteristics:
Independence to extensive variables
Robustness
Straightforward assessment of error bounds
No free parameters
Easily understood and interpretable
The widespread and habitual use of good reporting practice is something that OpenEye is keen to encourage and therefore vROCS implements statistics metrics discussed in these recommendations ([Jain-2008], [Nicholls-2008]).
The metrics reported in vROCS consist of the following and are described below:
ROC (receiver operating characteristic) curve together with its AUC (area under the curve) 95% confidence limits
Early enrichment at 0.5%, 1% and 2% of decoys retrieved 95% confidence limits
When comparing multiple runs p-values are calculated for each enrichment level
ROC Curve
A ROC curve ([Hanley-1982]) in vROCS plots the percentage (or fraction) of actives found on the Y-axis versus the percentage of decoys on the X-axis as the scores decrease. The top scoring compounds are plotted closest to the origin. It gives an indication of how the actives and inactives are ranked as a result of the ROCS run. An ideal ROC plot for a perfectly selective query would show all of the actives being identified first because they score most highly. The plot would shoot up the Y axis at X=0. Then the lower scoring decoys would be plotted and the curve would follow the X axis at Y=100 %. ROC Plot 2 illustrates an ROC plot for an almost perfectly selective query where most of the actives rank more highly than most of the decoy molecules.
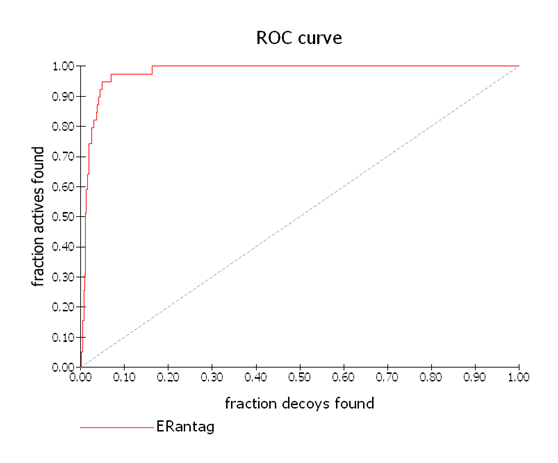
ROC Plot 2
An almost perfectly selective ROC curve with AUC = 0.979 where most of the actives rank more highly than most of the decoy molecules. The dashed diagonal line represents random.
AUC
The AUC (area under the curve of an ROC plot) is simply the probability that a randomly chosen active has a higher score than a randomly chosen inactive. A useless query, one with no better chance of identifying an active from an inactive, would give an AUC of exactly 0.5, as shown by the dotted line in ROC Plot 2. A perfect query is one which ranks all the actives above all the inactives. In this case the AUC would be 1.0. In most cases the observed AUC will be somewhere between these two extremes, and for a highly selective query it will often be in the 0.8-1.0 range. Sometimes an AUC of < 0.5 is observed. This occurs when the query is scoring the decoys more highly that the actives i.e. it is selective for the inactives.
Note
AUC has, for a long time, been a standard metric for other fields. The main complaint against the AUC is that is does not directly answer the questions some want posed, i.e. the performance of a method in the top few percent. It is a global measure and therefore it reflects the performance throughout a ranked list. Thus, the notion of “early enrichment” may not be well characterized by just AUC, particularly when virtual screening methods yield AUC values short of the 0.8-1.0 range. For this reason we include early enrichment values in the ROCS output for a validation run. Early enrichment, while certainly more reflective of the common usage of virtual screening methods, is a property of the experiment conducted, not the methods being studied in that experiment and thus should be used with care.
AUC is quoted in vROCS as a mean value 95% confidence limits. Bootstrapping the data produces a set of samples from which the mean and confidence levels are obtained.
Enrichment
Consider the example in Early Enrichment Comparison below taken from the Nicholls paper ([Nicholls-2008]) which illustrates how AUC provides no information on early enrichment. Both the Early (pink) and Late (blue) curves have an AUC of exactly 0.5. Clearly both examples are equally likely to score an active higher than an inactive (or vice versa) overall. However, the solid (pink) plot also shows that some fraction of the actives is scoring significantly higher than the inactives, while another fraction of the actives scores worse. In a virtual screen it is desirable not to screen the entire database but to select only the top scoring fraction of the compounds. Only the average behavior across the whole database, not the early enrichment of actives in the solid pink plot, is reflected in the AUC. Thus, it is beneficial to report early enrichment in addition to AUC.
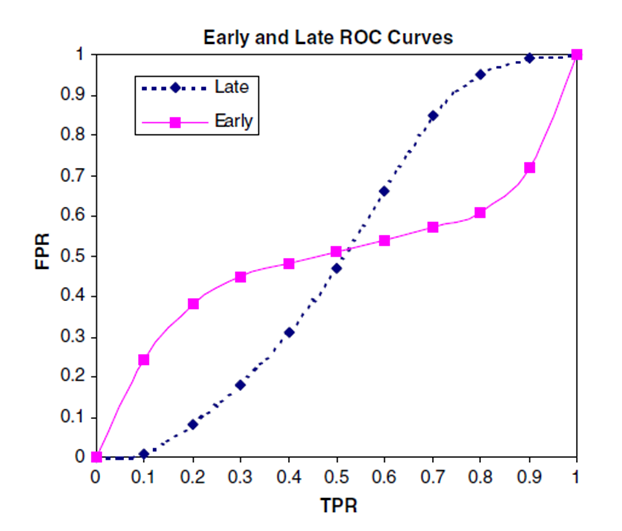
Early Enrichment Comparison
Use of early enrichment values overcomes this deficit in AUC. vROCS reports enrichment percentages at the following values: 0.5%, 1% and 2%. The formulation of enrichment that is used in vROCS reports the ratio of true positive rates (the Y axis in an ROC plot) to the false positive rates of 0.5%, 1% and 2% (found on the X axis in an ROC plot). Thus “enrichment at 1%” is the fraction of actives seen along with the top 1% of known decoys (multiplied by 100). This removes the dependence on the ratio of actives and inactives and directly quantifies early enrichment. It also makes standard statistical analysis of error bars much simpler.
Enrichment values are quoted as a mean value 95% confidence limits. Bootstrapping the data produces a set of samples from which the mean and confidence levels are obtained. Repeating a run within a single ROCS session will always result in identical enrichments. However, enrichments may vary slightly between ROCS sessions because a new random number is supplied to the bootstrapping algorithm for each ROCS session.
p-Value
In statistical hypothesis testing, the p-value is the probability of obtaining a result at least as extreme as the one that was actually observed, assuming that the null hypothesis is true. The fact that p-values are based on this assumption is crucial to their correct interpretation ([Wikipedia-pValue], [Dallal-2001]).
In the vROCS analysis there are two runs being compared, a Base run (A) and a ‘Compare to’ run (B). These two runs use two different queries or methods (e.g. color force fields) to search the same active and decoy databases. We have a statistic, AUC (or % enrichment), one for each distribution (A & B). We would like to know whether AUC-A is statistically better than AUC-B otherwise we cannot say anything about the comparison of the methods. AUC-A and AUC-B alone are not enough to generate anything of statistical significance. To circumvent this we use a bootstrapping method which randomly selects a statistical sampling of the input molecules to repeatedly generate many AUCs.
Traditionally, the null hypothesis is that while the perceived results may be different (e.g. between AUC or % enrichment), the underlying processes are indistinguishable. However, since null-hypothesis testing predicts the likelihood of obtaining a given result if the null hypothesis is true, use of this null hypothesis wouldn’t give any indication of whether method A or method B is better. To avoid this confusion OpenEye has used a modified null hypothesis. The null hypothesis, as implemented in vROCS, is that making a change to the query/method results in a better result (AUC or % enrichment) for run B than run A. Therefore we utilize a one-sided statistical test, not the usual two-sided test, based on the prior assumption that method B is superior to method A. The p-value is the probability that AUC-B > AUC-A and that this difference is due to differences between the methods/queries and not due to random chance alone.
If the null hypothesis holds true then we observe that AUC-B > AUC-A and the p-value tends towards 1.0. If the null hypothesis is incorrect then the p value tends towards 0.0 and the query/method used in run A (Base run) is statistically better than that used in run B (the ‘Compare to’ run). If the results for the two runs are indistinguishable and the result could be due to random chance then the p-value = 0.5.
The plot below illustrates these three p-value extremes. Each curve in the plot represents an example of comparing two ROCS runs. For each run bootstrapping produced a statistical sampling of the data from which the mean and 95% confidence limit values were calculated for AUC and % enrichments. The distribution of differences in AUC (or % enrichment) between the bootstrapped samples for the two runs can also be calculated and is plotted below.
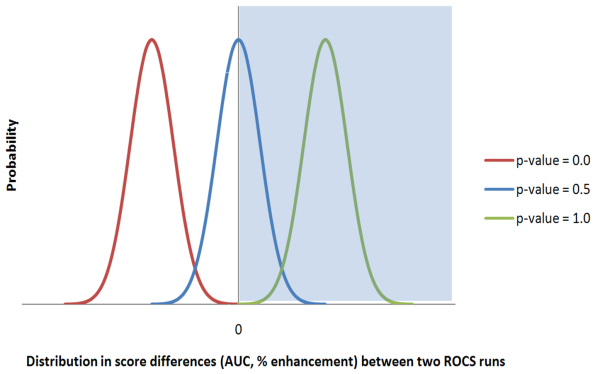
Plot to illustrate calculation of p-values
In the case of p-value = 0.5 half of the distribution is positive and half of the distribution is negative. The p-value is calculated from the integral of the area under the curve from 0 to infinity (the part of the curve that falls within the shaded area). In the case of p-value = 1.0 the difference between run B and run A is always positive and the entire curve is above 0 on the X-axis. The entire curve falls within the shaded area and so the integral is 1.0. In the case where the p-value = 0.0 the difference between run B and run A is always negative. None of the curve falls within the shaded area and so the integral is 0.0
When considering the results from two ROCS runs the p-values should be interpreted as follows. If the p-value tends towards 0.0 then the results for the Base run are better than the ‘Compare to…’ run (run A > run B). If the p-value = 0.5 then the results for the two runs are statistically indistinguishable. If the p-value tends towards 1.0 then the Base run is not better than the ‘Compare to…’ run or, in other words, the ‘Compare to…’ run is giving results better than the Base run (run B > run A).
Consider the example below for three different trypsin queries run against the same active and decoy databases. From the ROC plot for the three trypsin queries, we observe that run Trypsin1 has an AUC intermediate between those of Trypsin2 and Trypsin3.
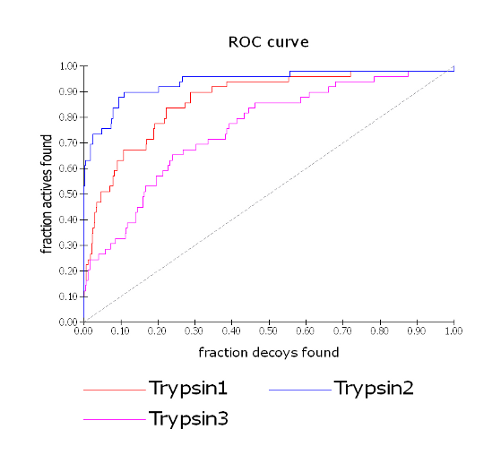
ROC plot for three trypsin queries
Looking at Table 1, where Trypsin1 is the Base run (run A) and is compared to Trypsin2 and Trypsin3 (run B), we see that there is a p-value of 0.979 for Trypsin2. The Trypsin2 AUC of 0.940 mean value with 95% confidence limits of 0.888 and 0.979 is has very little overlap with Trypsin1 at 0.868 with 95% confidence limits of 0.805 and 0.915. The p-value = 0.979 suggests that Trypsin2 is producing superior results and these are due to differences between the queries, not to chance alone. The null hypothesis (run B > run A) holds true in this case. Note that in Table 2, where Trypsin2 is now the Base run, the p-value is reversed. In this case p-value = 0.021 suggests that Trypsin1 is producing inferior results and these are due to differences between the queries, not to chance alone. The null hypothesis (that the ‘Compare to’ run produces superior results to the Base run) can be rejected. Similarly, when comparing Trypsin3 to Trypsin1 in Table 3, the p-value of 0.006 suggests that Trypsin3 is producing inferior results and these are due to differences between the queries, not to chance alone. This is supported by our observations in the ROC plot (see ROC plot for three trypsin queries) where Trypsin3 clearly has the lowest AUC.
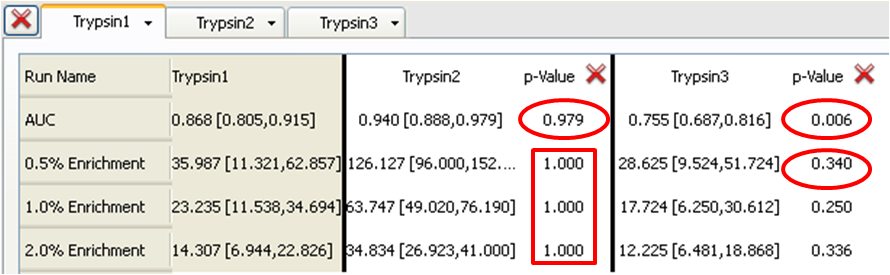
Table 1: Trypsin1 (Base) compared to Trypsin2 and Trypsin3
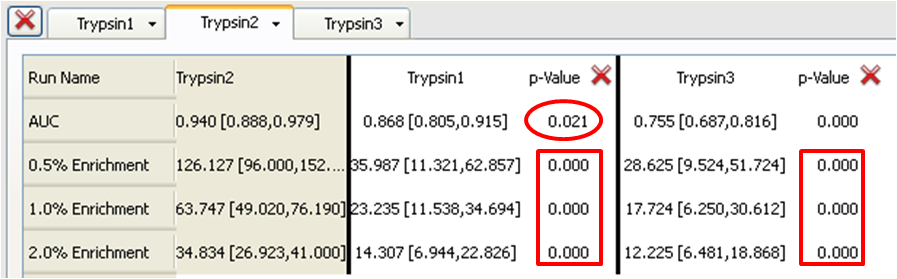
Table 2: Trypsin2 (Base) compared to Trypsin1 and Trypsin3
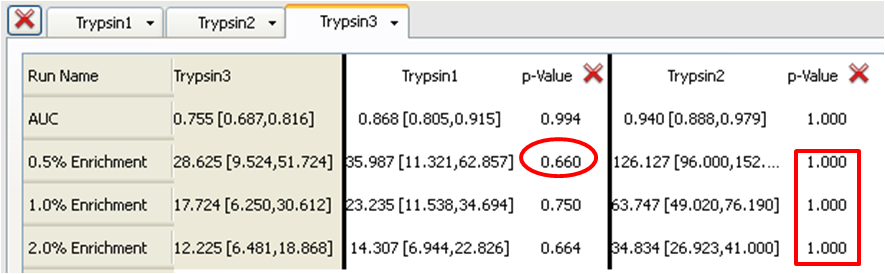
Table 3: Trypsin3 (Base) compared to Trypsin1 and Trypsin2
Now consider the p-values for the 0.5%, 1% and 2% enrichments. Trypsin1 and Trypsin3 have similar enrichment levels. For example, at 0.5% enrichment Trypsin1 is 35.987 with 95% confidence levels of 11.321 and 62.857 while Trypsin3 is 28.625 with 95% confidence levels of 9.524 and 51.724. Each has an average enrichment that is well within the 95% confidence limits of the other. This is supported by p-values tending towards 0.5 i.e. 0.340 when comparing Trypsin3 to Trypsin1 (in Table 1) and 0.660 when comparing Trypsin1 to Trypsin3 (in Table 2) (the inverse around 0.5). From this we can conclude that the query Trypsin1 gives a slightly better 0.5% enrichment than does Trypsin3 (p-value 0.660, from Table 1) but that the differences may not be entirely statistically significant.
In the case of Trypsin2 the enrichments at all levels are much higher than Trypsin1 or Trypsin3 (e.g. 126.127 with 95% confidence limits of 96.000 and 152.381 for the 0.5% enrichment) with 95% confidence limits that do not overlap at all with those for Trypsin1 or Trypsin3. This results in p-values of 1.000 when either Trypsin1 or Typsin3 is the Base run (Tables 1 or 3) (i.e. Trypsin2 is the superior query and the null hypothesis holds true) or 0.000 when Trypsin2 is the Base run (in Table 2) (i.e. Trypsin1 and Trypsin3 are clearly inferior to Trypsin2 and the null hypothesis is rejected). These conclusions are also clearly visible in the ROC plot.
Repeating a run within a single ROCS session will always result in identical p-values for enrichments. However, since enrichments may vary slightly between ROCS sessions, when a new random number is supplied to the bootstrapping algorithm, there may be small differences in p-value for the same combination of runs if repeated in different ROCS sessions.
A typical cutoff for statistical significance of p-values is applied at the 5% (or 0.05) level. Thus, a p-value of 0.05 corresponds to a 5% chance of obtaining a result that extreme, given that the null hypothesis holds. A p-value of less than 0.05 (or greater than 0.95) would give good confidence that the selectivity you observe in your ROC plot is derived exclusively from differences between the two queries or methods and not a result of chance alone.