Results visualization and analysis
The vROCS interface provides multiple tools for results visualization and analysis. The 3D visualization window shows the query where the molecule structure is displayed as green sticks with associated shape and color atoms. All three portions (molecule, shape and color) can be made visible or hidden using controls in the window. The aligned hit molecules are shown as sticks colored by atom type. Buttons at the bottom of the 3D window allow the shape grid, shape atoms, color atoms and color atom labels to be toggled on or off. The color of the shape contour can be changed and the contour level displayed for the shape grid can also be modified using a slider. This is particularly useful when adding color atoms to a grid-based query, for example.
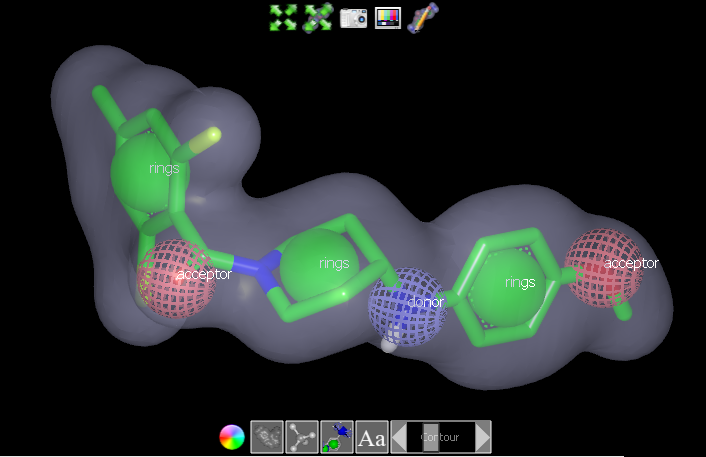
3D visualization window
Icon |
Description |
|---|---|
Fit scene to screen |
|
Fit query to screen |
|
Take screenshot of 3D Window (excludes the gray query information panel) |
|
Show/hide the 3D parameters control window |
|
Edit query: Open the Edit Query panel and add the query editing icons (See Editing ROCS Queries in vROCS). This icon is replaced by a Done Editing icon while in editing mode. |
|
Change color of the contour |
|
Toggle display of the shape contour on/off |
|
Toggle display of shape atoms on/off |
|
Toggle display of color atoms on/off |
|
Toggle display of color atom labels on/off |
|
Slider to adjust display level of the shape contour from 0-3 (default 1). This only changes the contour display and not the query itself |
The 3D parameters control window provides user control for graphics rendering of the image in the 3D window.
The font size for text labels in the 3D display can be altered, as can the stereo visualization type and settings. Not all stereo settings are available on all machines and therefore some stereo options may be grayed out. See the 3D parameters table below for details.
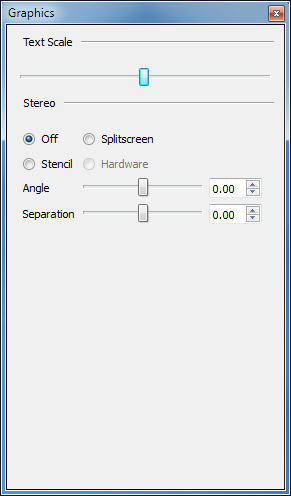
3D Parameters control window
- Text Scale:
Slider to adjust the size of the font for the color atom labels.
- Stereo Off:
Disable stereo graphics.
- Splitscreen:
Display the image in the 3D window in splitscreen stereo mode for unassisted 3D viewing.
- Stencil:
Display the image in the 3D window in a format suitable for viewing with a Zalman Trimon LCD 3D monitor (or similar hardware).
- Hardware:
Enabled only on machines which are capable of performing 3D hardware stereo-in-a-window. Hardware stereo requires a graphics card that supports “stereo in a window” display as well as the appropriate stereo glasses.
- Angle:
Slider to adjust the angle between the images for splitscreen, stencil or hardware stereo modes.
- Separation:
Slider to adjust the separation between the images for splitscreen, stencil or hardware stereo modes.
A results spreadsheet below the main 3D window lists results for
each molecule (with best-fitting conformer number) and its associated scores.
The data is displayed for the run associated with the highlighted Run Name tab.
Individual or multiple molecules can be observed overlaid with the query in the
3D window. Only the top 20 scoring molecules are displayed in the spreadsheet,
based on the Rank by score selected in the Run Set-up Options tab. The spreadsheet
can be resorted by clicking on other column headers, and the top (or bottom) results for
that column will be displayed. Note: this can be a DIFFERENT set of 20 molecules than were
displayed originally. To see ALL
results users are encouraged to use the spreadsheet tools in VIDA.
This can be done by right-clicking on the Run Name tab in the results panel and following
the option to “Open ‘Run Name’ in VIDA”.
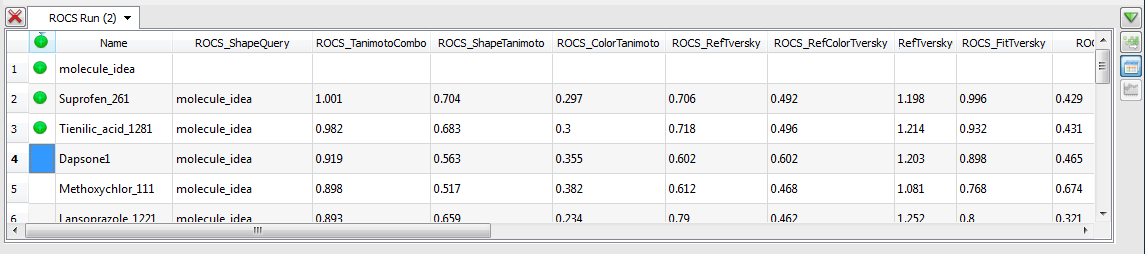
Results Spreadsheet
Icon |
Description |
|---|---|
Display/hide the results panel. |
|
Show the ROCS output. This is the information that would be displayed in the terminal window during a command line ROCS run. |
|
Show the results spreadsheet. |
|
Show the statistics panel. Only available for ROCS validation run. |
|
Make this compound visible in the 3D window and keep it visible while scrolling through other results. |
|
Delete the results for the highlighted Run Name tab |
The spreadsheet columns include the name of the database compound, the name of the query, 14 different scores (see section Report File for full definitions) and a rank column (based on the score type chosen when setting up the run). The available scores are:
TanimotoCombo
ShapeTanimoto
ColorTanimoto
Ref Tversky
RefColorTversky
RefTverskyCombo
FitTversky
FitColorTversky
FitTverskyCombo
ColorScore - score type from older ROCS versions not available as a Rank by… choice but can be used to sort the spreadsheet.
SubTan - score type from older ROCS versions not available as a Rank by… choice but can be used to sort the spreadsheet.
Overlap
The spreadsheet for a validation run has an additional three columns:
Active - indicates whether the compound was in the set of actives (1) or decoys (0)
Rocs_db_index - identifies the placement of each compound in the database ROCS formed by combining the active and decoy sets prior to search. This is required in case a compound in the actives and decoys happens to have the same name.
Lingos similarity - the 2D fingerprint similarity to the query, if the query is a molecule
The spreadsheet can be sorted by any field. If an alternative score is chosen for sorting then the best 20 molecules by that score will be displayed. This may be a different set of molecules from the original 20 displayed because vROCS sorts and retrieves data from the saved structure hitlist and report files. Additionally, the spreadsheet includes controls to show/hide or mark each molecule. This allows the user to compare overlays between compounds and against the query in the 3D visualization window as well as control the data that is saved out.
The most common scores used are ShapeTanimoto (shape only) or the default score, TanimotoCombo (shape + color). Tanimoto scores should be used when the query and database molecules are a similar size. Tversky scores include a weighting factor to deal with size differences and are therefore useful when the query is small and the database molecules are large, or vice versa. The RefTversky score is weighted for a small query e.g. to find all instances of a known active scaffold fragment in a database. The FitTversky score has the opposite weighting.
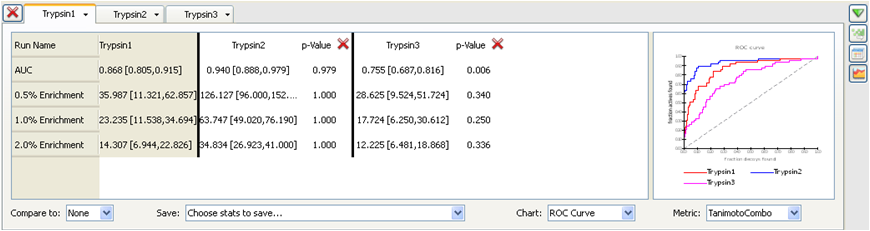
Additionally the validation runs have a statistics panel available. It provides several statistical metrics for analysis of the quality of the results. The metrics reported in vROCS consist of the following and are described below:
ROC (receiver operating characteristic) curve together with its AUC (area under the curve) 95% confidence limits
Score histogram to examine the distribution of scores obtained for the active and decoy datasets
Early enrichment at 0.5%, 1% and 2% of decoys retrieved 95% confidence limits
When comparing multiple runs p-values are calculated for each enrichment level & AUC
These metrics and the rationale behind their inclusion are fully described in the section Statistics Metrics.
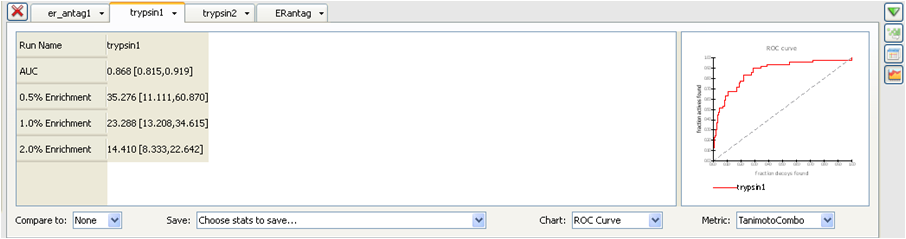
Statistics Panel
- Compare to:
Add the results from another run to the statistics spreadsheet and calculate the p-values between the two runs. The additional run will also be plotted in the ROC curve and score histogram. The dropdown lists None, Lingos and all other validation runs available from that vROCS session. Lingos is the 2D similarity and is always available as a comparison choice with molecular queries. Default is None.
- Save:
Chose score, plot or spreadsheet data to save as
.csvformat for the active run. If another run(s) is selected in theCompare tofield that data will also be saved. Select Plot data to save an image file of the ROC plot or score histogram.- Chart:
Select from a dropdown whether to display the ROC curve or the score histogram
- Metric:
Select one of the scores (metrics) to be used for the ROC plot or score histogram. These correspond to the score columns in the results spreadsheet
The statistics panel includes a spreadsheet listing the values for the statistics metrics, together with score histograms and an ROC plot from which is calculated the AUC (See section Statistics metrics. The ROC plot graphs actives vs decoys and a higher AUC represents greater selectivity in favor of the actives. The ROC curve can be plotted for any of the 14 scores available (See ROC plot). Note that changes to the score used for the ROC plot will probably cause changes to the AUC and enrichment values.
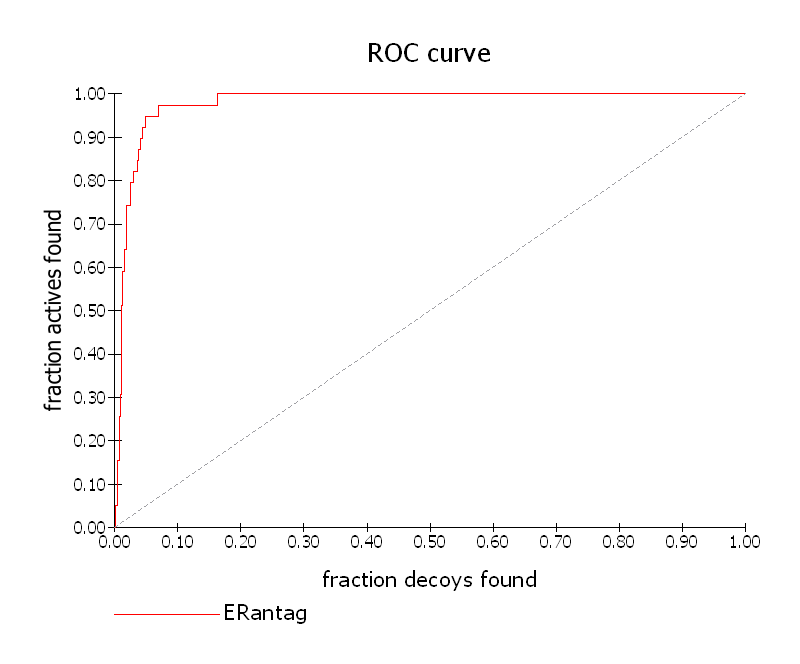
ROC Curve
Instead of the ROC plot a score histogram can be plotted. The score histogram compares the distribution of scores for the actives and the decoys (See Score Histogram). The better the AUC (closer to 1.0), the greater the separation will be, in general, between the two histograms, with the actives scoring higher and further to the right than the decoys.
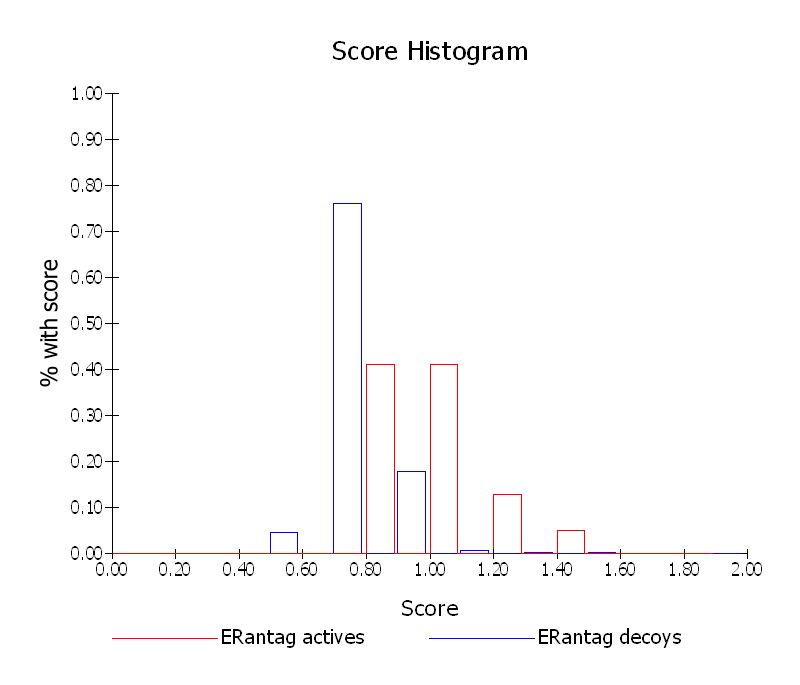
Score Histogram
To better visualize the plots the plot area can be resized by dragging the divider between the plot and spreadsheet. The statistics panel can also be resized by moving the divider between the panel and the 3D window.
Multiple runs can be compared in the spreadsheet.
The statistics panel enables the comparison of multiple validation runs
using the Compare to dropdown and the data and plots can be exported to
a CSV (.csv) file for import into other applications or statistics packages.
The statistics for multiple runs will be
displayed side by side in a spreadsheet and these runs will be plotted
together on the ROC plot and score histogram for a direct comparison.
This could help to answer the following questions:
Is one query more selective than another on the same database?
Is the query selectivity the same for multiple training databases? Was a representative validation database selected?
When comparing two runs it is useful to gauge whether one is giving
statistically better results than another. For this reason p-values
are displayed in the comparison (see Statistics for comparison of ROCS runs).
A low p-value suggests that the base run is statistically better
than the run selected in the Compare to dropdown. For a description of p-values see
section Statistics Metrics. If comparing particularly
large data sets it is wise to pay attention the memory foot print – save and
close any unneeded runs.
Statistics for comparison of ROCS runs
While it is more open to individual interpretation, inspection of the overlays in the 3D window should not be overlooked as a valuable tool for results interpretation. Can additional knowledge of the receptor be applied that validates the ROCS alignments?